
(Source: Khakimullin Aleksandr/Shutterstock.com)
This article focuses on the outlook for the Permian Basin, which will continue to grow beyond 2029 driven by its large aerial extent of economic drilling at oil prices of less than $50 WTI. Rig count trends, top operators, midstream buildout, merger and acquisition (M&A) activity and a topical discussion on well spacing are presented.
After supporting Permian operators to spend vast sums of money during 2016 and 2017 to buy land inventory, Wall Street shifted its scorecard on the industry from one of a discounted cash flow or net present value (NPV) approach to one predicated on demonstrating sustainable free cash flow to return to shareholders. This paradigm shift from Wall Street has been abrupt, and public E&P executives hear the message and are pivoting business strategies. Given the nature of the industry, the pivot will take some time but is well underway. This will impact the rate of growth in the Permian as less capital is put into the ground. But the basin supply dynamics remain strong. The Wall Street sentiment to E&P companies is currently negative, but industry innovation continues strong and more efficiencies are on the way. Enverus Drillinginfo is confident Permian Basin economics are strong enough to both grow production and return cash to shareholders. At some point, Wall Street sentiment is expected to shift back and support the great advances many companies are making.
Production forecast
Enverus Drillinginfo forecasts U.S. oil production to grow by 1.5 MMbbl/d in 2019 to an average of 12.3 MMbbl/d, an increase of 13% over 2018. This is moderated from the 2018 record growth of 17%, or 1.6 MMbbl/d. From 2020 to 2023, production growth will continue to moderate and increase by another 3.2 MMbbl/d (or an average 6%) to reach 15.5 MMbbl/d in 2023 (Figure 1).
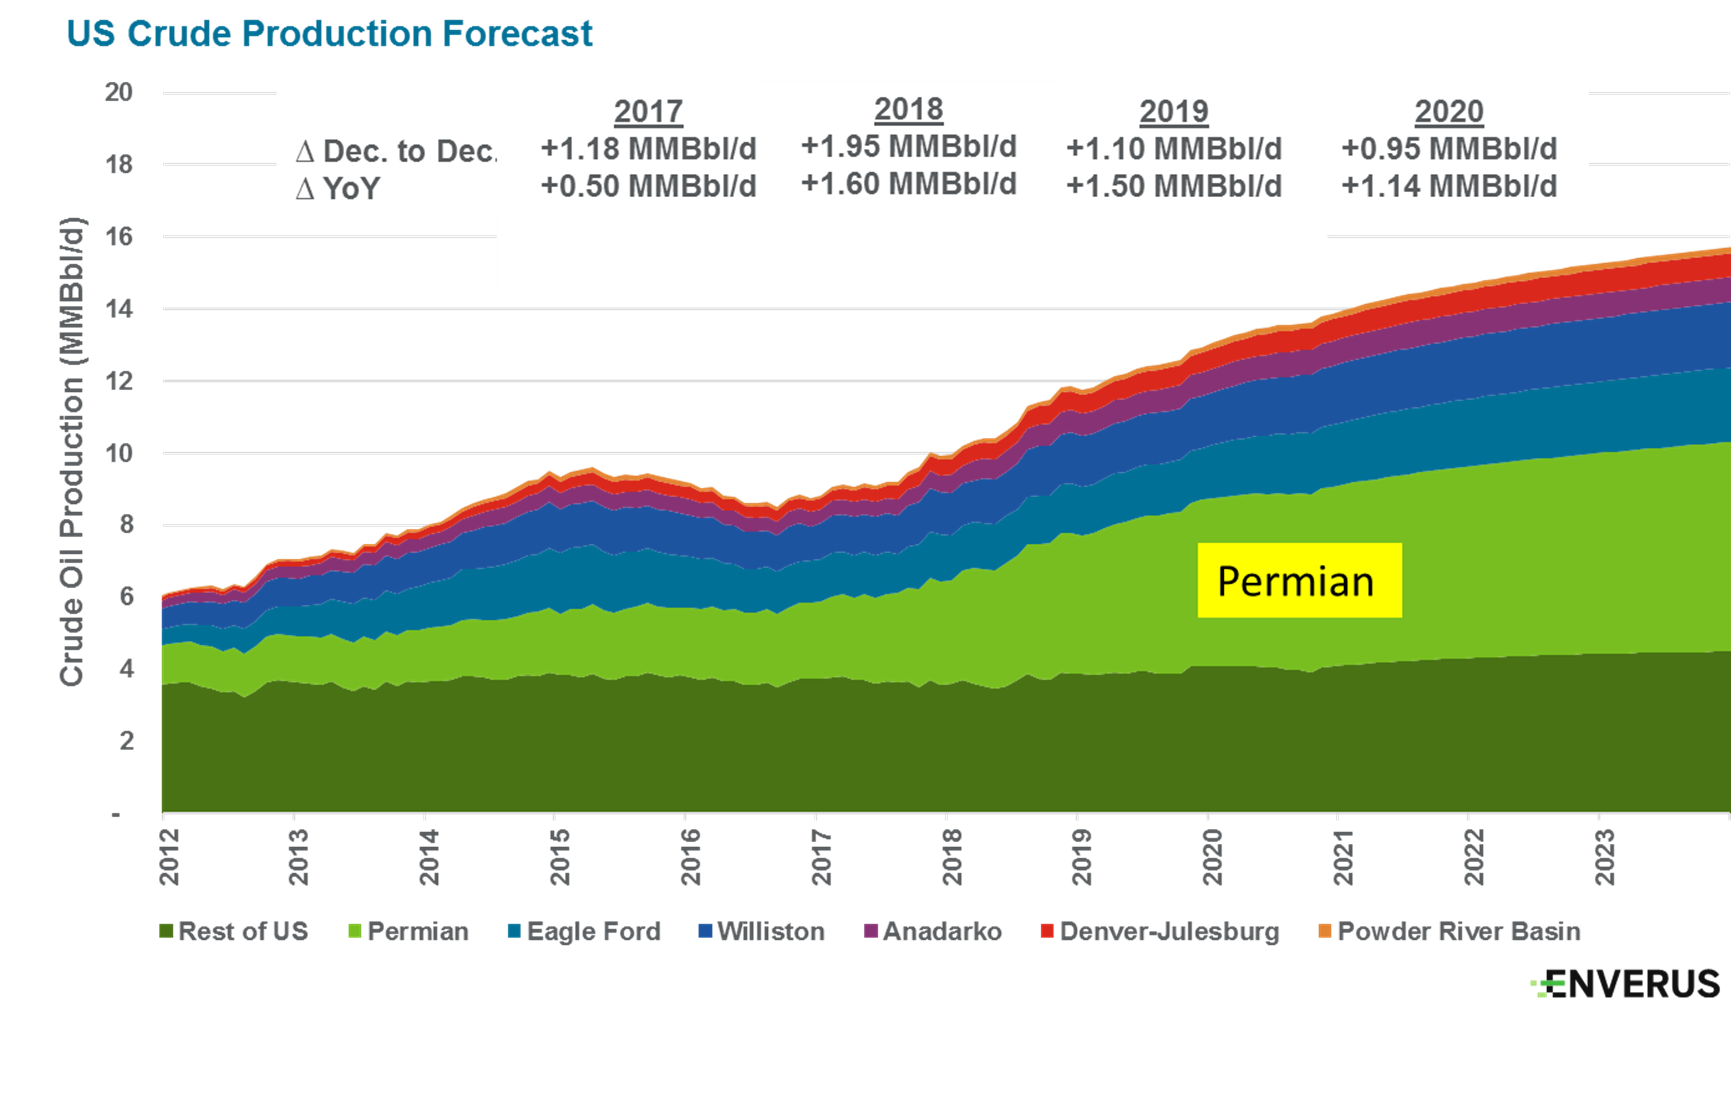
The Permian Basin leads U.S. oil growth and accounted for 1 MMbbl/d, or 62%, of the record 2018 growth. The Permian will continue to lead and is forecast to grow by another 0.8 MMbbl/d in 2019 to an average 4.3 MMbbl/d. By 2023, Permian production is forecast to average 5.7 MMbbl/d.
In 10 years U.S. production is expected to reach about 17.3 MMbbl/d, at which time the Permian will account for 40% (or 6.8 MMbbl/d) of U.S. production—up from its 35% share this year. Longer term, the Permian will continue to grow beyond 2029, which is forecast to underpin a flattening U.S. oil production profile.
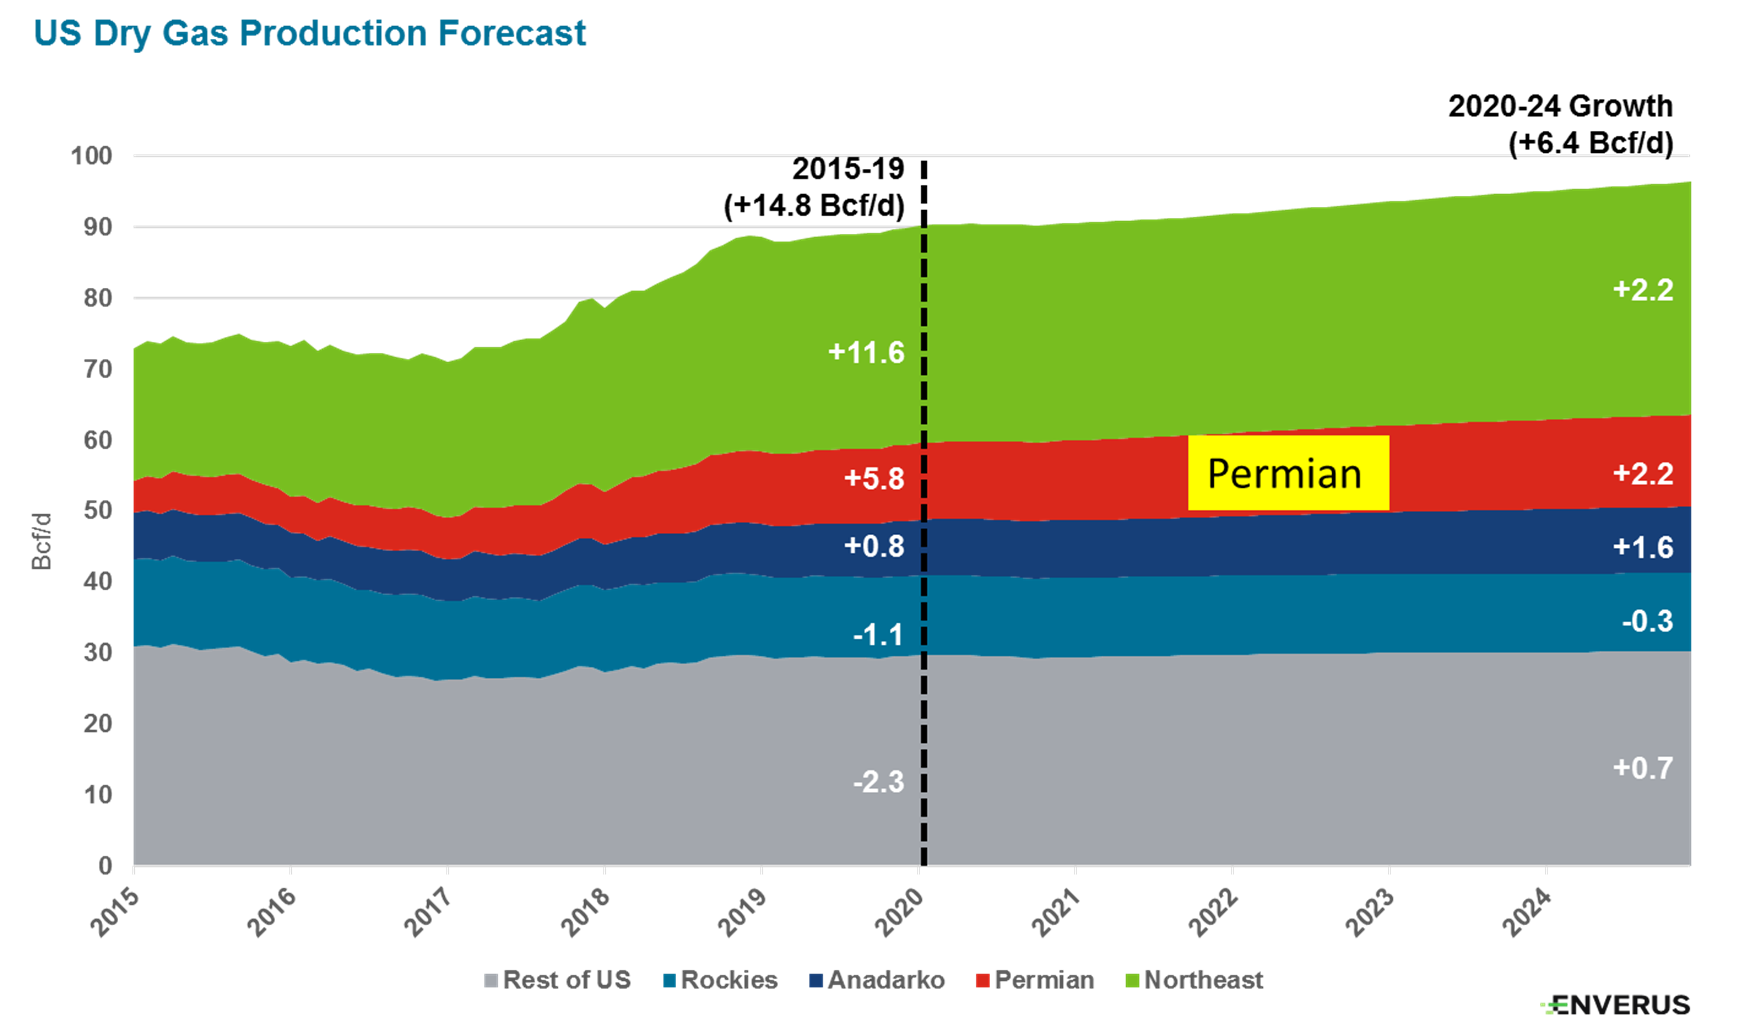
For U.S. gas, growth also continues. Although, like oil, it is at a slower pace from recent history. From 2015 to 2019, gas production grew by 14.8 Bcf/d to reach a forecast average of 88.8 Bcf/d in 2019. Growth will slow by nearly 60% to add another 6.4 Bcf/d by 2024. The Permian and the Northeast will contribute equally to the growth at 2.2 Bcf/d during the next five years (Figure 2).
Well-level economics driving growth
This growth in U.S. oil production is driven by substantial swaths of land that are currently de-risked and economic at prices of $55 WTI or less. While the Permian accounts for much of this profitable drilling inventory, portions of virtually all other major resource plays contribute to this growth, including the Bakken and Eagle Ford.
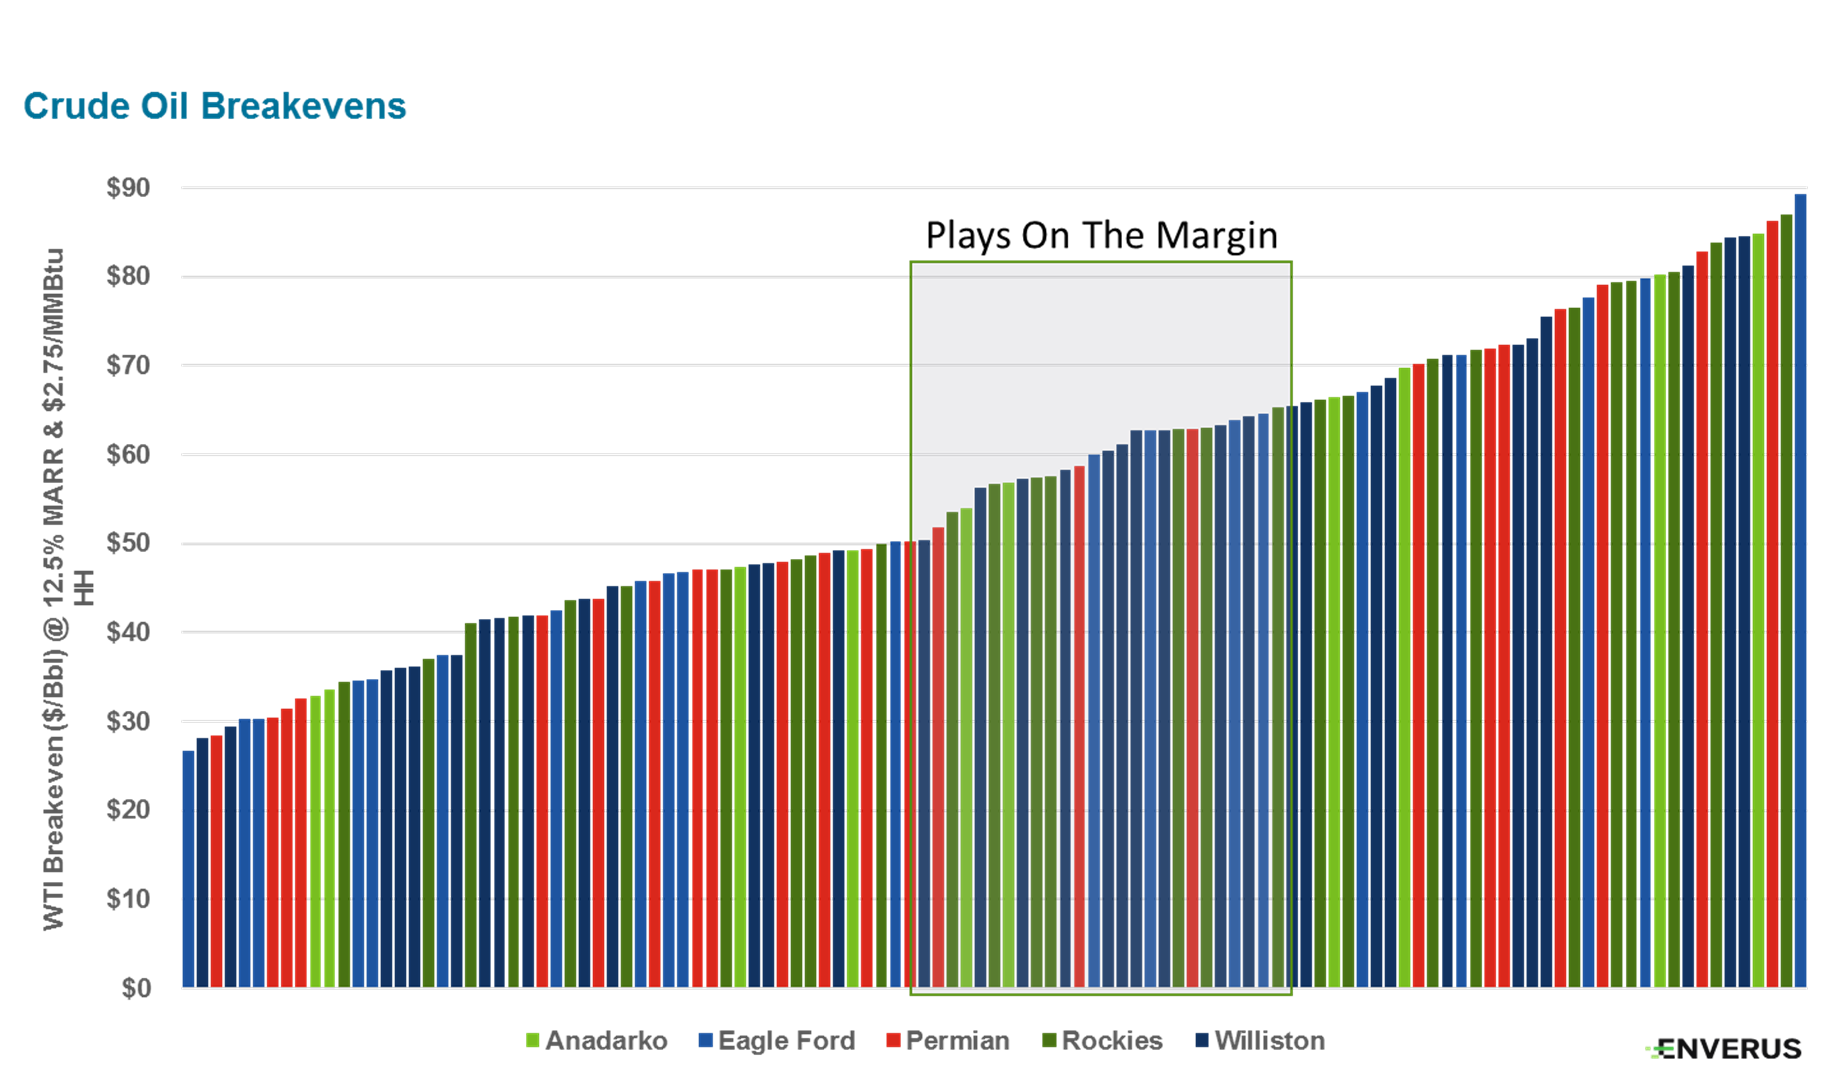
Based on a bottoms-up methodology, Enverus Drillinginfo maintains well economics on more than 200 distinct groupings of areas predicated on well history and current cost economics. Shown in Figure 3 are breakeven economics for oil. There is a substantial inventory that is profitable based on half-cycle (driven by drill and complete costs) economics at oil prices less than $50 with a minimum return threshold of 12.5% (Figure 3). The second key takeaway from the breakeven analysis is the continuum of plays that become economic as oil prices rise. The “Plays on the Margin” noted in Figure 3 become economic at a WTI price of between $50 and $65.
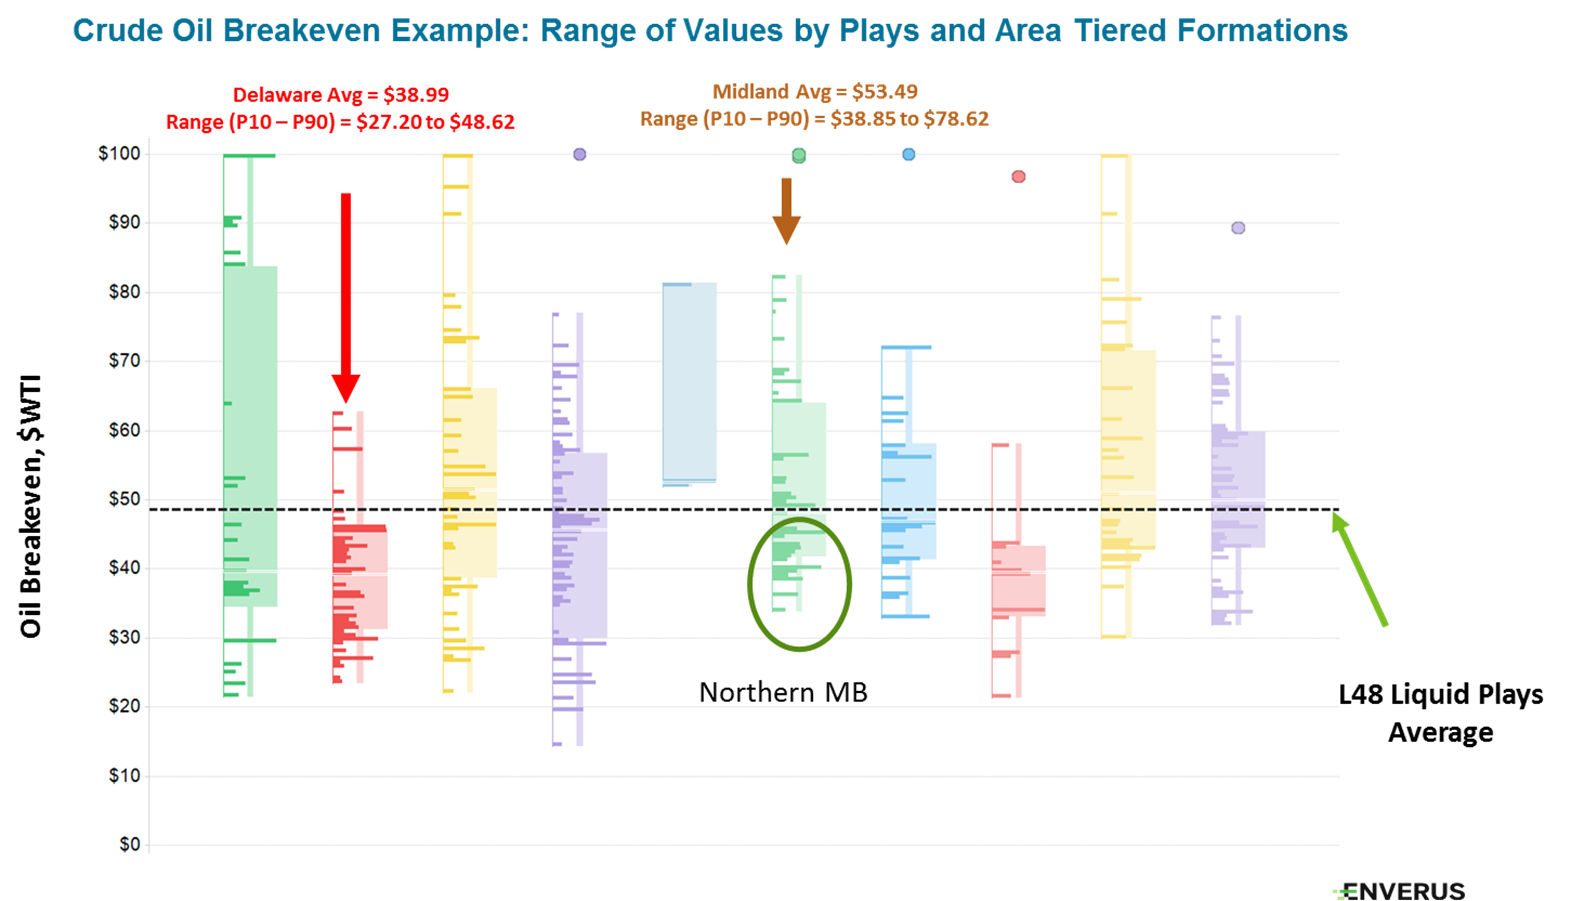
In aerial extent, the Permian’s Wolfcamp, Spraberry and Bone Spring formations lead the inventory counts of drillable economic locations. Within the Permian, the top tiers of these formations lie in the Delaware Basin with breakeven economics of less than $33/bbl. Average Delaware Basin breakevens are $39/bbl, while in the Midland Basin the northern section rivals the Delaware while the southern section remains challenged at $50 WTI (Figure 4).
Other leading areas outside of the Permian include the top areas in the Eagle Ford such as DeWitt County, Texas, and the Sugarkane area of Karnes County, Texas. The Antelope area of the Williston Basin also is leader in the race for breakeven economics.
Permian top operators
With its transformational $57 billion buy of Anadarko Petroleum, which closed Aug. 8, Occidental Petroleum extended its lead as the top Permian oil producer, currently accounting for more than 10% of the basin’s gross operated production and more than 50% ahead of the second largest producer, Concho Resources.
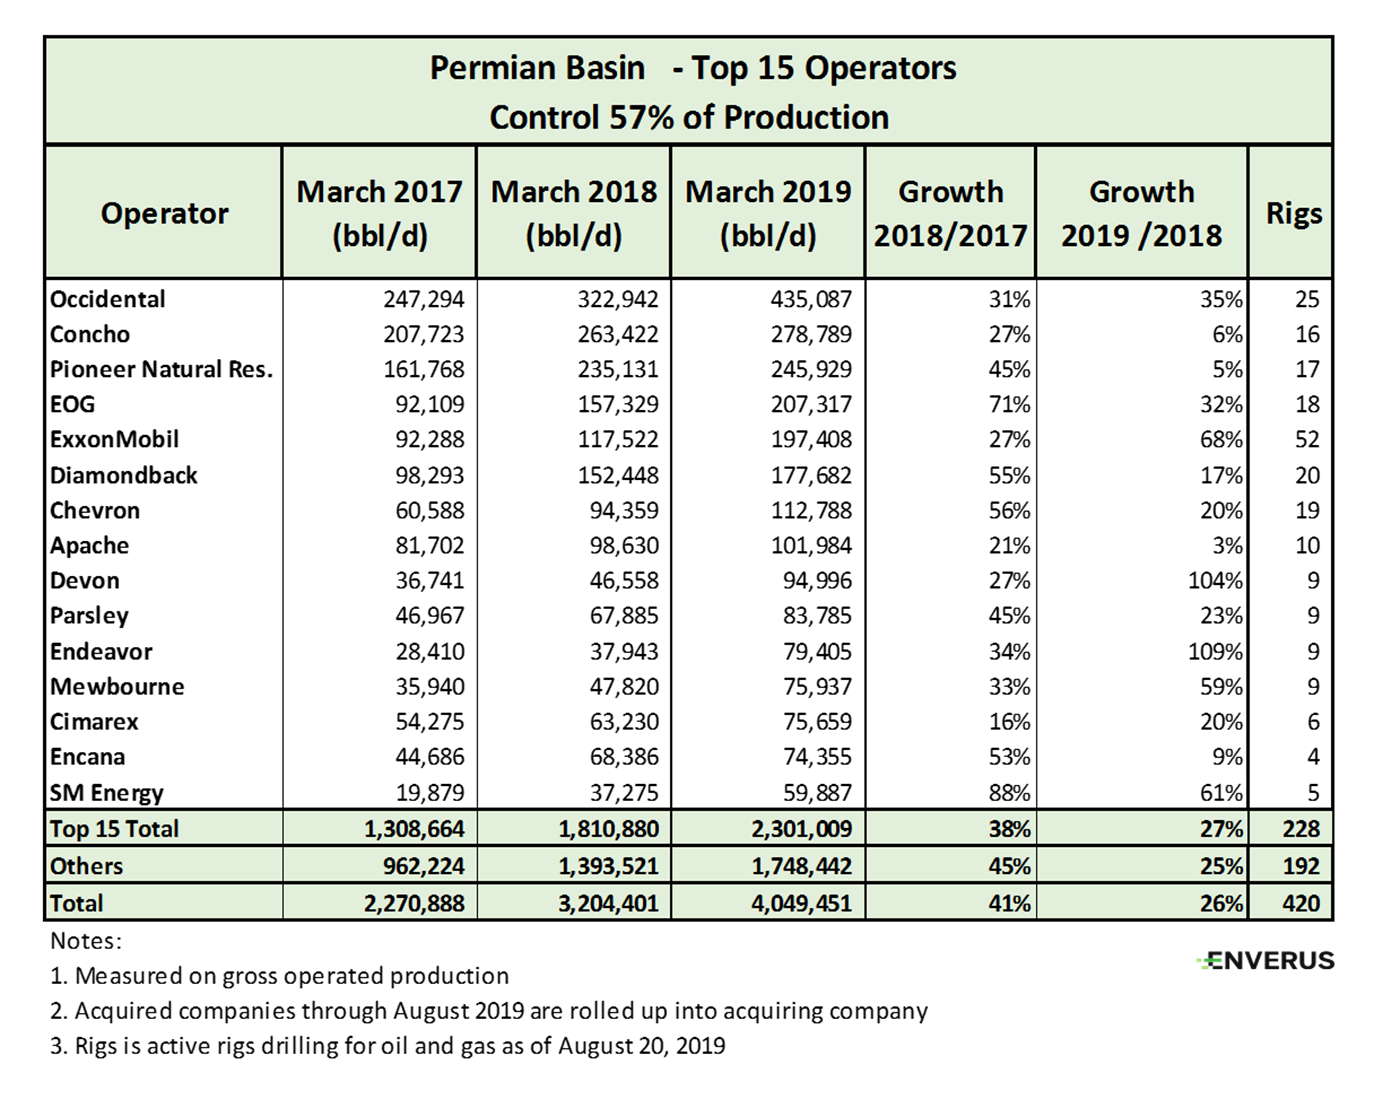
Figure 5 shows the top 15 producers in the Permian that collectively operate 57% of the oil production. Enverus Drillinginfo notes a long tail of smaller operators. Currently, there are more than 300 companies operating in the Permian that produce 100 bbl/d or more.
Noteworthy is that the share of the top 15 has remained consistent since 2017 at 57%. The collective growth rate for this group dropped from 38% in March 2017-2018 to 27% in March 2018-2019. Perhaps more striking is that over this two-year period, the top 15 grew production by a striking 76%.
Certainly, as companies get larger, they have performed admirably with growing production. Growing from a large base of production presents a complex set of business and operational issues. As time marches on, these large operators continue to find business process improvements that positively affect cost structure and consistency.
Permian climbing as the top US region to drill
As shown in Figure 5, the top 15 operators currently account for 57% of the Permian rig count, which stands at 420 active rigs drilling for oil and gas.
Figure 6 shows the pace of drilling in the Permian in relation to the rest of the U.S. Prior to the November 2014 oil price decline, Permian rig counts peaked at 508 rigs on Oct. 27, 2014—in sync with a U.S. rig count peak of 1,543 rigs. At the time, the Permian garnered 33% of the U.S. rig count. In the early days of the downcycle, Permian rigs slumped 75% to a low of 129 rigs on April 27, 2016, and on that date took just a 30% share of the U.S. rig count.
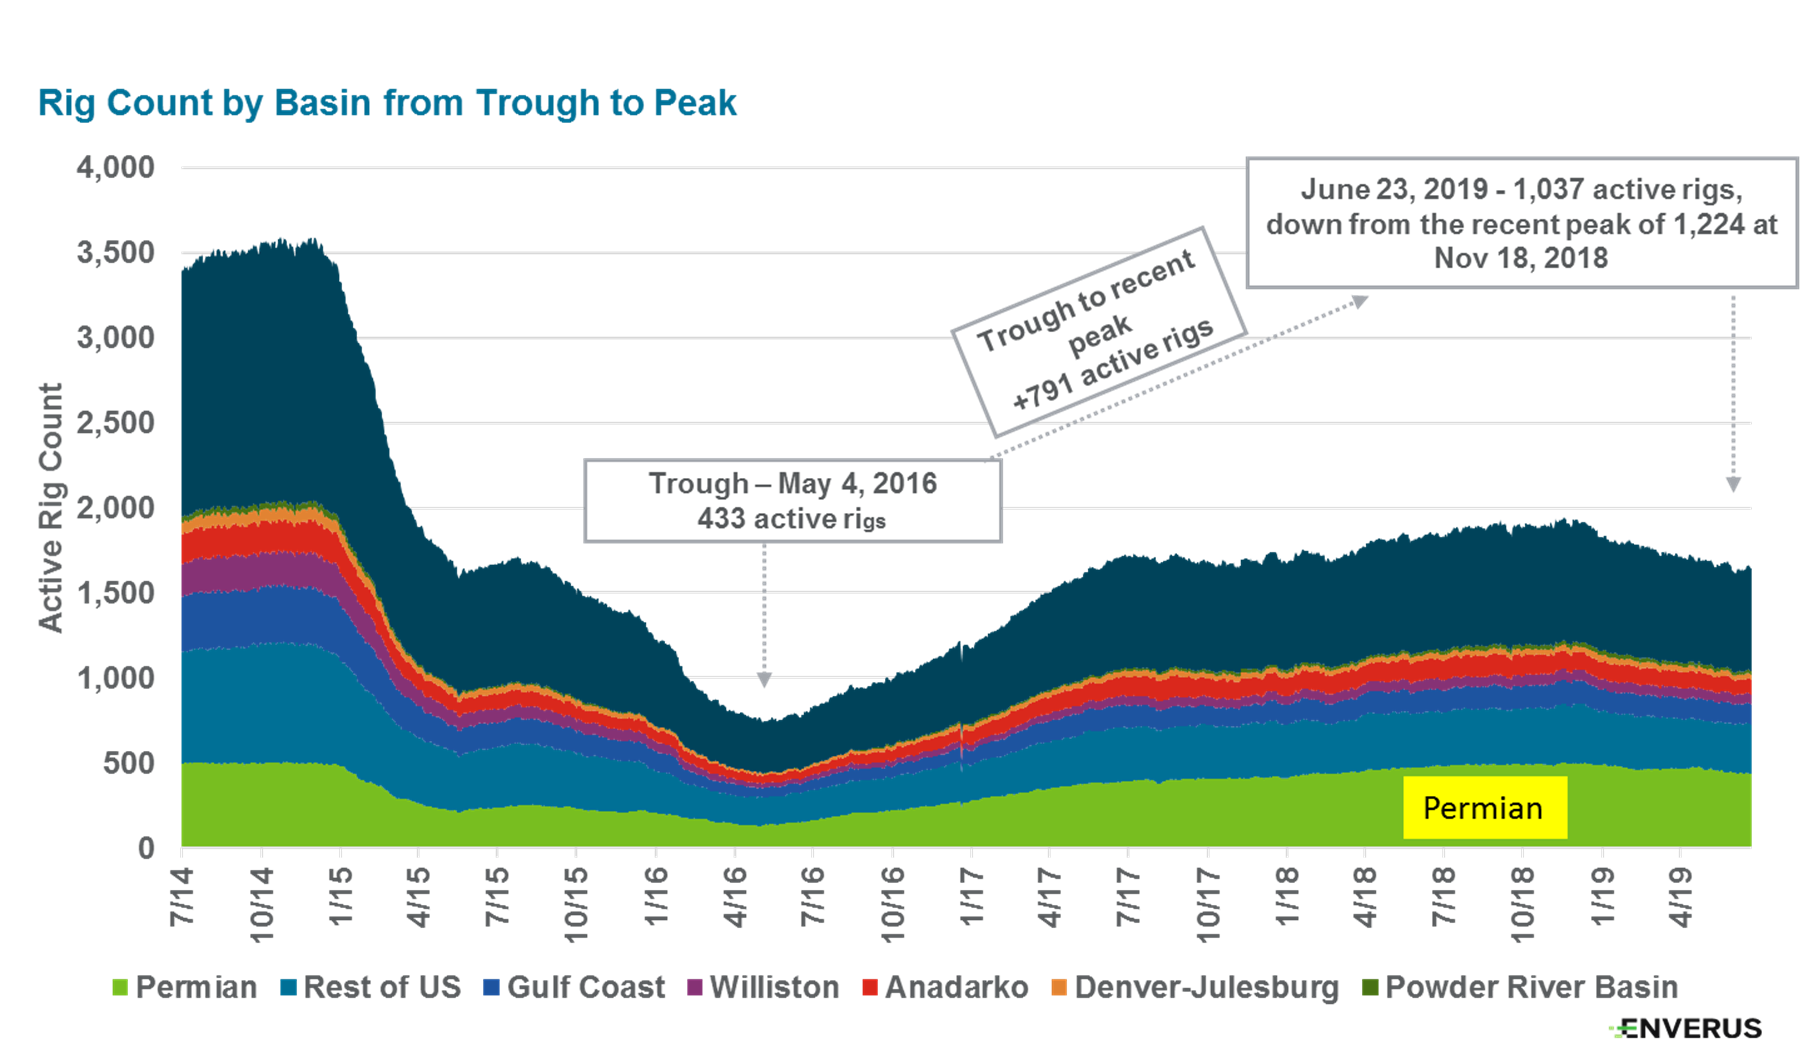
It is in this time frame that the Permian rebirth started in earnest, driven in large part by the opening of the Delaware Basin. From that trough in April 2016, the Permian rig count consistently rose by nearly 400% over 2.5 years to reach a recent peak of 505 on Nov. 16, 2018, at which time its share of the U.S. rig count rose to 42%. It is this trough to peak rig activity that spurred the record Permian production growth in 2018, which is continuing into 2019.
Recently since its peak of 505 in November 2018, Permian rig counts have declined by about 15%, which is setting up for a slower production growth rate in 2019 and beyond. The correlation between rig counts and production, while largely directionally consistent, are not directly correlated as operators are continuously innovating and moving toward drilling longer laterals and improving drill times. Regarding drill times, thus far in 2019, average spud to release is 19 days, an improvement from an average 21 days in 2014.
Permian oil takeaway forecast
As Permian oil production was rapidly ramping, midstream operators moved in quickly to begin building additional long-haul capacity directed to the Texas Gulf Coast export markets (Figure 7).
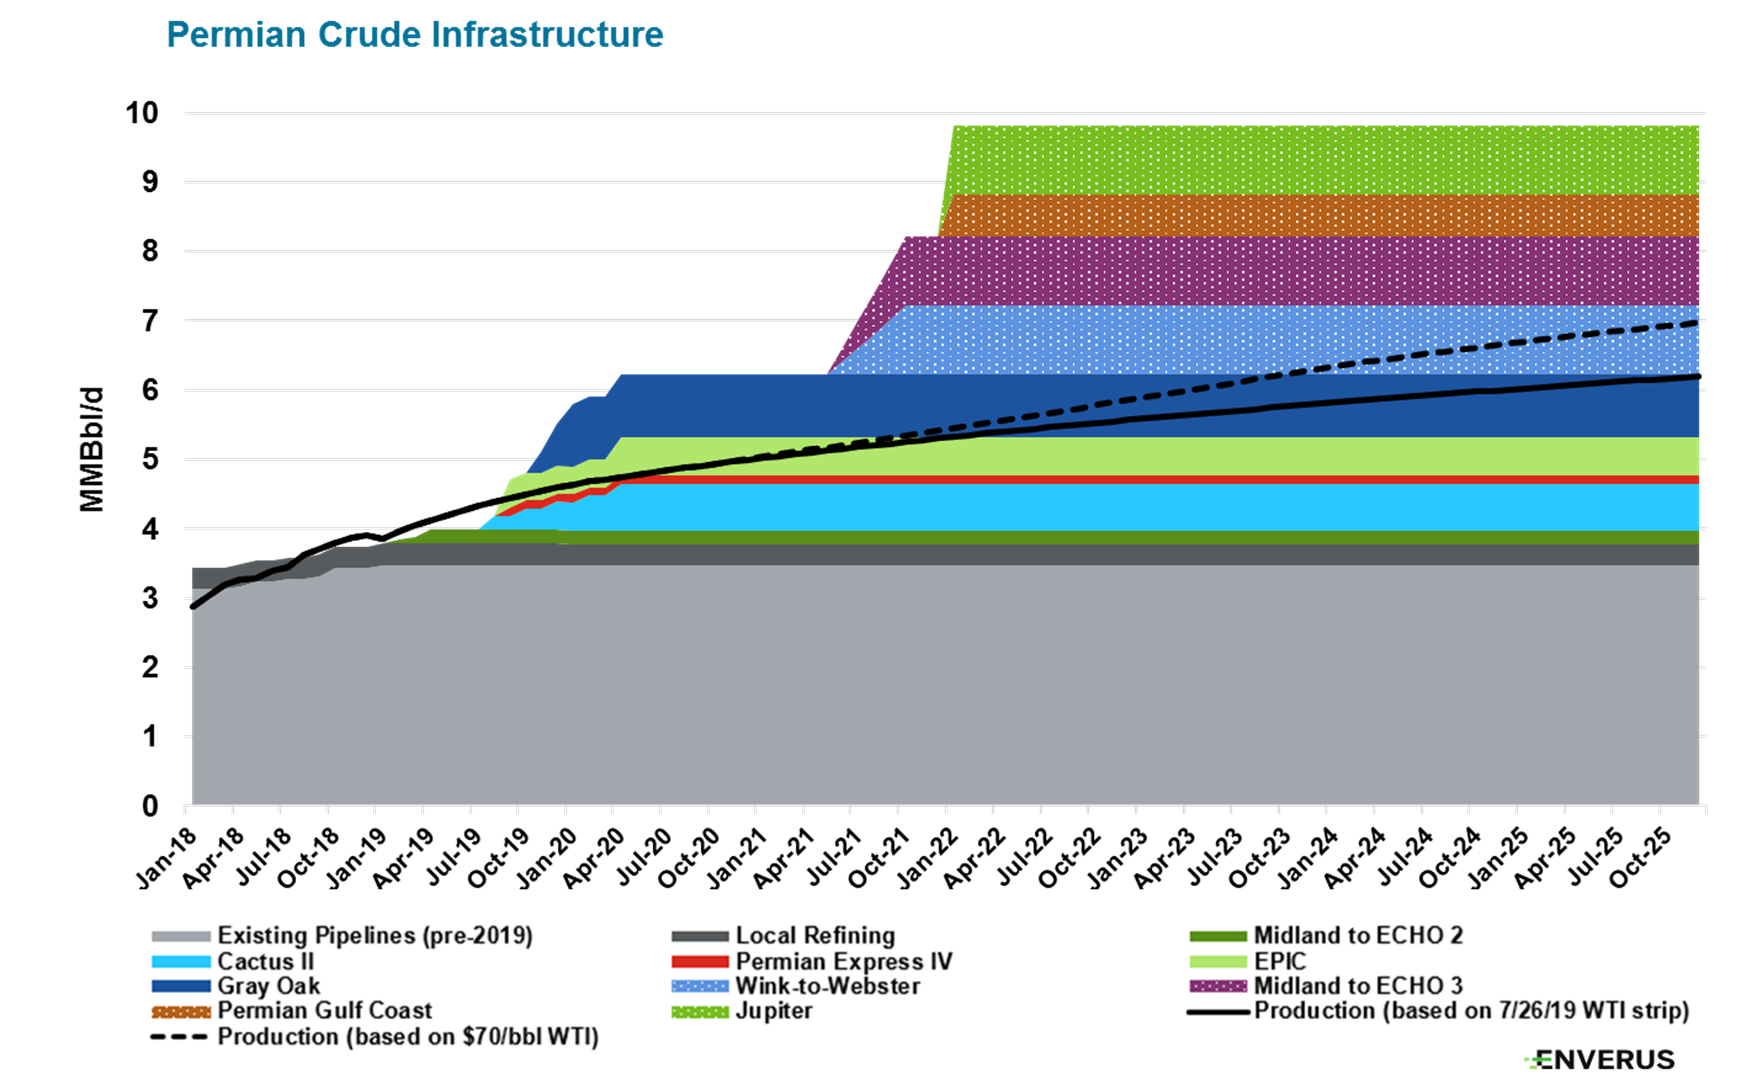
Capacity out of the Permian is expected to increase by 2.1 MMbbl/d this year. Plains All American’s Cactus II pipeline, originating in Wink, Texas, and terminating in Corpus Christi, Texas, with a 650,000-bbl/d design capacity, is complete and has begun commercial operations, with full service to Corpus Christi expected by the end of the first quarter of 2020.
The largest project, Phillips 66’s (44.2% ownership) Gray Oak pipeline, has a design capacity of 900,000 bbl/d and is expected to be in service by the end of 2019. The pipeline will serve multiple Texas Gulf Coast destinations, including Corpus Christi, where it will connect to the South Texas Gateway Terminal. This marine terminal is located at the mouth of Corpus Christi Bay and is under construction by Buckeye Partners. It will have two deepwater docks with initial storage capacity of about 7 MMbbl and up to 800,000 bbl/d of throughput capacity. In addition to the South Texas Terminal, Gray Oak also will service Phillip 66’s refinery in Sweeny, Texas, and the Houston markets.
Much of the increasing Permian crude is destined for the Texas Gulf Coast, where it is being exported to foreign markets. The importance of the export market for Permian crude cannot be overstated. Permian crude quality is from light to intermediate oil, and U.S. refineries are largely designed to process heavier crudes—a legacy issue from when the U.S. relied on imported crude for refinery input (Figure 8).
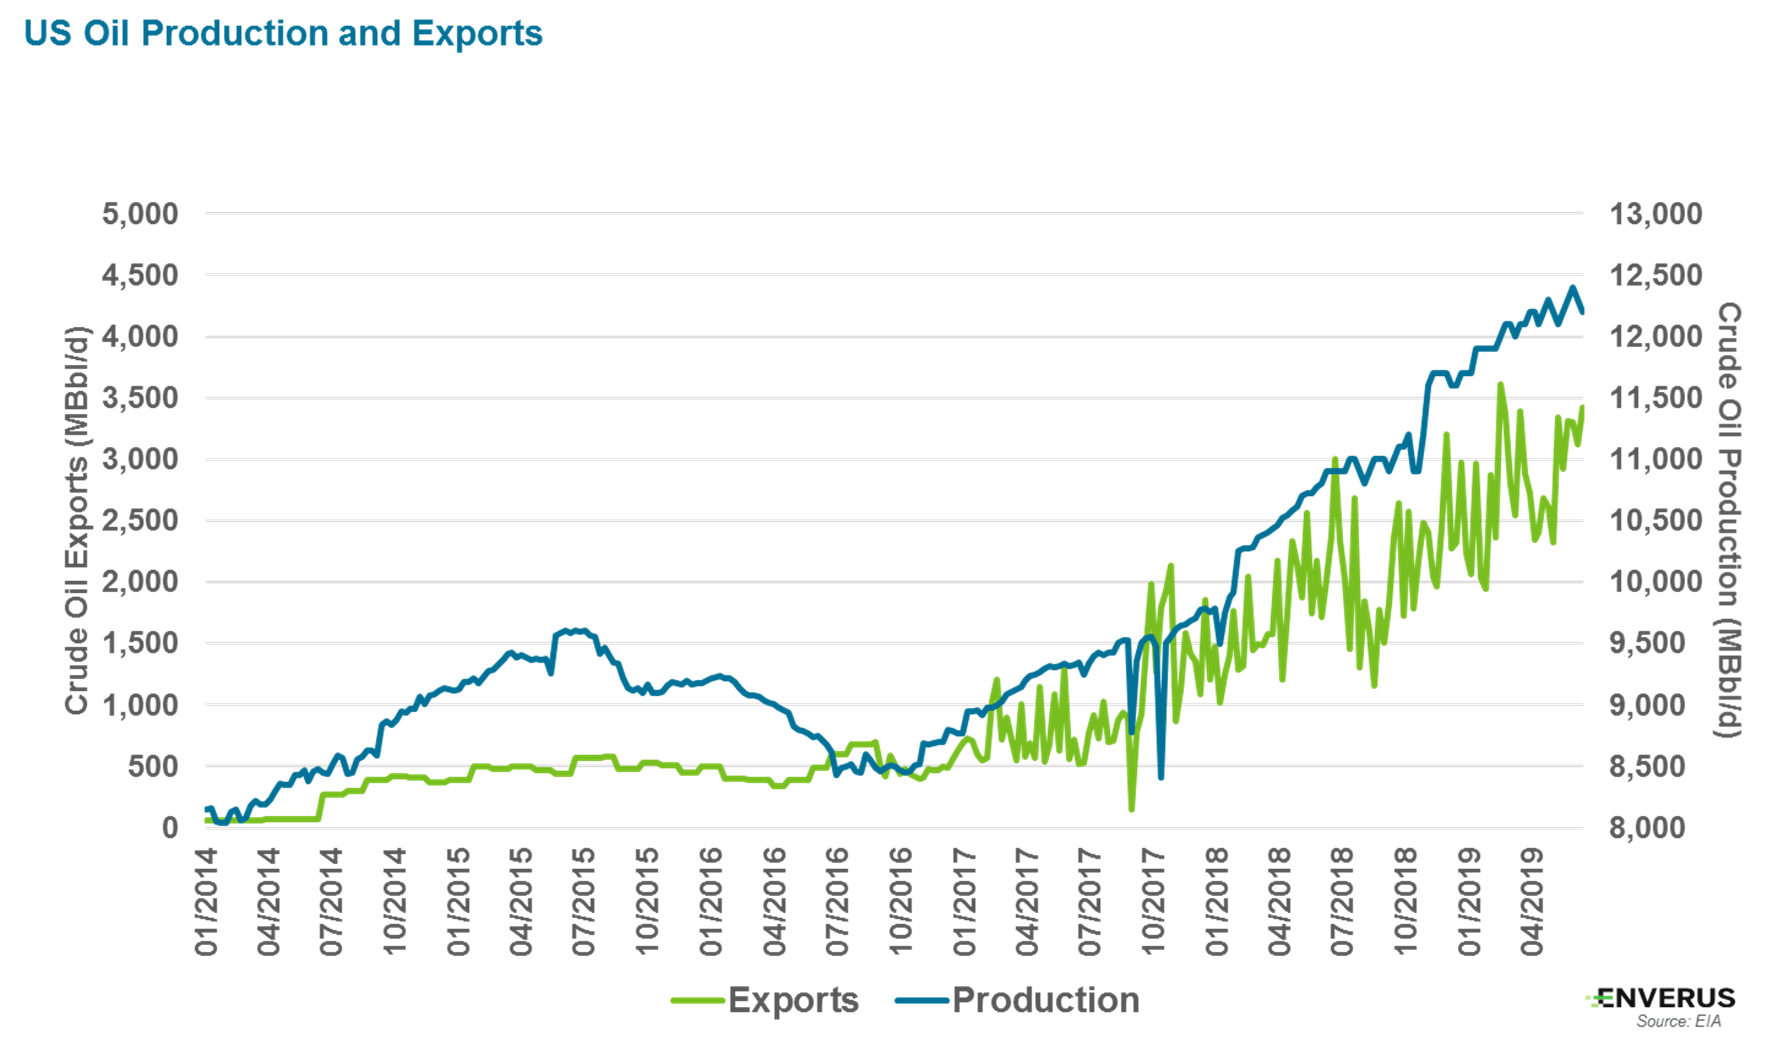
Until recently, China was the largest recipient of U.S. crude oil exports. Since July 2018, while U.S. exports continue to grow, China has decreased its U.S. crude imports substantially. The rest of the world has taken up the slack of China’s volumes with notable increases in both Korea and India.
Turning to Permian gas, associated gas production is rising rapidly as oil production ramps up. Current production of 10.5 Bcf/d exceeds the stated 8 Bcf/d of pipeline takeaway capacity (Figure 9).
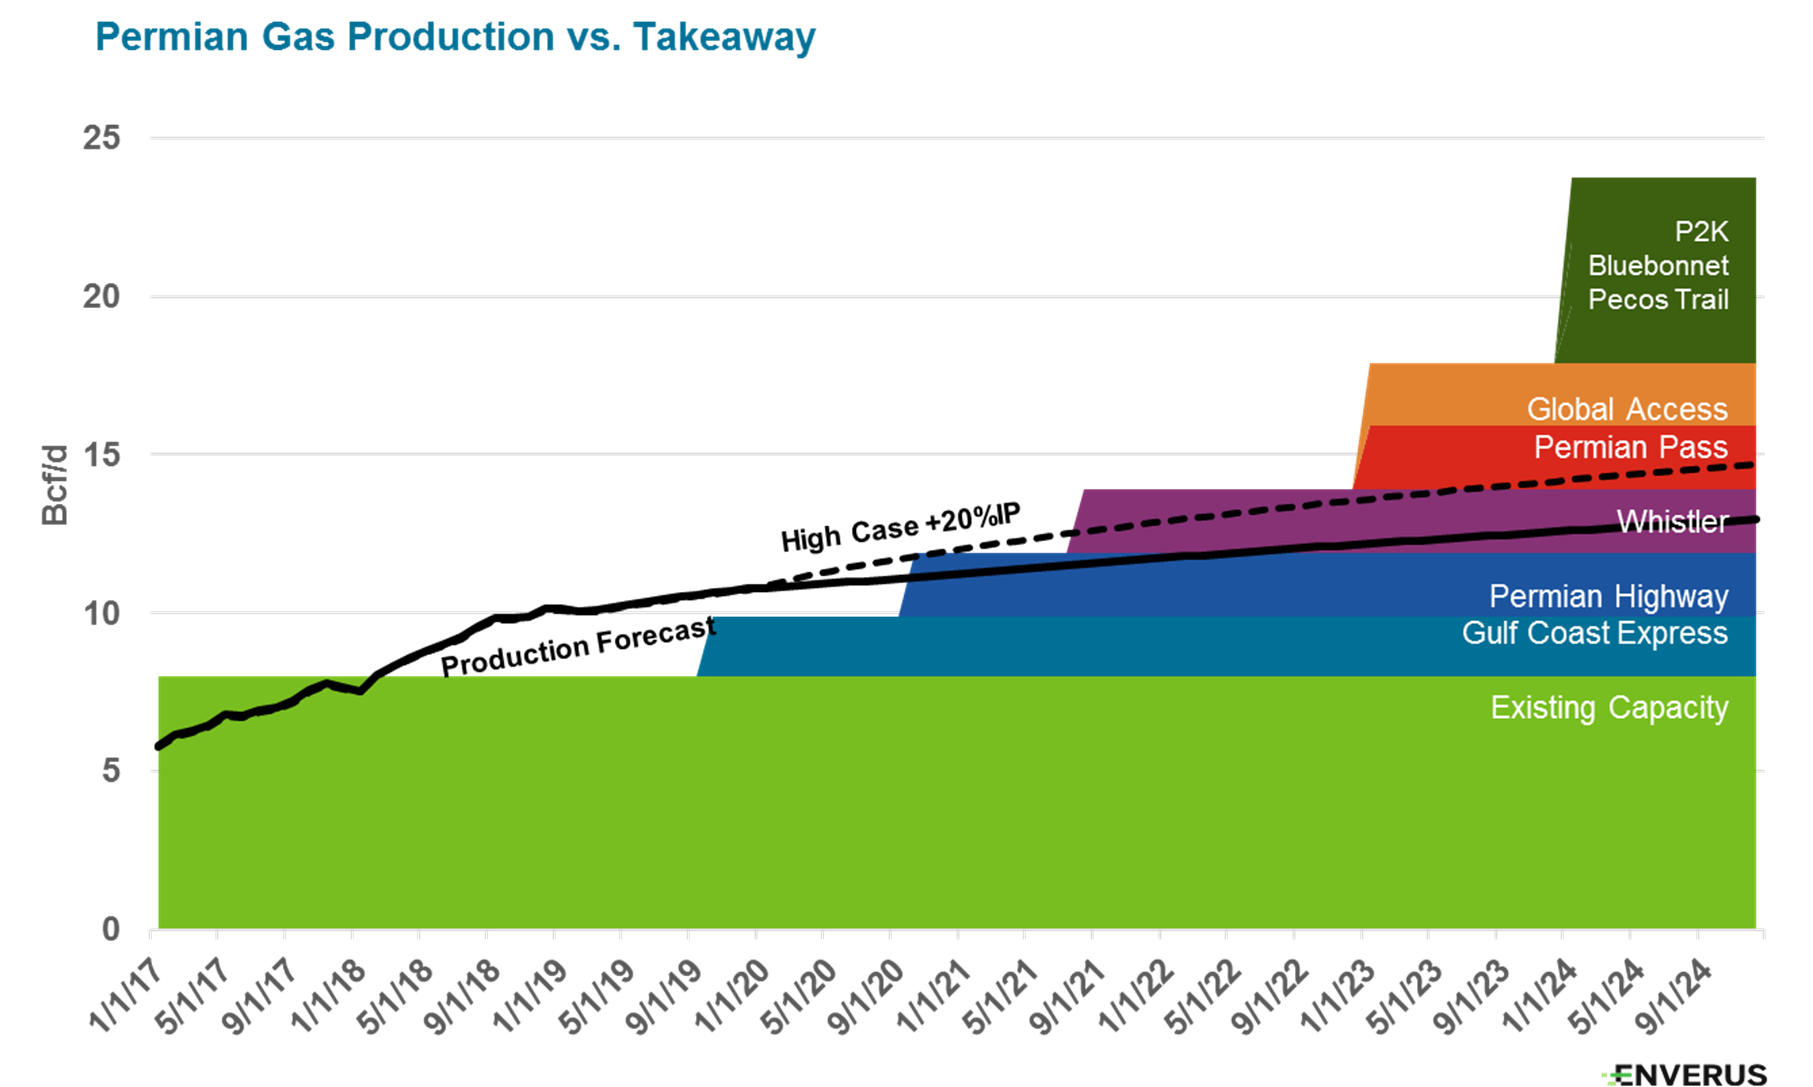
This bottleneck will be partially relieved with Kinder Morgan’s 1.9-Bcf/d Gulf Coast Express, which runs from the Waha Hub to the Agua Dulce Hub area in Texas’ southern Gulf Coast. Gulf Coast Express began line pack in mid-July 2019 and is expected to be in full service by September 2019. News of the line pack dramatically moved Waha cash gas prices from essentially $0.00 to about $1.20/MMBtu.
Beyond this relief, Kinder Morgan’s next major gas pipeline, the Permian Highway, is expected to bring another 2 Bcf/d of Permian gas takeaway beginning in October 2020, which will push Permian gas takeaway to 11.9 Bcf/d. This will result in a temporary excess capacity of about 0.8 Bcf/d assuming Enverus Drillinginfo’s base forecast.
Like oil, most of this new Permian gas takeaway capacity is headed toward Corpus Christi. The ultimate destination is largely for LNG export. In broader terms, growing LNG export capacity is the relief valve for increasing U.S. gas production. From a zero starting point beginning in early 2016, LNG stated capacity has now grown to 5 Bcf/d from four facilities: Sabine Pass, Louisiana (Cheniere), Cameron, Louisiana (consortium of Sempra, Mitsui, Mitsubishi, Total and NYK Line), Cove Point, Maryland (Dominion Energy) and the latest in Corpus Christi (Cheniere).
Role of M&A in the Permian and the case for consolidation
Since 2015, the Permian has by far been the most active area in the U.S. for M&A activity and accounts for $98 billion of the $340 billion U.S. upstream M&A market. The $98 billion figure does exclude large transactions that cross multiple plays, such as Occidental’s recent $57 billion purchase of Anadarko Petroleum, the largest deal of this time frame. Also excluded is BP’s $10.5 billion buy of BHP’s U.S. shale portfolio in July 2018.
Remarkably, of the $98 billion spent for deals in the Permian since 2015, 70% of those dollars, or $69 billion, was allocated to the purchase of land. Breaking down the $69 billion spent on land inventory even further, $41 billion of that figure was spent in the Delaware Basin, $26 billion in the Midland Basin and the remaining $2 billion spread across both areas.
Figures 10a and 10b show some of the recent $300 million-plus deals in each of the Delaware and Midland basins since 2017. The background green shapes are each basin’s tiered acreage rated from high to low based on Enverus’ analysis of well-level economics.
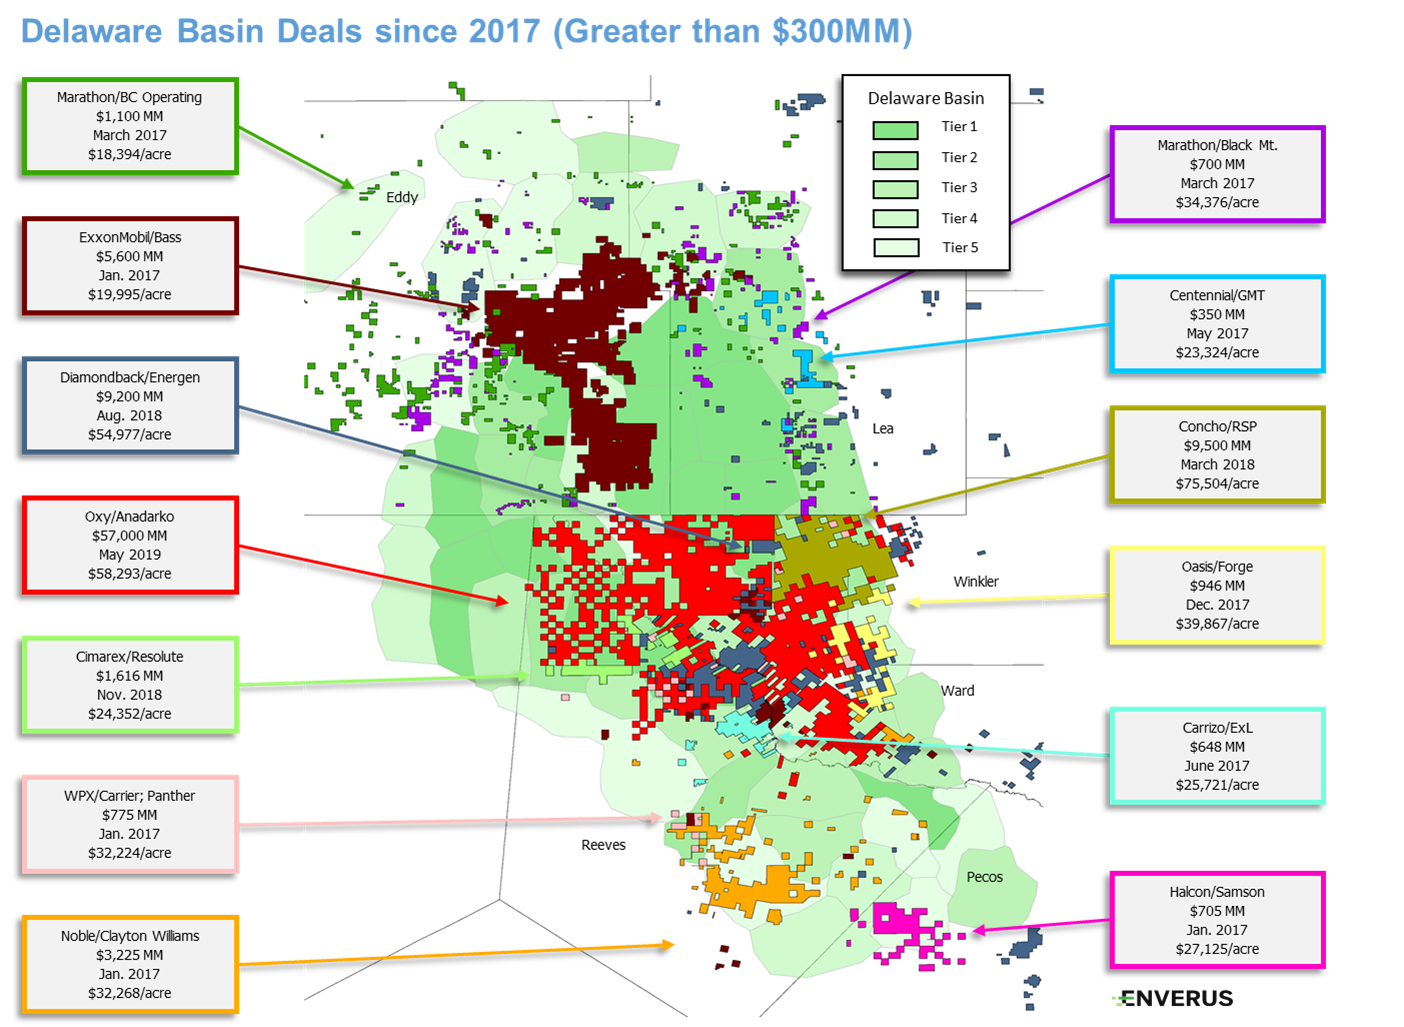
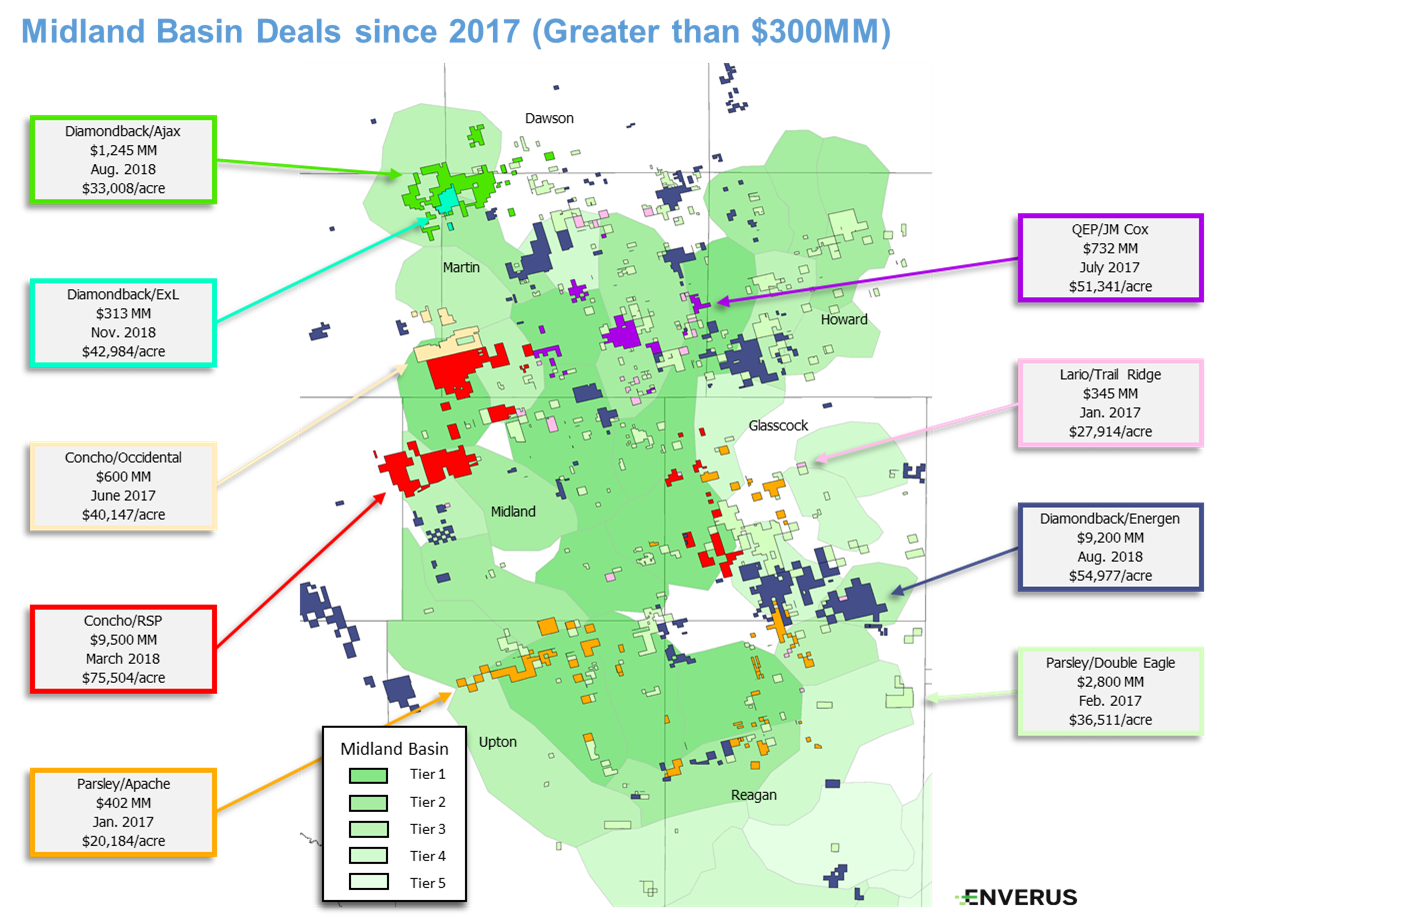
The money spent for inventory in the Delaware Basin opened the area to reach new heights. The biggest bet to date in the Delaware Basin stems from the recent battle between Occidental and Chevron for Anadarko Petroleum. This $57 billion win by Occidental solidified its production leadership position in the Permian and, according to Enverus Drillinginfo’s analysis, $14 billion of that number was paid for the Delaware Basin acreage position. The next two largest bets placed were Diamondback’s $9.2 billion buy of Energen (August 2018, $5.7 billion for land) and Exxon Mobil’s $5.6 billion buy of Yates Petroleum (November 2017, $5 billion for land).
On the Midland side of the Permian, the two largest bets were Concho Resources’ $9.5 billion buy of RSP Permian (March 2018, $7 billion for land) and Parsley Energy’s $2.8 billion buy of Double Eagle Petroleum (February 2017, $2.6 billion for land).
Chevron’s desire to expand in the Permian had its limits, as seen in its withdrawal from the Anadarko Petroleum battle, but it certainly signaled the allure of the Permian to major oil companies that for the most part have yet to make transformational moves. Certainly, BP’s entry into the Permian, Eagle Ford and Haynesville with its $10.5 billion buy of BHP’s legacy U.S. resource portfolio and Exxon Mobil’s $5.6 billion buy of Yates Petroleum were significant. But there is no doubt that the major oil companies have additional firepower and desire to expand their Permian presence.
The fact that, as shown earlier in this article, Exxon Mobil is by far the leading driller in the Permian with 52 rigs running and a 68% production growth rate between March 2018 and March 2019 speaks volumes as to major oil companies’ sights for the future. There is a strong likelihood that this theme applies to most of the other majors, certainly Chevron.
The Permian is primed for consolidation as the size of the prize is large. As the industry has demonstrated, there are many variables to achieving top-tier economic results in the Permian. Owning the best portions of the rocks ranks highest. Operational scale and consistency also matter. Blocking up acreage to drill 10,000-ft or longer laterals matters.
Majors rank among the top candidates to become consolidators in today’s markets, particularly given the growing valuation disconnect between their equity and public independent E&P names, not to mention the size of the balance sheet. In addition to public independents, there are also some large private operators that have always been attractive acquisition targets.
Innovation marching ahead
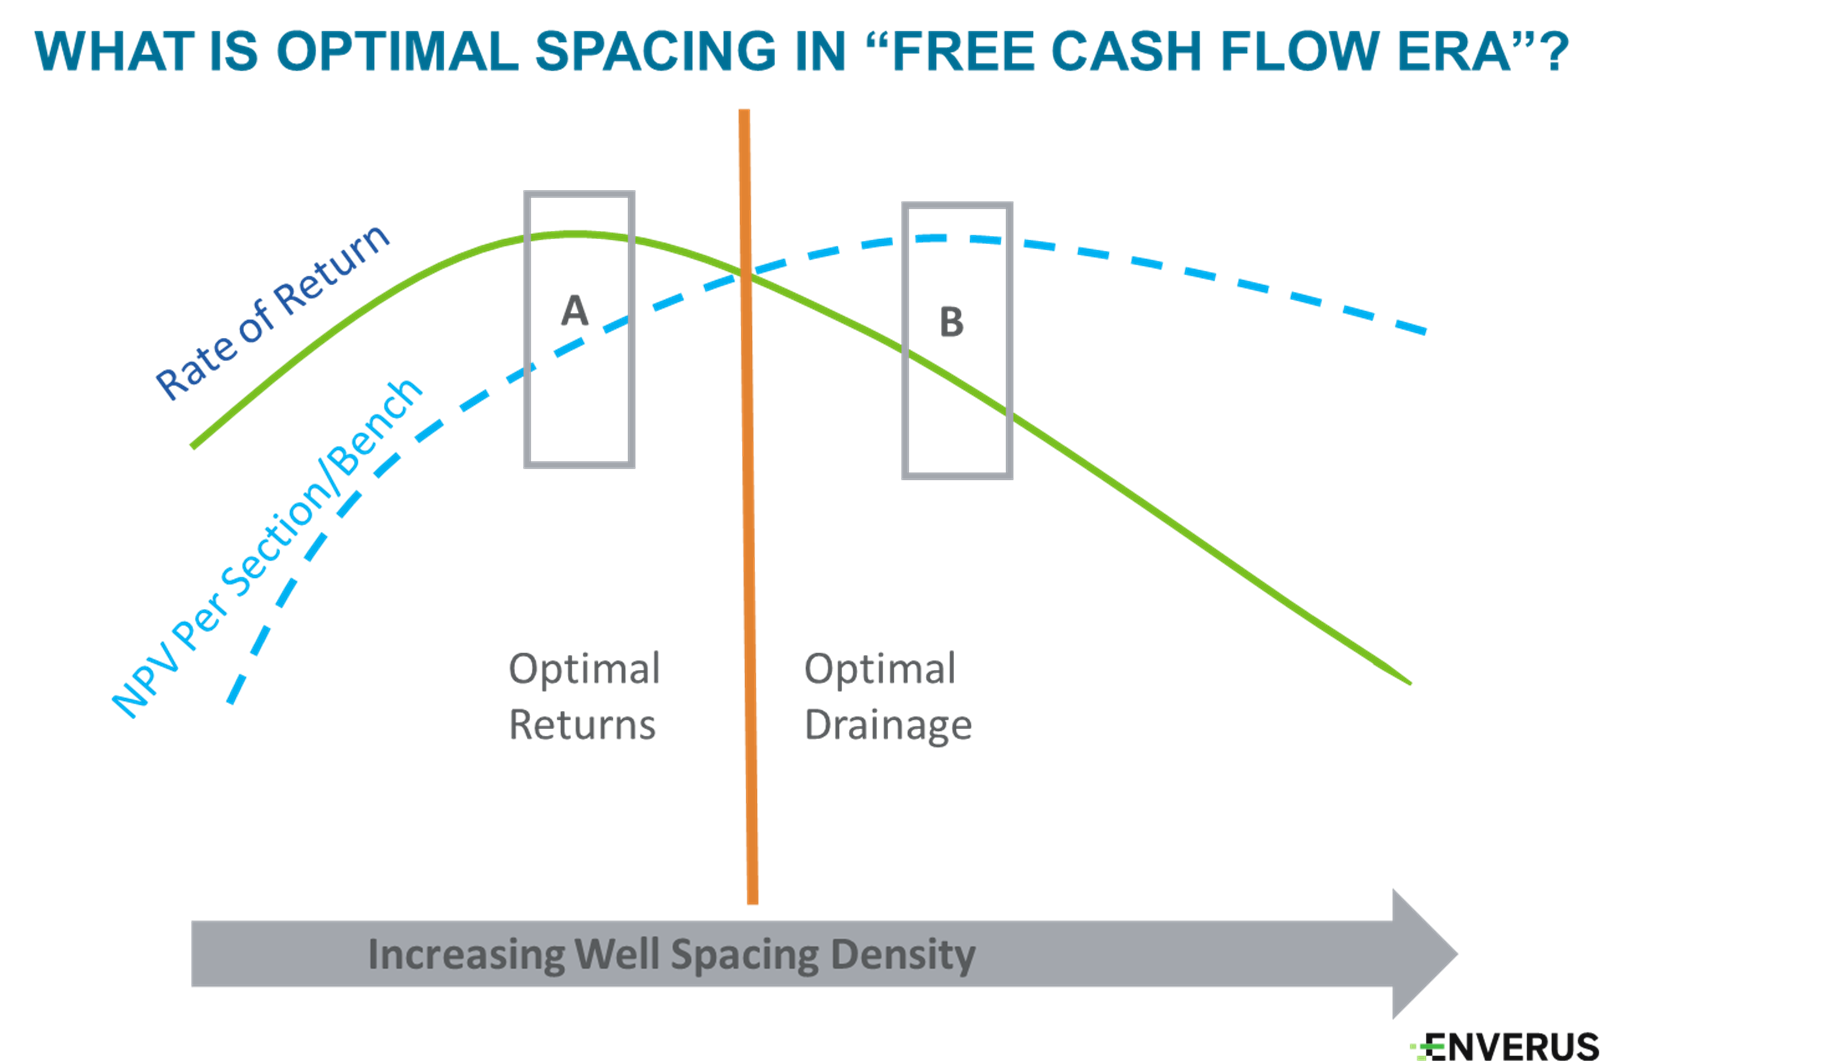
Much is being written today regarding finding optimal spacing within the Permian. As operators are now being graded on profitability (aka “achieving sustainable free cash flow”) versus value growth, the game has changed. Historically, public company operators built their companies with the goal of increasing the NPV of their assets and this, by its nature, drove growth and reinvestment into high return wells. This paradigm shift of the “scorecard” is changing company behavior and will impact development within the Permian.
As an example, Midland Basin leader Pioneer Natural Resources was on a mission to achieve 1 MMboe/d of production by 2026 via reinvestment into the company. Now Pioneer has pivoted to returning cash to shareholders in a meaningful manner while downshifting growth to the mid-teens.
The investment decision for optimal well-level returns versus optimal drainage of the reservoir impacts well-spacing decisions and is depicted in Figure 11.
Collectively as an industry, E&P operators are innovators. Perhaps more than anywhere else, those in the Permian Basin have proven this by virtue of the great advances made after the November 2014 oil price crash. Instead of retreating, the industry innovated.
There are many examples of well-level economics that are higher today at $55 or $60/bbl oil then when oil prices were north of $90/bbl. These advances in cost efficiencies and reservoir optimization speak volumes to the ultimate potential of the Permian Basin. And there is more to come.
In early August, when posed a question by an analyst if there were more efficiencies in drilling and completion costs to be had in the Permian, Diamondback CEO Travis Stice answered with a baseball analogy: The Midland Basin is “getting into inning six” while the Delaware Basin is in “inning three or four.” We are still learning.
But innovation and improvements require calculated risk taking. Only from trial and error, can the industry advance the ball for the benefit of all operators.
Recently, Concho Resources’ stock price got knocked down severely due to less than expected results from its Dominator spacing test project in Lea County, N.M., as the company pushed the envelope in search of optimal spacing. Located in an ideal area for the development test, operationally the company performed superbly. The project required the simultaneously use of seven rigs to drill 23 wells in some of the densest spacing the company has undertaken. The results indicated that the spacing was too tight.
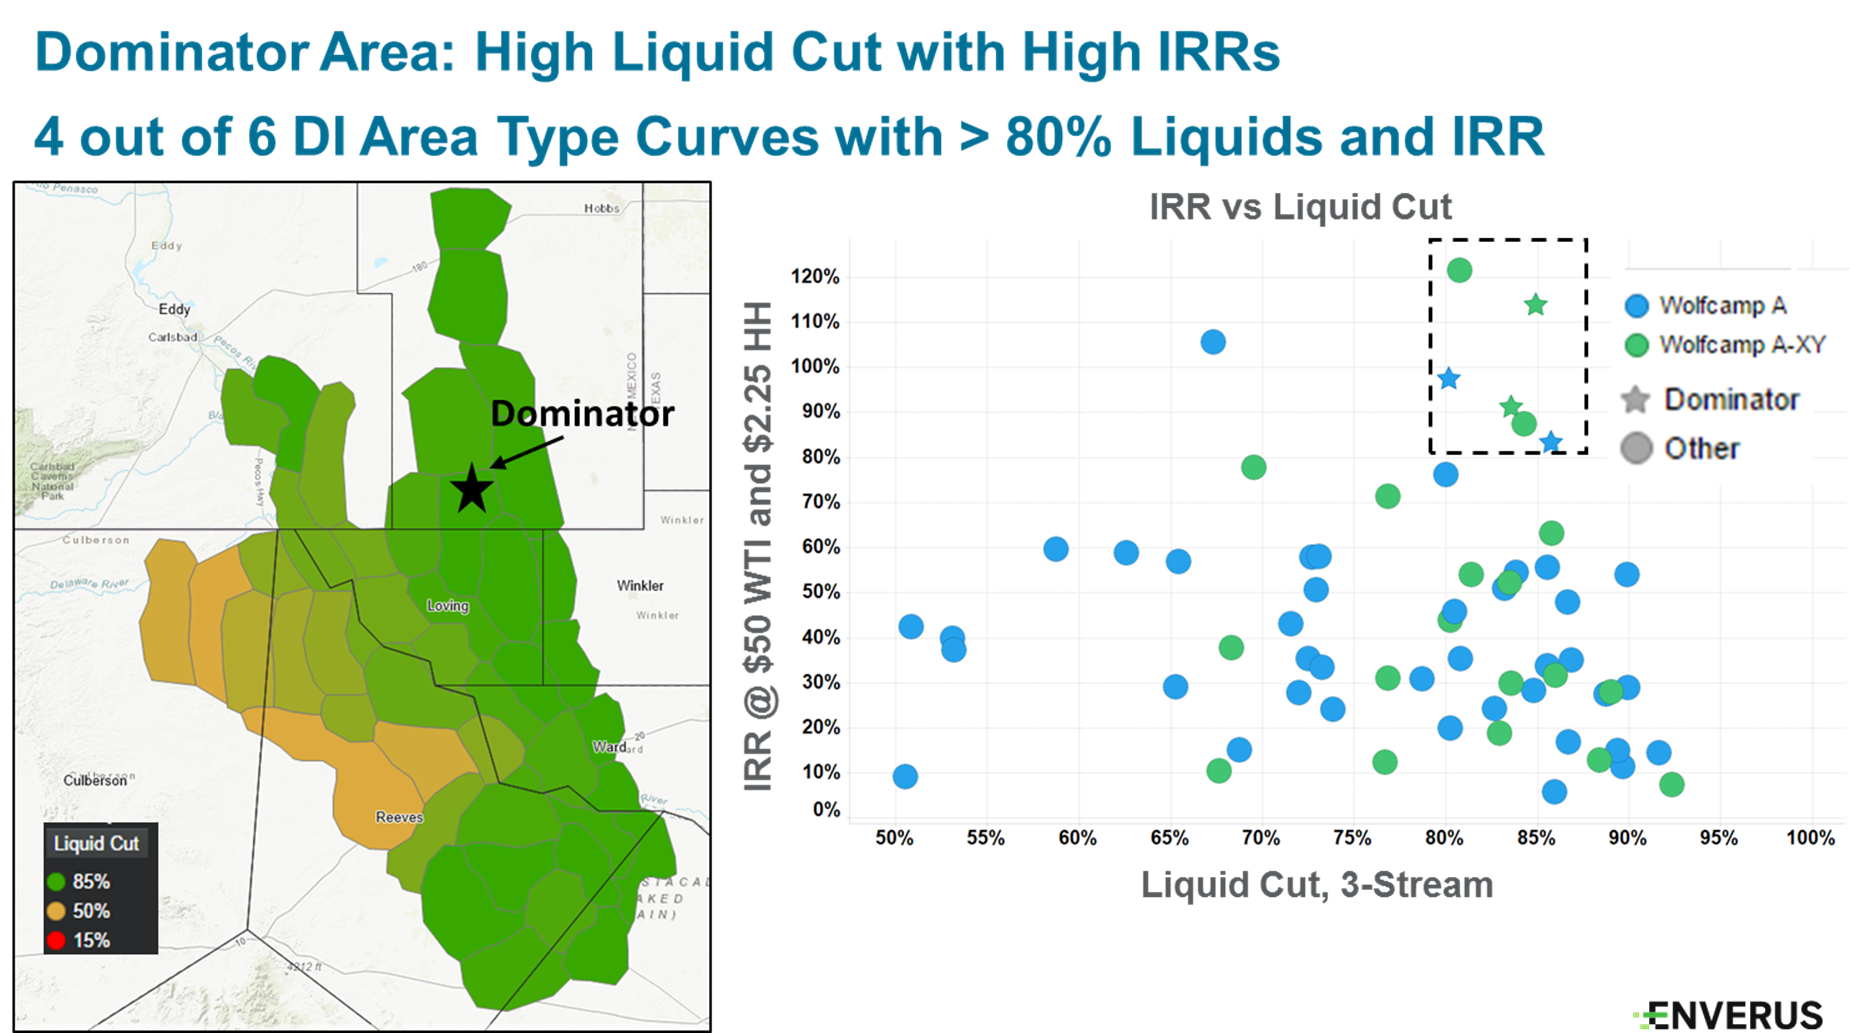
To dive a bit deeper, Concho’s Dominator project in the Wolfcamp A bench in Lea County had a combined average well spacing of 230 ft versus a Lea County average of 600 ft (Figure 12). The location for this project is a top-performing area with greater than 80% IRRs based on type-curve economics at $50 oil (Figure 13). Furthermore, Concho had past success downspacing in Lea County.
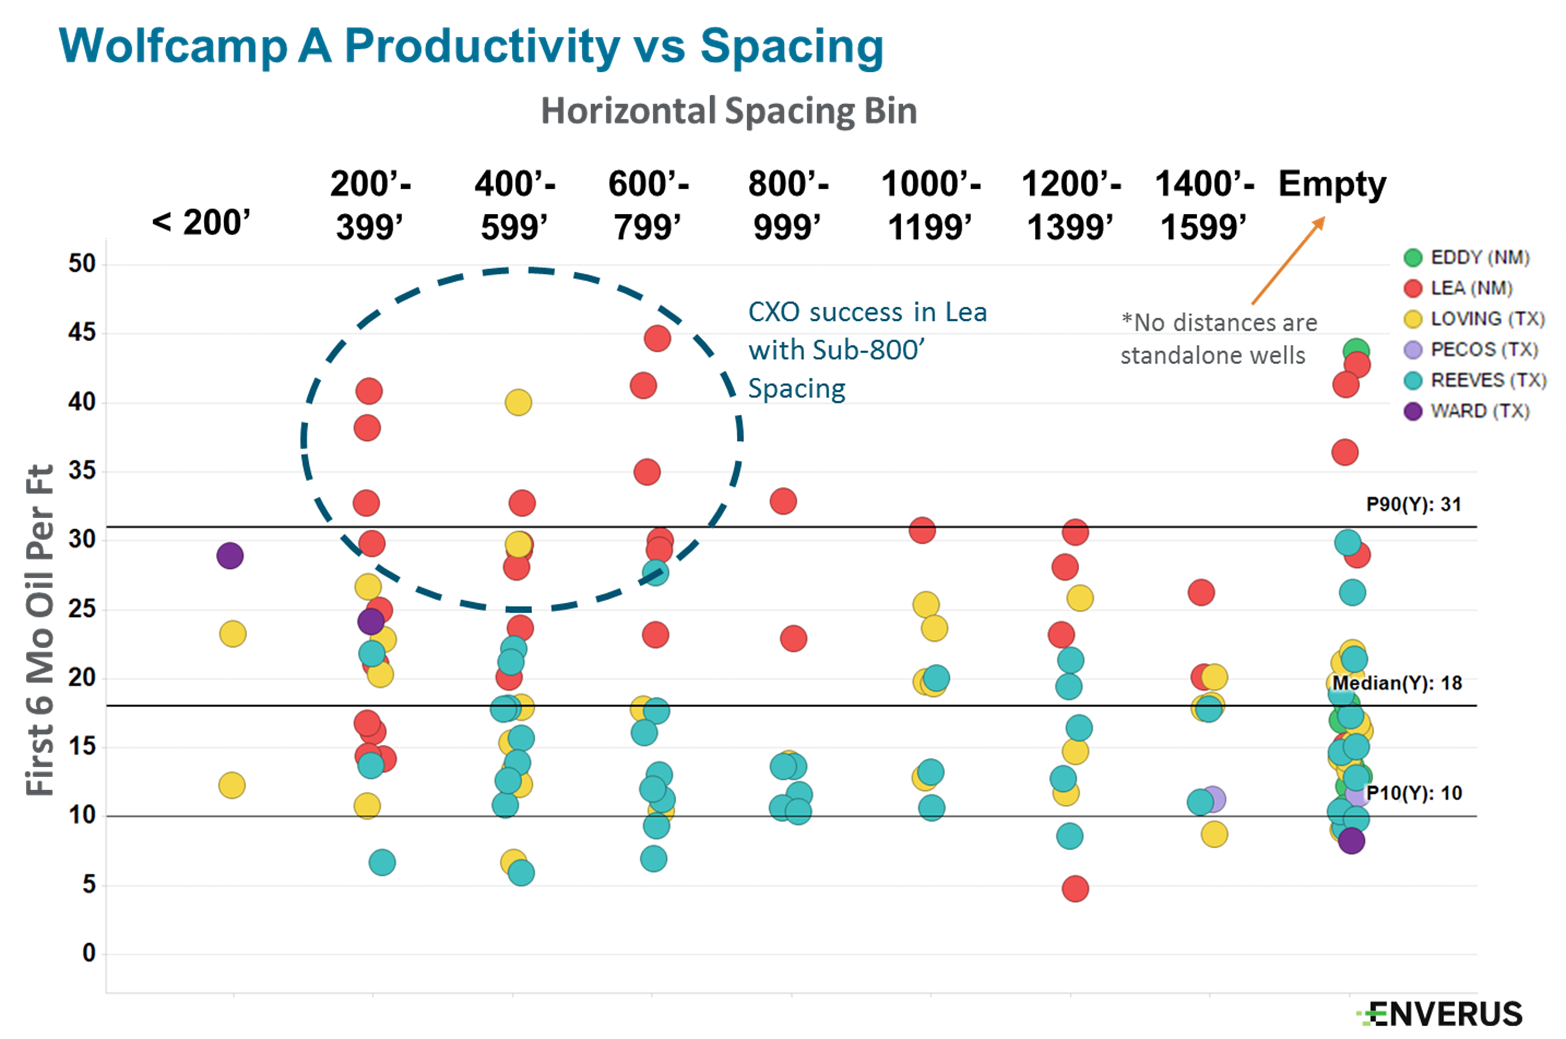
Southwest of Dominator, Concho had previously brought on a successful nine-well program drilled in 2018 on 545-ft horizontal spacing. Direct offset operators on the Dominator location had also further downspaced. So Dominator was a calculated test to logically push the limits of increased well density.
Despite the hit on Concho’s stock price, operators should be encouraged to continue to test the boundaries of optimal spacing. It is only through these tests that Permian operators collectively can optimize the reservoirs and maximize profits for company owners.
It is just this kind of prudent risk-taking that advances the ball for all within the Permian. Concho will be a better company for the learnings from Dominator. While Wall Street investors may react, sometimes overreact, there remains little doubt that efficiencies in the Permian continue to improve and the economics will reflect these gains.
Conclusion
The forecast for the Permian is brighter than ever. From a supply point of view, the basin will lead all other areas in the U.S. in production growth in the short, mid and long term. Enverus Drillinginfo forecasts Permian oil production growth to slow a bit in 2019 to an average 12.3 MMbbl/d with growth continuing but at a slower pace thereafter. Enverus Drillinginfo forecasts Permian oil production to reach 15.5 MMbbl/d by 2023 and 17.9 MMbbl/d by 2029. For gas, the Permian will match the Northeast for production growth, with each adding 2.2 Bcf/d in the next five years. Long-haul takeaway capacity for Permian gas remains at a shortage with this not being resolved until late 2020.
Underpinning the strong outlook for the Permian is a large swath of land that has proven half-cycle well-level economics profitable at prices well below $50 WTI.
Enverus Drillinginfo expects this bright outlook for the Permian to attract the world’s largest companies to expand their positions. Certainly Chevron’s recent bid for Anadarko Petroleum is a strong signal. Exxon Mobil is the largest driller in the basin. BP recently entered the Permian via its BHP buy. The case for consolidation remains strong underpinnned by the strong economic benefits of scale and control of blocky acreage for long laterals. These factors favor major oil and super independents to be the consolidators.
Innovation in the Permian has and will continue to thrive. The industry is testing the limits on well spacing and the learnings will lead to more accurate assessment of inventory and the timing and magnitude of investment decisions.
The recent pivot of operators to a free cash flow model will impact the pace of Permian growth as companies look to distribute cash back to shareholders as opposed to reinvesting in high rate of return projects.
On the global stage, growing Permian production is of paramount importance when evaluating supply and demand and developing an oil price outlook. The bright Permian outlook is a large factor that drives the current longer term price forecast of $55 WTI, with shocks significantly above or below this likely to prove transitory.
(All charts are courtesy of Enverus Drillinginfo)
Check out the other "2019 Permian Playbook" chapters that appeared in the October issue of E&P magazine:
OVERVIEW:
Produced Water, Well Interference Challenge Growth in the Permian Basin
KEY PLAYERS:
Permian Operators Delivering Strong Production
TECHNOLOGY:
New Technology Primed and Prepped For Permian Challenge
MIDSTREAM:
Long-Haul Capacity from the Permian Close to Pulling Even with Production
Changing Paradigm of the Permian
PRODUCTION FORECAST:
Permian Poised to Deliver Strong Oil and Gas Production Growth
CASE STUDIES:
Producing Unconventional Wells without Electricity
Recommended Reading
US Drillers Cut Oil, Gas Rigs for Third Week in a Row, Baker Hughes Says
2024-08-30 - The rig count is 8% below this time last year, according to Baker Hughes.
Helix Awarded Vessel Service, Charter Contracts Off Brazil
2024-08-28 - Helix Energy Solutions Group was awarded new three-year charter and service contracts, valued at an estimated $786 million, from Petrobras for Siem Helix 1 and Siem Helix 2.
Shell, Akselos Enter Enterprise Deal for Structural Performance Management
2024-08-28 - Shell Information Technology International will leverage Akselos’ structural performance management software to monitor the health and lifecycle of Shell’s critical assets in Qatar, Canada, the Gulf of Mexico and elsewhere.
From Exxon to APA, E&Ps Feel Need to Scratch Exploration Itch
2024-08-27 - Exxon Mobil is looking for its “next Permian,” which an executive said could be in Algeria.
E&P Highlights: Aug. 26, 2024
2024-08-26 - Here’s a roundup of the latest E&P headlines, with Ovintiv considering selling its Uinta assets and drilling operations beginning at the Anchois project offshore Morocco.


