
Devon Energy Corp. produces about 140,000 bbl/d of oil and about 575 MMcf/d from its U.S. shale resources, according to its website. (Source: Devon Energy Corp.)
Editor's note: This is an extended version of the Enverus article that originally appeared in the December issue of E&P magazine. Subscribe to the magazine here.
As 2019 draws to a close, Enverus Energy looks at the current state of play in the U.S. oil and gas market and looks forward to 2020 and beyond. Trends in type curve results, permitting, rig counts, engineering, top operators, midstream buildout, and mergers and acquisitions activity are explored. In addition, topical discussions on well spacing, which has become a focal point for many operators, are presented. Overall, Enverus does expect production to continue to grow, albeit at a less furious rate compared to the past few years. This is driven by the evidence suggesting there is still acreage in all major basins that provide economic returns in the neighborhood of $50 WTI and above. Move below $50, and the effort becomes much more challenging; however, the Permian Basin will still present feasible opportunities.
Of course, no evaluation would be complete without discussing the influence of Wall Street and the capital it provides. After supporting E&P operators spending vast sums to buy land inventory after the downturn, Wall Street has shifted its expectations for the industry. The call now is for an approach predicated on demonstrating sustainable free cash flow for return to shareholders. This paradigm shift from Wall Street has been abrupt, and E&P leadership has responded. Less capital will be put into the ground, and growth rates are slowing, but supply dynamics remain strong, especially in the Permian Basin. Sentiment has been negative, causing the oil and gas industry to underperform other sectors, but cash is being returned to shareholders. At some point, Wall Street sentiment will shift to acknowledge these tangible results.
Upstream metrics and engineering
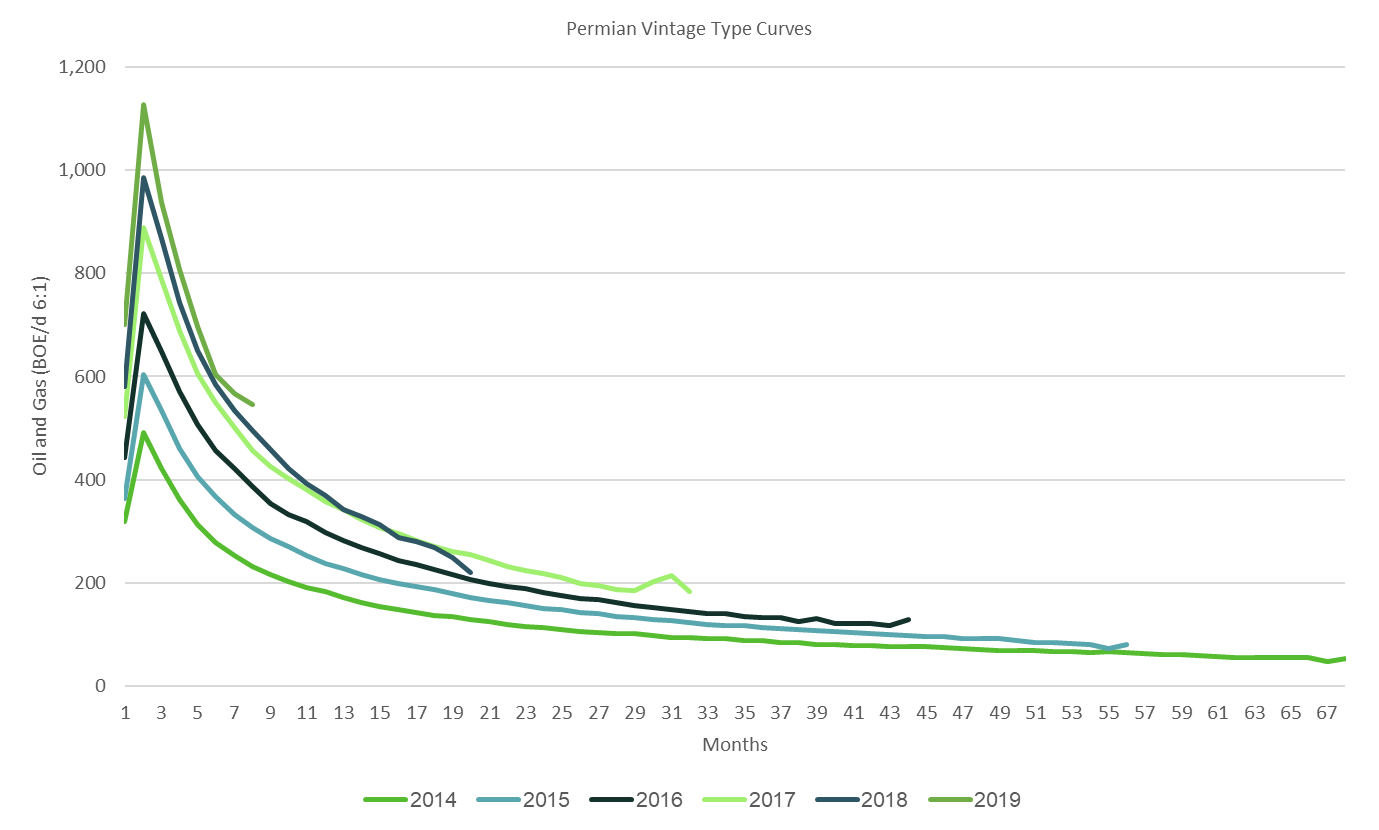
Over the past several years, methods of increasing efficiencies, including longer laterals, have led to improvements in type curve results across most basins. For example, in the Permian Basin, efficiencies have been increasing at a minimum of 10% year over year since 2014 (Figure 1).
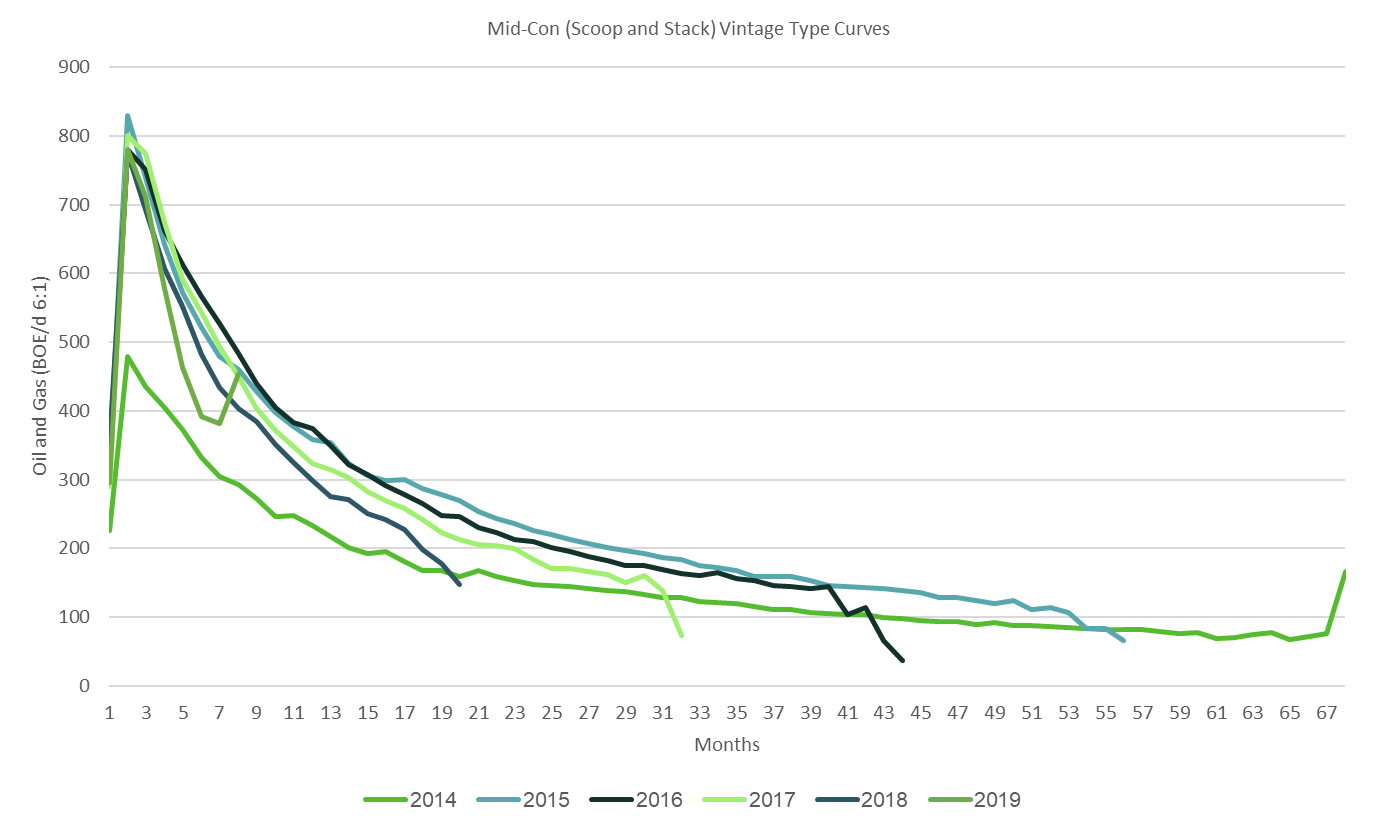
Alternatively, in the Midcontinent (particularly noticeable in the Scoop/Stack), type curves have been stagnant since 2015-2016 (Figure 2). While larger fracs also have been utilized in these two plays, potential reasons for stagnant results here include the transition from drilling single-well to multiwell pads, expanding out of the core due to well-spacing issues and degradation due to parent/child well relationships during aggressive downspacing programs.
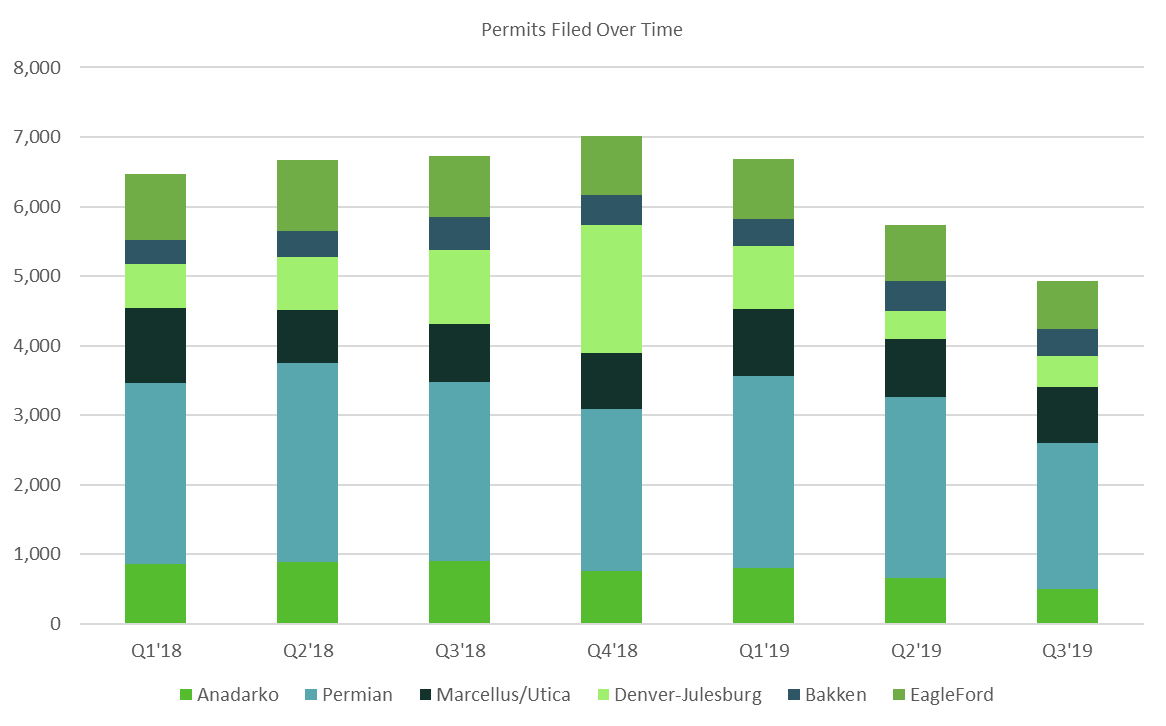
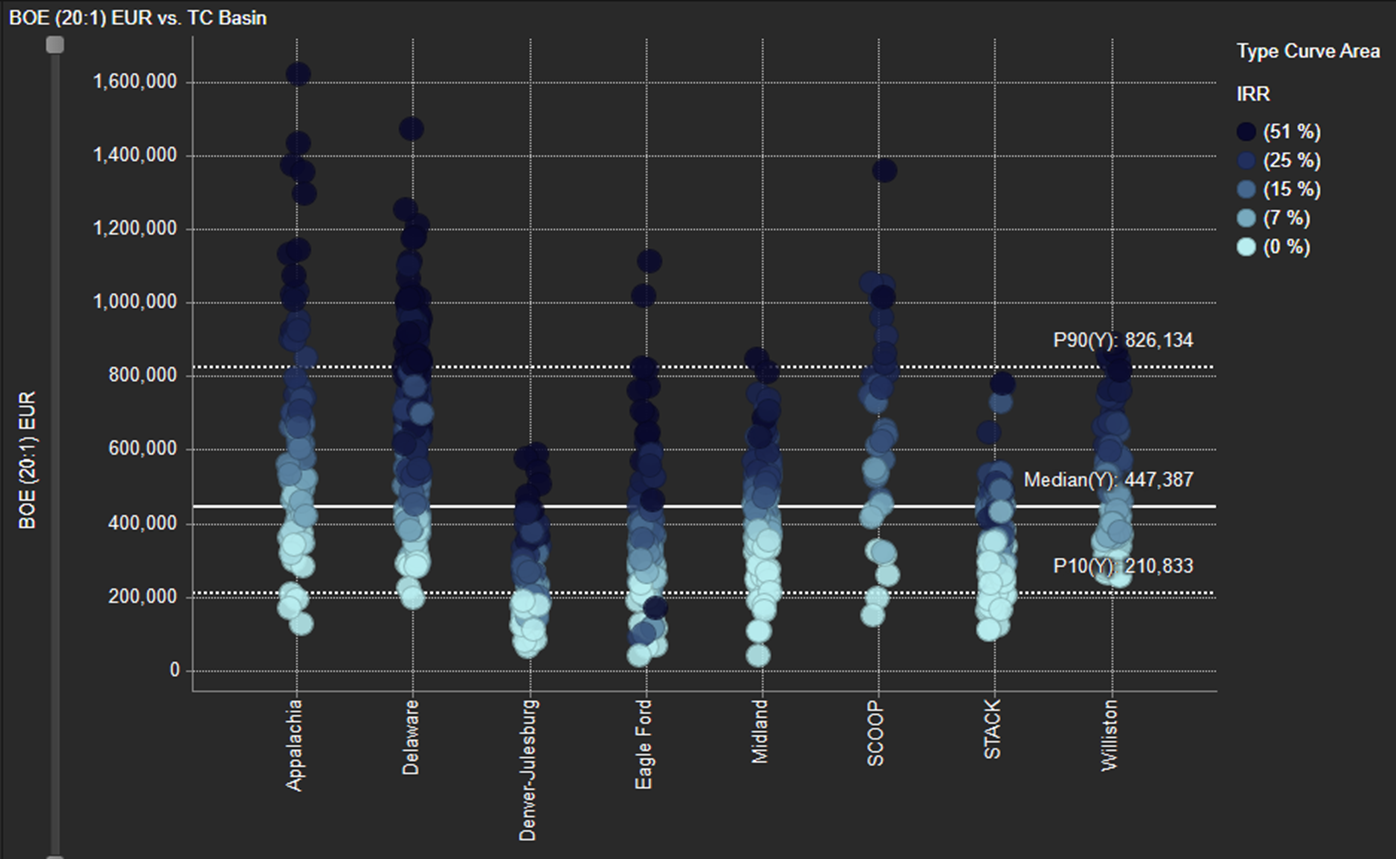
Turning to permits, a declining trend since the fourth quarter of 2018 is visible across the major basins (Figure 3). The Denver-Julesburg (D-J) has had the largest drop since the fourth quarter of 2018. This is partly attributable to Colorado’s ongoing uncertainty surrounding the oversight of oil and gas operations in the state. However, weak commodity prices and investor calls for “living within cash flow” are contributing to the overall reductions across all basins. Despite the overall trend, it should be noted that the Permian Basin saw an increase in permits during the first quarter of 2019 and currently has the most permits filed in the U.S. This suggests it continues to be the most economic basin and where the activity will continue despite lower prices. Figure 4, taken from Enverus’ Dynamic Basin Studies, confirms the Delaware Basin has some of the best EURs (20:1) as well as rate of returns across the entire Lower 48.
Following the downturn ending in the second quarter of 2016, rig counts had been consistently on the rise through the fourth quarter of 2018 (Figure 5). Since then, the trend has reversed and steadily declined to levels last seen in the first half of 2017. As Wall Street has required a shift in focus to return to shareholders, a pullback in activity has ensued.
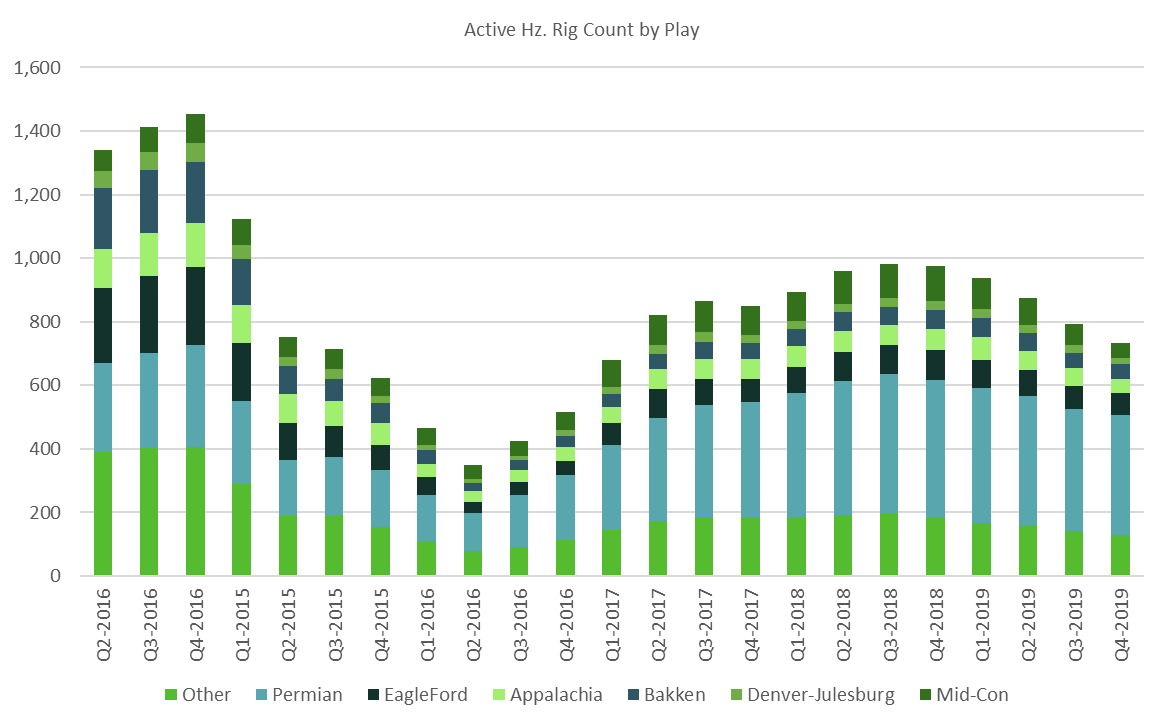
The sharpest declines have occurred in the Anadarko (Scoop/Stack) and Permian Basin. The Scoop/Stack has been struggling with type curve degradation issues. Interference from tight well spacing and parent/child well relationships has led to an average decline profile that has deteriorated recently (Figure 6).
Bankruptcies have contributed to the Scoop/Stack rig count decline, with Alta Mesa dropping eight rigs essentially overnight. Finally, some operators have chosen to exit the region and deploy capital elsewhere (e.g., Cimarex shifted capex to the Delaware Basin following the Resolute acquisition).
In the Permian Basin, the declines are mostly due to operators taking a more cautious stance in terms of operations and free cash flow generation. However, some poor results in the southern Midland Basin also have led operators to exit the basin in search of better returns elsewhere (e.g., EP Energy).
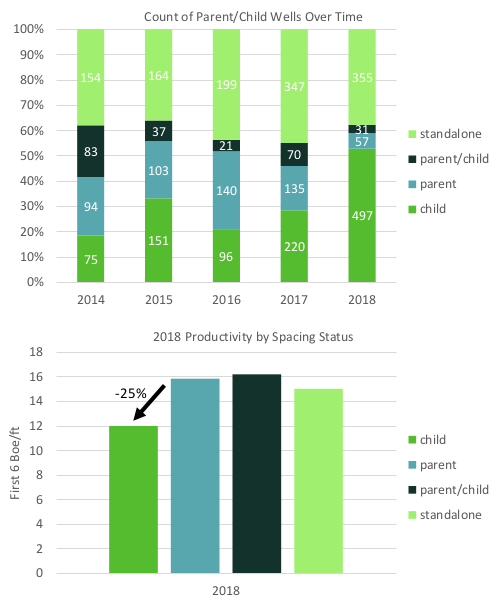
Enverus’ Well Spacing module helps analyze important effects that parent/child well relationships and spacing have on well productivity across basins. Figure 7 shows a clear shift toward downspacing in almost all basins. This also correlates with the increase in the number of child wells over time. The increase in child wells is the main reason for the slowdown in type curve efficiencies. The chart on the top right of Figure 7 shows lower well productivity (boe/ft) for these wells.
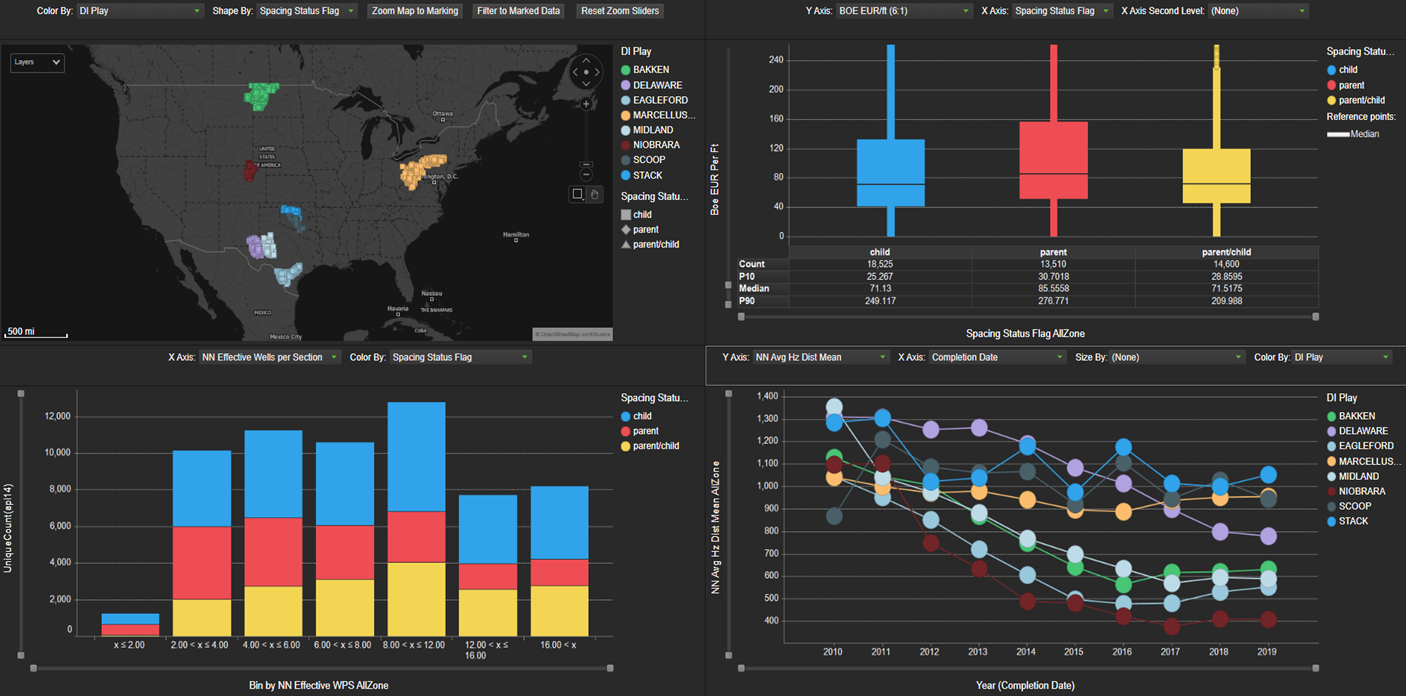
Figure 7 shows the parent/child wells over time in Scoop/Stack and their productivity from a boe/ft perspective. The productivity degradation due to the increasing number of child wells with lower productivity has been more prominent in the Scoop/Stack and is one of the main factors for stagnant efficiencies seen there in the past few years. There is an increasing number of child wells that have nearly 25% less productivity. This is a concern for future productivity.
Although rig count and permitting activity have been on a decline due to low commodity prices and the mantra of living within cash flows, low breakevens across the Lower 48 still make it viable for producers to continue their operations and increase production (Figure 8).
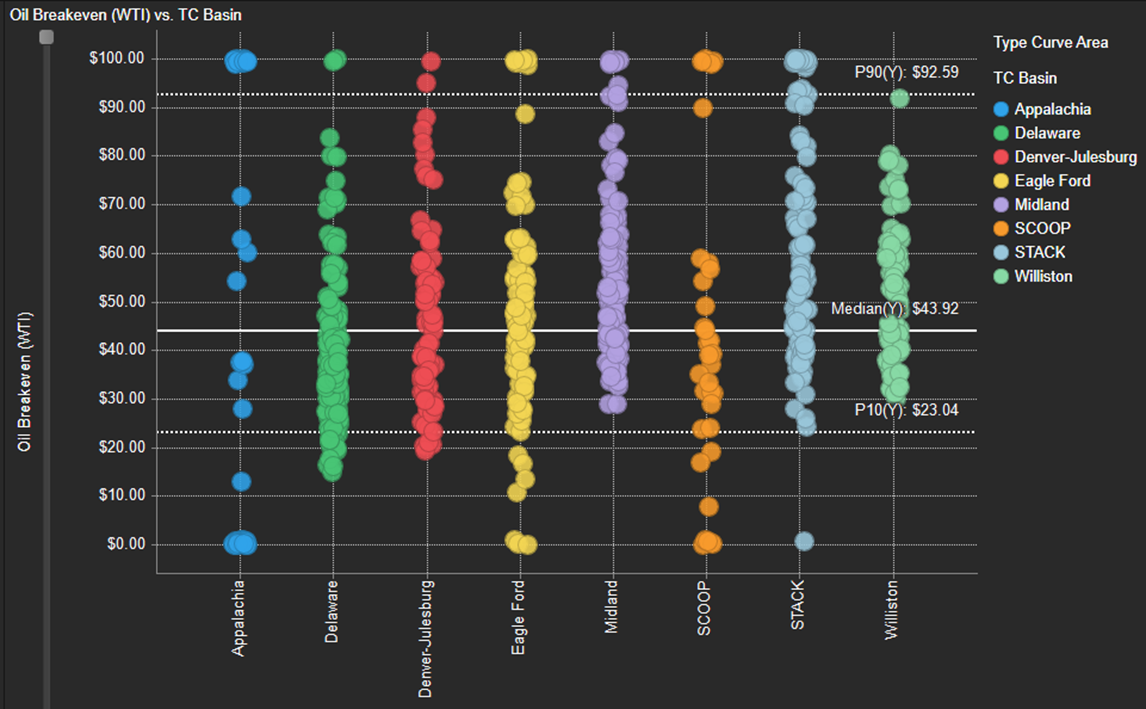
As seen in Enverus’ Dynamic Basin Studies, an abundance of the areas within the major basins are breaking even below the $50/bbl WTI threshold. The Delaware and Eagle Ford, in particular, both show substantial acreage that is economical below the $50/bbl mark.
Over the past few years, operators have been ramping up their engineering practices and completing their wells more extensively. Additionally, they are piecing together more contiguous acreage positions to become more operationally efficient. These trends are seen across all unconventional plays in the Lower 48, but they do vary in magnitude by play. Some older, more mature plays, such as the Bakken, have plateaued in terms of completion intensity. This is unlike some of the newer, more active plays, such as the Midland Basin, where operators are pushing the limits to see how far they can go.
Increasing lateral lengths is one metric that is observed in all plays in the Lower 48, albeit at different magnitudes, as operators are trying to make more contact with the targeted formation. In the Delaware Basin, the hottest play in the U.S., laterals have increased 54% over the past five years, from 4,993 ft to 7,708 ft. This noticeably differs from the Bakken, a more mature play, which has only seen an increase of 550 ft in average lateral length in the past five years, a 6% increase. Being a more mature play, longer laterals had already been established in the Bakken, as the average lateral in 2015 was 1,127 ft longer than the average lateral in the Delaware in 2019 (Figure 9).
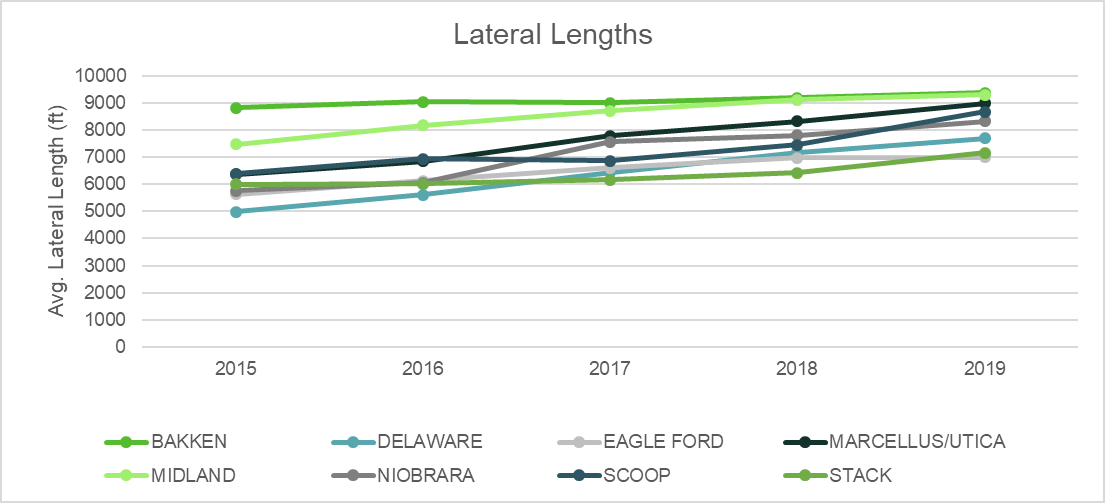
Operators in the Marcellus/Utica and in the Midland have been pushing the boundaries of lateral lengths, as both plays have multiple examples of nearly 4-mile-long laterals. In the Marcellus, both Range Resources and EQT have drilled a few wells with more than 19,000-ft laterals. EQT currently has two more wells with similar lateral lengths permitted in Greene County, Pa. In the Midland Basin, both Pioneer and Chevron have each completed a well with a 4-mile-long lateral.
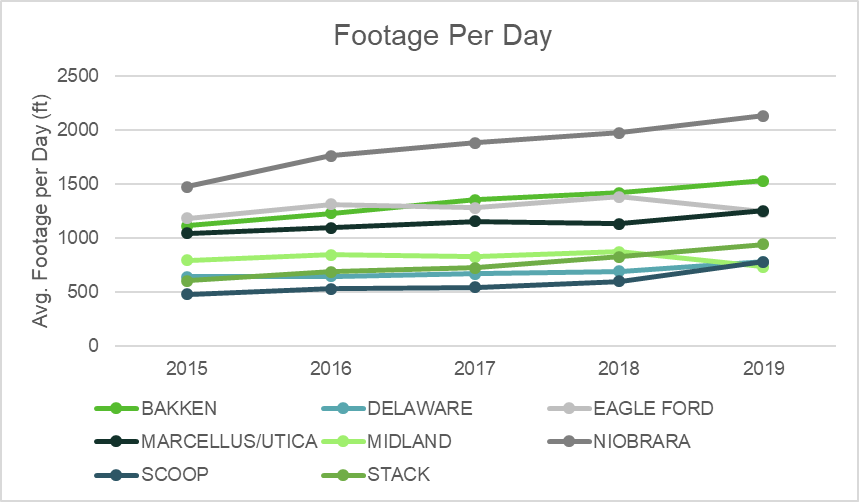
Despite these longer laterals, operators have lost little to no time in drilling them. Improvements in technology and operational efficiencies have allowed companies in most of the major plays to drill these laterals faster and, in some cases, remain on location for less time (Figure 10). This especially stands out in the Niobrara in the D-J Basin, where the clayey rock has allowed operators to increase the footage drilled per day to 2,129 ft, an increase of 44% since 2015. The Scoop/Stack plays also have greatly increased their drilling speeds. The only play to see a decrease in drilling efficiency is the Midland – the longer laterals being drilled result in more days on location.
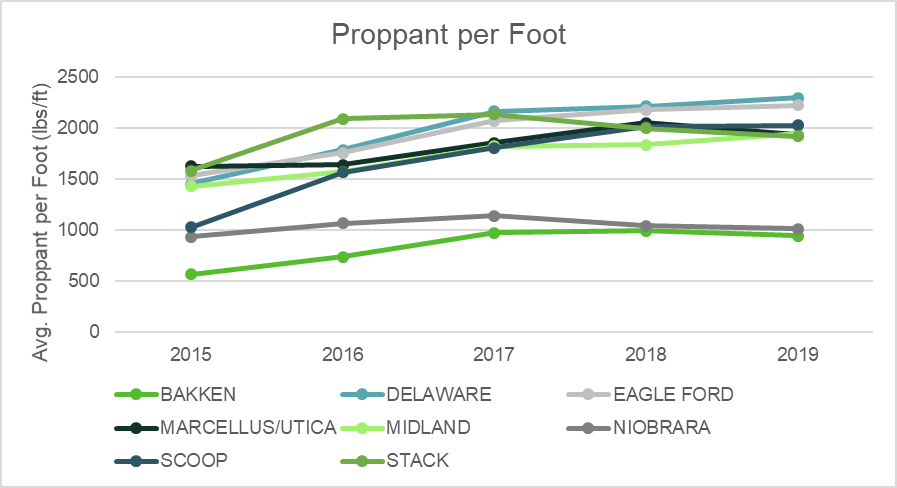
In addition to longer laterals, operators are trending toward completing their wells with more proppant and fluid as they aim to open up and stimulate as much rock as they can (Figure 11). However, these increases are not as dramatic as those seen in the lateral length trend, as most of the plays have leveled out in terms of proppant and fluid used. For example, in the Delaware Basin, proppant intensity increased 49% from 2015 to 2017 but has since increased only 6%. Even in some plays, such as the Bakken and Niobrara, proppant intensity has actually decreased since 2017. In many of these plays, total proppant used in a well may be increasing at a slower rate than that of the lateral lengths, yielding steady proppant intensity through time.
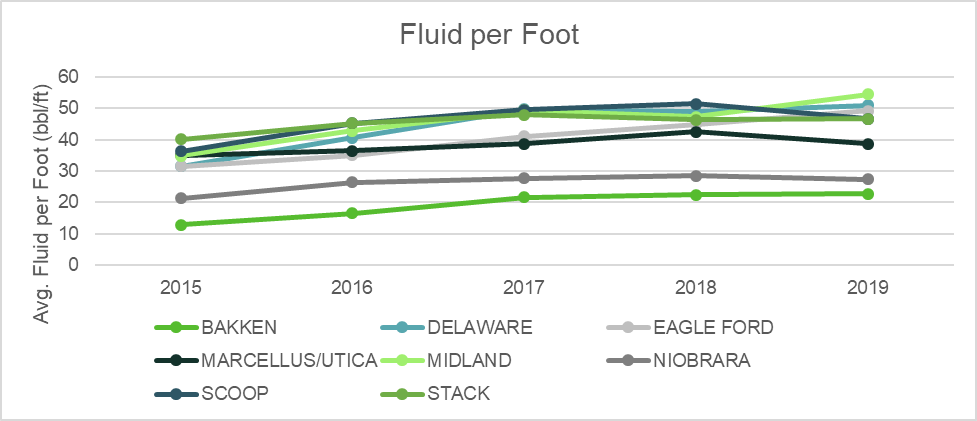
Fluid intensity has seen a trend similar to that of proppant, as most plays saw a noticeable increase up until 2017 and then proceeded to stabilize. As seen with proppant intensity, the clayey rock in the Niobrara and Bakken calls for less fluid than in the other plays. The Eagle Ford is one of the only plays to have seen a large increase in fluid per foot since 2015, increasing 56% to 49 bbl/ft. In terms of fluid types, most plays are trending more toward slickwater fracs, with the exceptions being the Niobrara and Bakken plays, which use crosslink gels more frequently (Figure 12).
Wellbore lengths will continually increase in the coming years as drilling efficiencies increase. Completion practices will vary by play, as some plays show the effectiveness of increasing frac design, while in other plays, these designs seem to have reached their peaks.
Operator trends
The industry is in a new era of oil and gas in 2019. Only a couple of years ago, operators’ quarterly results were judged by whether they hit production targets, and the mentality was “drill, baby, drill.” This year the E&P mantra has shifted to key themes such as generating free cash flow and returning cash to shareholders. These themes all start with another key focus: capital efficiency.
A shift in E&P operator activity began to surface in late 2018 and early 2019. Over that period, oil prices became increasingly volatile (dropping from $70/bbl to $45, and then rallying back up to $60/bbl). Operators that had previously announced a 2019 capital budget began publicly adjusting their plans to fit the times. The free cash flow theme was but an ember in 2018, but the oil price volatility in 2019 added oxygen to create a flame.
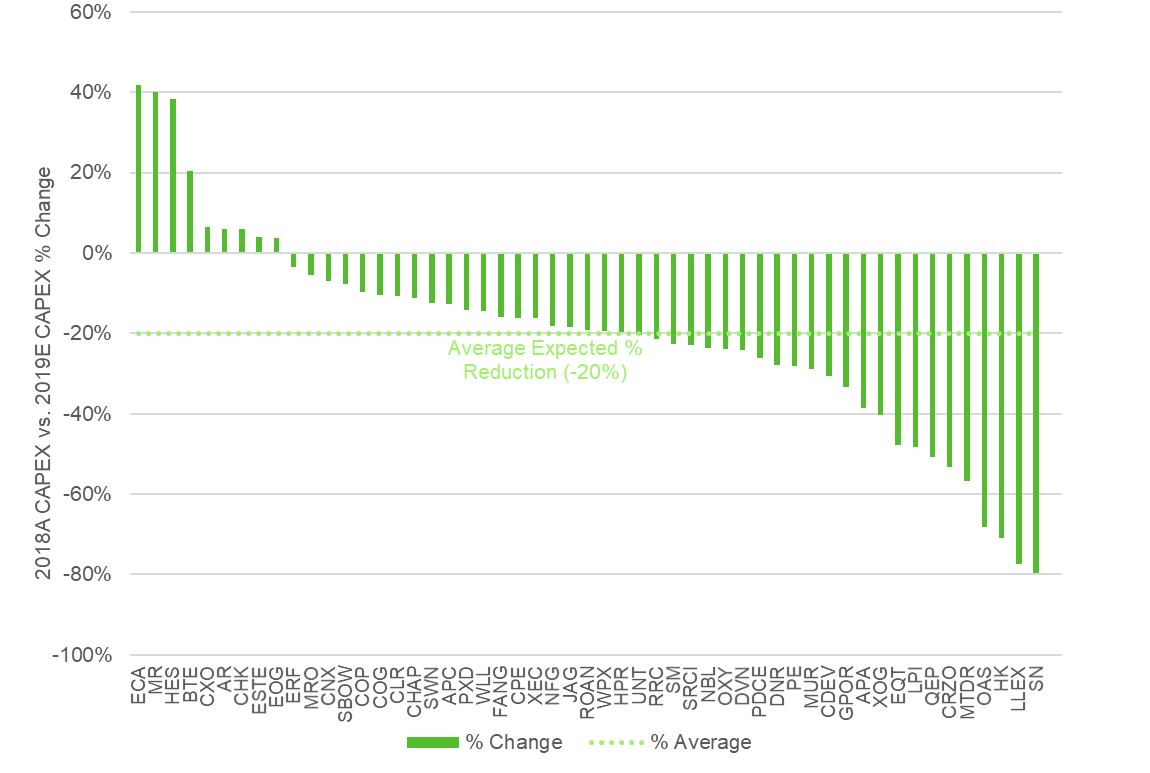
Coming out of the first quarter, many operators announced the reduction of capex compared with 2018 levels – some with reductions more than 60% (Figure 13). Of the more than 50 E&P companies Enverus covers, plans were to be 80% of 2018 levels. Almost all the operators that were planning to increase capex had an acquisition during 2018, which disproportionately buoyed their growth amounts, and that likely was still less than what the combined companies would have demonstrated separately. This included Baytex (Raging River), Chesapeake (WildHorse), Concho (RSP), Encana (Newfield) and Montage (Blue Ridge and Eclipse).
Of course, an operator can generate free cash flow by not spending a dime on drilling and completions. However, investors want sustainable free cash flow and continued operations without sacrificing current production levels, which circles back to the concept of capital efficiency. Operators are asking themselves, “How can we spend as little as possible while also maximizing sustainable free cash flow?” The advantage goes to operators with flatter production declines and the smallest replacement wedge. Newer production is expensive to replace, as one well could see a production decline of more than 50% in the first year. When production declines are low, it is much easier to sustain constant cash flow. Therefore, every dollar put in the ground is doing more to keep production flat than it would if production declines were high (Figure 14).
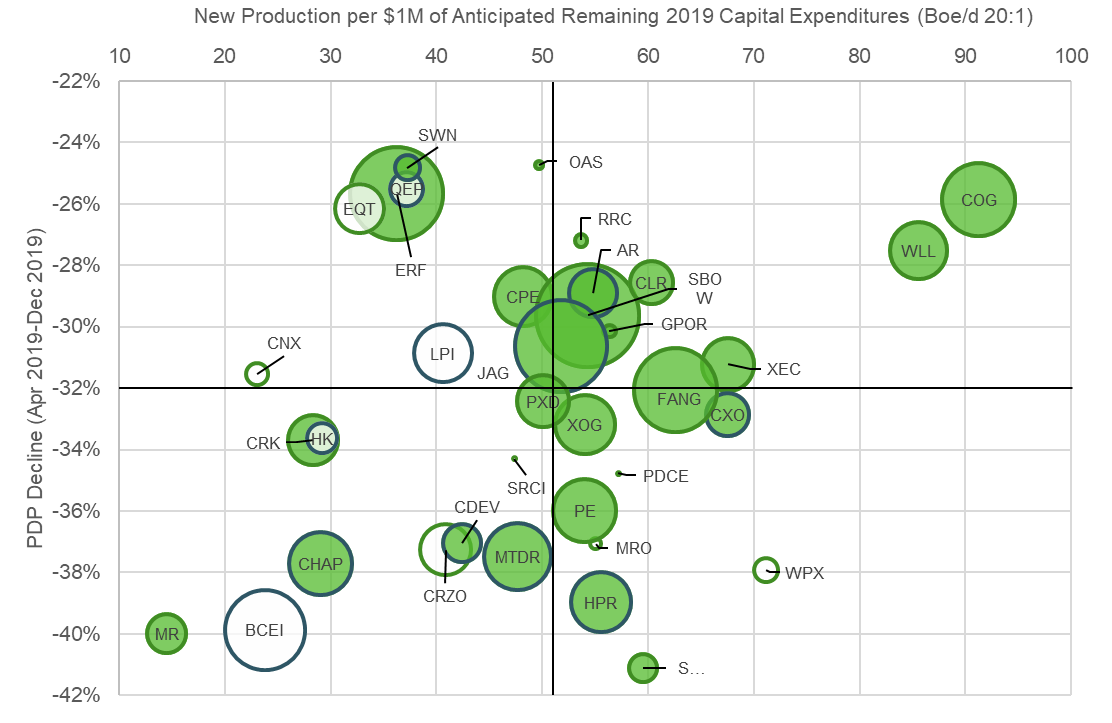
Present-day Production Decline Relative to Consensus Capital for the Balance of 2019:
Operators’ abilities to generate and sustain free cash flow
What’s next?
With WTI hovering between $50/bbl and $60/bbl, capital efficiency, free cash flow and returning cash to shareholders will remain in focus. Many operators are making significant strides despite the challenges. Some preliminary 2020 plans have started to trickle in. Most hint at a capital program that’s near or less than what will be spent in 2019 or at a level near maintenance capital (only spending enough to keep production flat). If oil prices remain weak, investors may favor maintenance capital as the 2020 program of choice. Several companies are dropping rigs ahead of schedule, citing reduced cycle times and other operational efficiencies, but free cash flow status could be the leading cause. Continental, Centennial, PDC and Parsley are examples of operators that plan on dropping rigs in the remainder of the year.
Enverus expects next year to be just as sensitive. Management will be dialed in to answer the big questions: Did the company deliver on free cash flow? Did the company fall within or below its capital budget while still hitting production targets? If the company did not return cash to shareholders, do it have a clear line of sight on how and when it plans on getting there in 2020? And last, can the company provide 2020 guidance in line with the market’s estimates? If the price softness continues, Enverus may see more downward revisions of capex in 2020.
Production forecasts and logistics
Tight oil production in the U.S. is highly dependent on global market conditions. Capital flows into the sector in times of high oil prices, thereby stimulating production growth. The opposite is also true; prolonged periods of low crude oil prices can drive capital out of the sector, cause upstream investment to dry up and result in flat production growth or even outright production declines. While some would argue that this level of sensitivity to market prices has made the U.S. into some kind of “swing producer” like Saudi Arabia, the fact is that tight oil production in recent years has tended to be more responsive to decreases in oil prices than the other way around. Furthermore, being a true swing producer like Saudi Arabia requires being able to deliberately set aside perfectly good production capacity as a means of supporting market prices. In contrast, U.S. tight oil producers are generally price takers and are (almost by definition) producing at or very near full capacity. While the U.S. cannot accurately claim the mantle as the world’s newest swing producer, one can certainly acknowledge that U.S. tight oil has a much higher price elasticity of supply than virtually any other non-OPEC source of production.
Although market conditions today do not portend outright production declines as witnessed in 2015-2016, it does appear to be the case that the slowdown in global economic activity will diminish the outlook for petroleum liquids consumption and, therefore, will have a cooling effect on outright crude oil prices. The question on most people’s minds today is what will happen to U.S. tight oil production in the aggregate if the price of WTI continues to linger in the low $50s. Would producers further reduce capex at these low prices, and what price level would be required to convince producers to increase capex again so that the recent slowdown in production growth can be reversed?
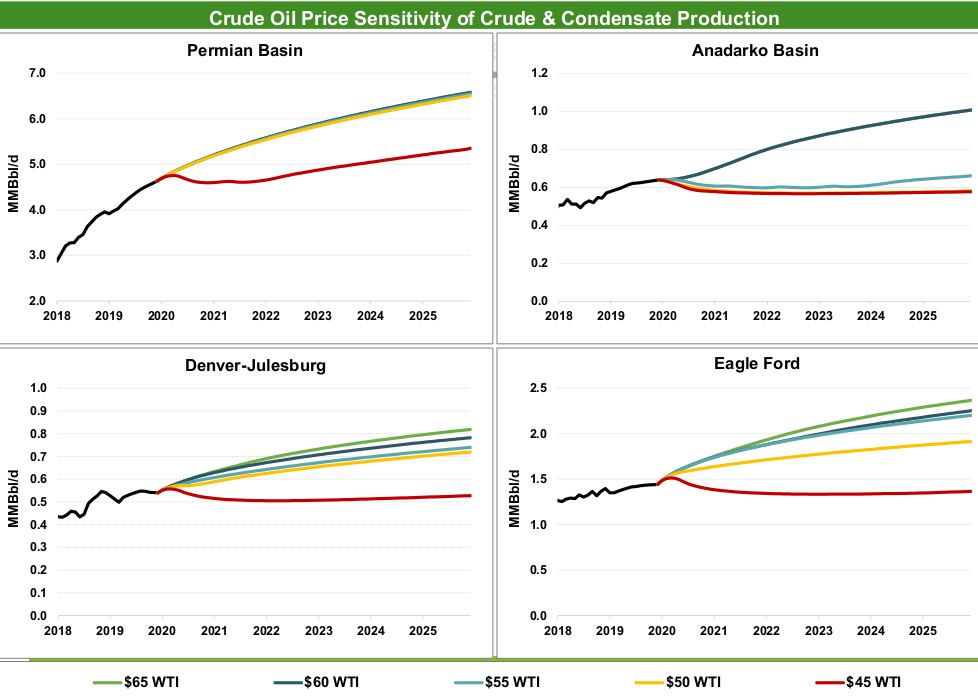
Figure 15 summarizes the impact on total U.S. crude and condensate production amid various price environments for WTI crude starting in January 2020 (for the balance of 2019, Enverus assumes operators will hold true to their annual production guidance estimates). Given the breakeven analysis presented earlier, it should be no surprise that $50/bbl is the level that keeps U.S. crude and condensate production growing. In fact, it would not take too much of a decrease in prices below $50/bbl WTI to send production into an outright decline in 2020. Note the white space between the lines; starting at $50/bbl production rises modestly with each $5/bbl increase in the price of WTI. Contrast that with the drop in output over the next year when the industry takes the price of WTI down from $50/bbl to $45/bbl.

Not all tight oil and gas basins are created equal when it comes to breakeven thresholds, and this shows up in Enverus' production sensitivity analysis as well. With some of the lowest half-cycle breakevens in the country located in the Delaware Basin, growth in Permian crude production can comfortably keep humming along on its current trajectory even if the price of WTI crude stayed steady at $50/bbl. Production in the Eagle Ford and D-J are similarly advantaged at $50/bbl, but both need much higher price levels for them to reach their full potential. In contrast, oil production growth in the Anadarko Basin (home of the Scoop/Stack and Merge plays) cannot gain traction unless the price of WTI is close to $65/bbl. Between these two polar extremes sits the Bakken, where oil production would struggle to get much beyond 1.5 MMbbl/d with the price of WTI at $50/bbl but at least would not fall at those price levels (Figure 16).
The sensitivity of tight oil production to changes in the flat price environment for crude also can impact basis differentials and create eye-watering arbitrage opportunities. Although U.S. tight oil producers cannot move as fast as Saudi Aramco when it comes to bringing barrels to market, they certainly have demonstrated their ability to swamp existing midstream infrastructure due to the long lead times and permitting requirements for new pipelines. Over much of the past decade, the rampup in tight oil production has been mostly associated with blowouts on a local price basis. Differentials that one could drive a truck through have been a common development, and that’s not an exaggeration. These arbitrage opportunities come to an end when gathering, processing and long-haul pipeline capacity eventually catch up—knowing how much capacity to bring online and when, however, can be a tricky matter.
Throughout the U.S., crude oil pipeline projects have been moving forward with the intent of debottlenecking congested transportation corridors. Before construction can begin, though, midstream companies need to line up committed shippers to guarantee enough throughput to make these projects commercially viable. These commitments, which are done on a take-or-pay basis, lock shippers into a set amount of crude they plan to move on the pipeline every month for a specific period of time (typically two to five years, but sometimes as much as 10 years). The fee for the service is a committed tariff rate plus variable costs for pump-overs, terminal fees and volumetric losses. If a shipper does not have enough volume to utilize its commitment over a given month, he or she is still on the hook with the pipeline operator for the difference. This can lead to devaluation of the implied value of the line space as traders try to minimize losses by shipping third-party barrels at a discount to posted tariff rates. When total pipeline capacity out of an oil-producing basin is significantly greater than the total volume that needs to be moved, tight (or closed) spot arbs and tariff compression generally follow.
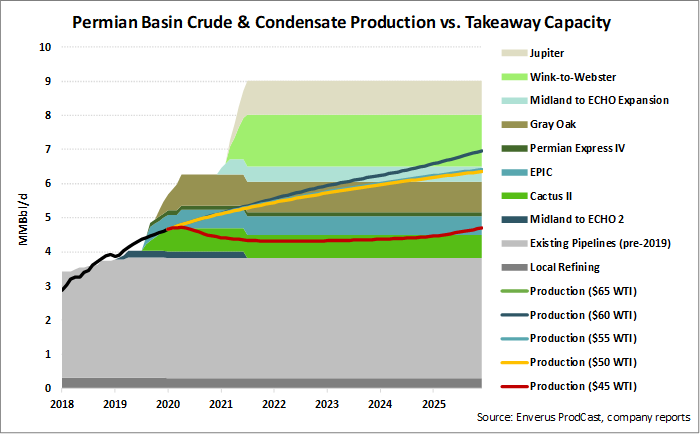
Recent developments in the Midland Sweet market provide a classic example of this. Three major pipelines with a combined capacity of 0.9 MMbbl/d came online in August and September, boosting total ex-basin takeaway capacity to levels well in excess of current production. The result has been a steep runup in Midland crude differentials (now positive to WTI Cushing), tight spot arbs and a race to the bottom in noncommitted tariffs on existing pipeline systems. Strong Midland differentials are expected to be the norm over the coming two years as successive pipeline projects boost outbound capacity by at least another 2.4 MMbbl/d. The next major tranche of capacity will come online in November, with the start of the Gray Oak pipeline (900,000 bbl/d) [Figure 17].
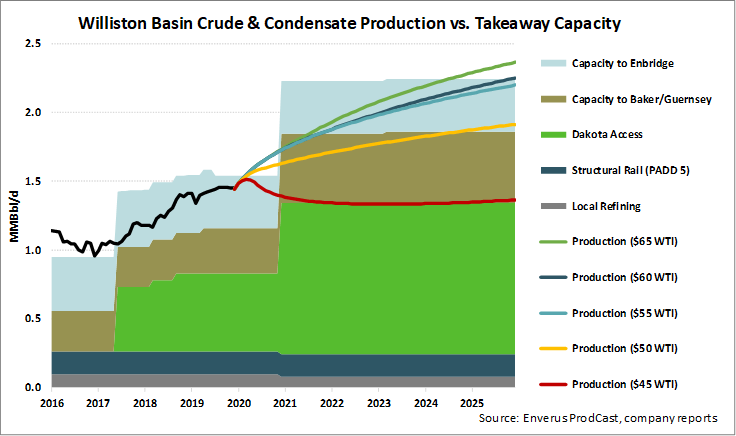
Basis differentials in the Bakken and Rockies may also strengthen when pipeline capacity is increased in those areas in the next couple of years. But unlike the Permian, where Enverus' economic modeling suggests production would continue to move forward at a heady rate regardless of whether the flat price of WTI is $55/bbl or $65/bbl, production in the Bakken and D-J could flatline if prices stay at today’s levels for an extended period. Future shippers with commitments on the upcoming Liberty pipeline as well as the expanded Dakota Access, Bridger, Pony Express and Saddlehorn pipelines may find themselves with more pipeline space than they need (at least in the first one or two years of operation).
If market conditions worsen and a $45-50/bbl WTI flat price environment prevails through the end of 2020, crude oil balances in North Dakota could end up so tight that crude by rail to the East and Gulf Coasts would vanish and Bakken volumes to Clearbrook on the Enbridge North Dakota pipeline would be substantially curtailed. To fill all pipelines out of the basin as well as the 160,000 to 170,000 bbl/d of structural rail that habitually moves to the Pacific Northwest, a flat price environment closer to $65/bbl WTI or much stronger differentials in the field would be required. Needless to say, an expansion of the Dakota Access pipeline would put a much larger tranche of marketed Bakken production on a netback basis to the Gulf Coast and goose up differentials as fewer barrels are left to clear into lower-value markets. In Enverus' modeling of the Bakken, it assumed a steady $5/bbl discount to WTI Cushing. In reality, Bakken prices in the field could rise to parity with Cushing (or higher) if pipeline capacity is significantly overbuilt. This, in turn, could gin up more production than presented here, using Enverus’ simplified price assumptions (Figure 18).
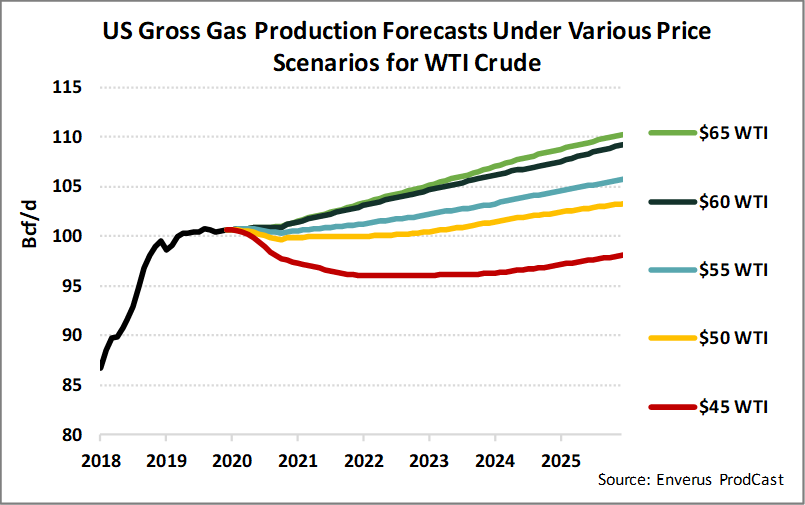
The sensitivity of tight oil production to prevailing market prices has implications for gas markets as well. Since associated gas makes up 30-35% of U.S. gross gas production, any change in drilling plans resulting from a changing WTI flat price environment has knock-on effects for natural gas and NGL production as well (Figure 19). Indeed, the Permian Basin has been a major source of natural gas production growth in recent years, mainly due to associated gas. Bakken, D-J and Anadarko Basin gas production is also largely a function of oil production.
The impact of changing crude prices on gas production is easy to see at the macro level. Gross gas production in the U.S. was estimated at 100.6 Bcf/d in September and is on track to average just over 100 Bcf/d for the year (up from 2018’s average of 93.2 Bcf/d). If the price of WTI stays roughly around $50/bbl, total U.S. gross gas production could exit 2020 at 99.8 Bcf/d. A further drop in the price of WTI crude to $45/bbl would take gross gas production down to 97.4 Bcf/d by December 2020 (Figure 20).
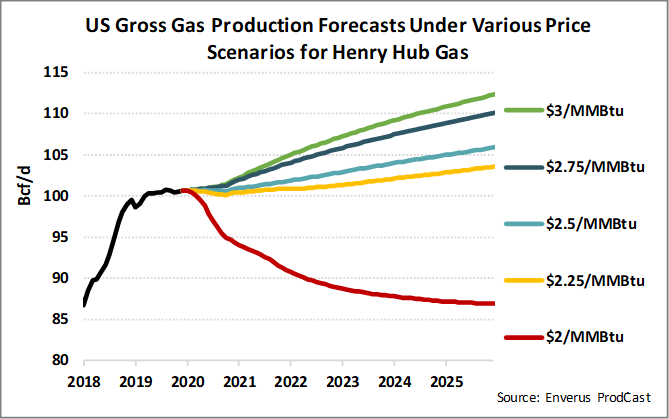
Of course, some supply basins are more sensitive than others to changes in the market price of crude oil. Areas where dry gas predominates are largely immune to volatile crude oil prices. For these areas, production is a function of gas prices and access to capital. Gas prices are low at time of writing, with Henry Hub for December delivery trading at $2.44/MMBtu and calendar 2020 averaging only $2.37/MMBtu.
In an example similar to what was previously done with crude oil prices, U.S. gross gas withdrawals would exit 2020 at only 94 Bcf/d if the industry held gas prices constant at $2.00/MMBtu and pegged WTI at $55/bbl. Keeping WTI at $55/bbl, gross gas production would end 2020 roughly 102 Bcf/d if gas prices at Henry Hub reached $3.00/MMBtu and stayed there. Gas prices between $2.25/MMBtu and $2.50/MMBtu combined with static crude prices at $55/bbl result in a flat outlook for production. The areas most sensitive to changes in the price of gas are, as one would expect, dry gas producing regions (e.g., Haynesville, Utica, and Marcellus dry windows). Likewise, the areas where gas production is the least sensitive to changes in gas prices are those places where crude oil is the predominant commodity: Permian, Bakken and D-J. Wet gas and condensate-rich plays like the Eagle Ford and the Scoop/Stack plays in the Anadarko Basin are at the mercy of oil and gas price fluctuations.
Of course, crude oil and natural gas prices are both variable, and there can be an almost infinite number of commodity price combinations that can affect future rates of production growth. The prior examples were specific to crude oil and natural gas, but the value of NGL purity products is also a major factor influencing a producer’s decision to advance or postpone drilling plans. Access to markets and the adequacy of midstream infrastructure are also major considerations. Flaring can result when gathering and processing capacity are insufficient, and large basis blowouts can happen when existing long-haul pipelines are full.
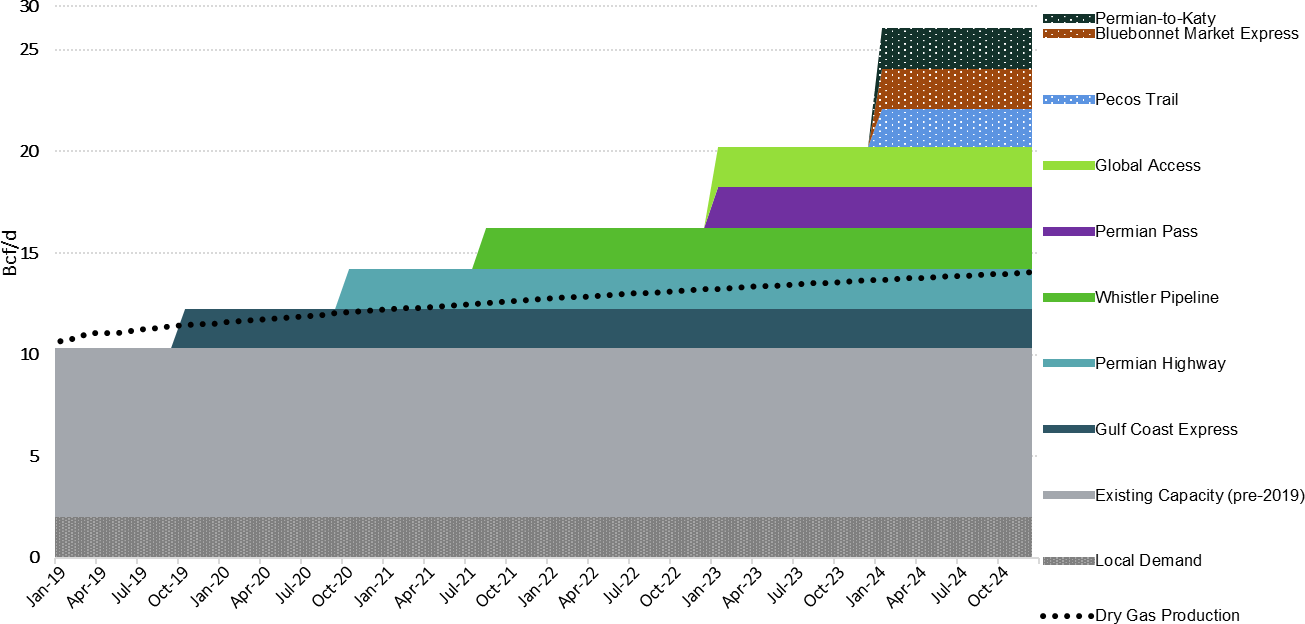
Unlike the situation with Permian crude oil takeaway capacity, ex-basin pipeline capacity for natural gas is expected to remain tight until late 2020 and possibly into early 2021. Flaring will continue, but it will be substantially reduced during this transition period as pipeline space becomes available. Pressure will also gradually come off the Waha basis as supply is able to access less-congested markets along the Gulf Coast. Key to this long-delayed relief materializing is the timely completion of the Gulf Coast Express pipeline (1.98 Bcf/d) in mid-September, the Whistler pipeline (2 Bcf/d) in mid-2021, and the Permian Highway pipeline (1.9 Bcf/d) in the fourth quarter of 2021. These three pipelines together should provide enough egress capacity to clear all dry gas production out of the Permian Basin through the end of 2024 given today’s commodity price outlook.
If that is not enough, five additional pipeline projects have been proposed for startup dates in 2023 and beyond (Figure 21). These include Permian Pass (2.0 Bcf/d), Global Access (2.0 Bcf/d), Pecos Trail (1.85 Bcf/d), Bluebonnet (2.0 Bcf/d), and Permian-to-Katy (2.0 Bcf/d). Much like the potential for an overbuild in pipeline and export capacity Enverus foresees in crude, it is clear that not all five of these projects will be necessary. Indeed, Bluebonnet, Pecos Trail, and Permian-to-Katy have already been put on hold.
Looking at the Marcellus/Utica, this Northeast supply region was traditionally a pass-through for gas produced in the Southeast/Gulf, Midcontinent and Canada on its way to serve premium Northeast demand. In the shoulder seasons, it also served as a destination to store gas for eventual consumption in the premium Northeast demand markets. This all changed with the shale revolution when the Marcellus and Utica formations began to produce prodigious volumes of gas. Today, the region contributes 34% of total U.S. dry gas production. It also became a net supply region for the gas market in 2016 (Figure 22).
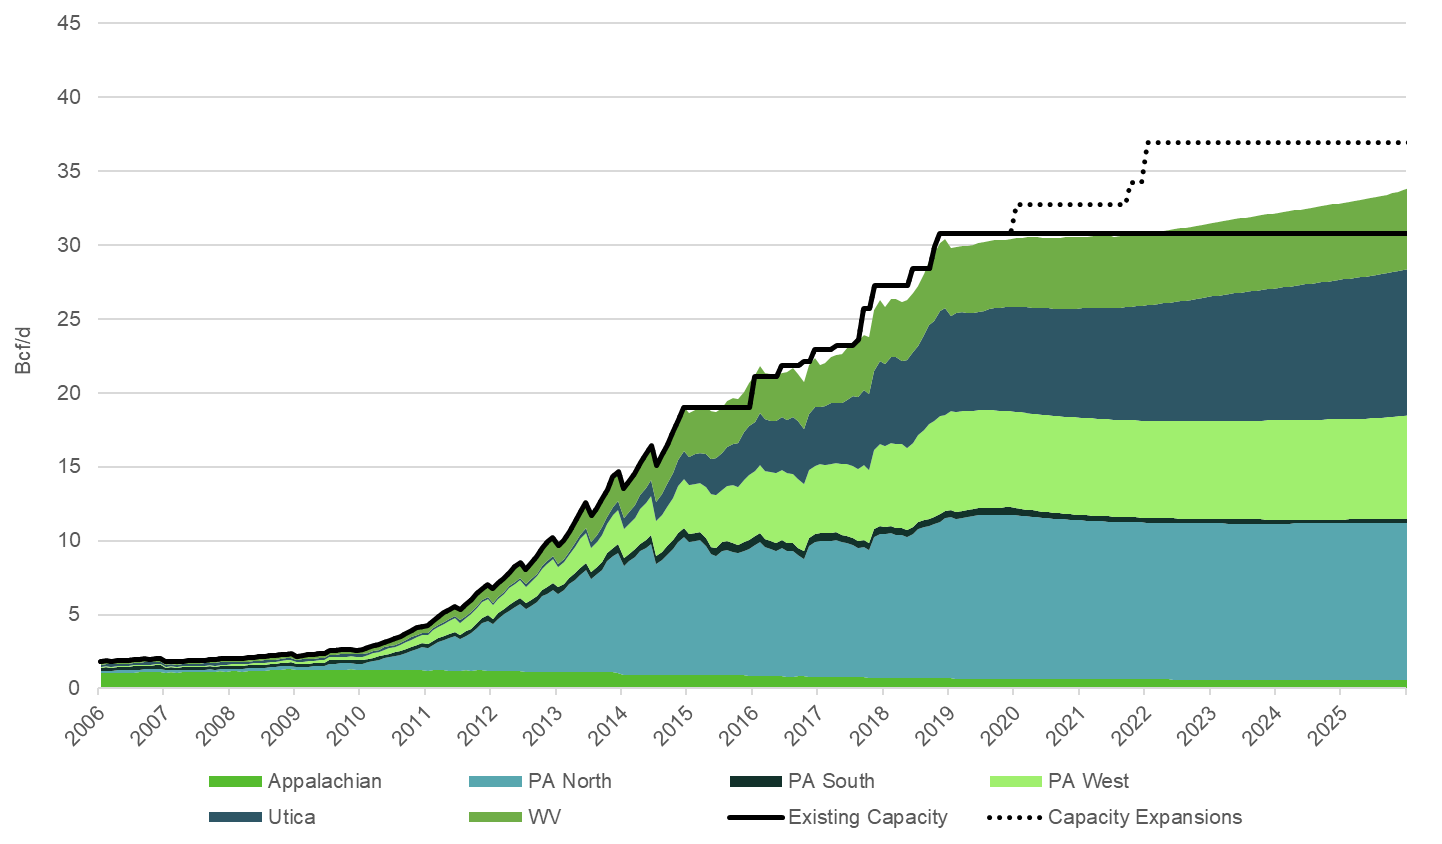
Lack of pipeline capacity to move growing natural gas supply to market had been the main challenge for producers since 2013. This caused pricing in the region to trade at levels significantly below Henry Hub. Northeast basins traded as low as minus $2.00 per MMBtu multiple times in the past five years. Capacity additions failed to keep up with production growth, and the basins remained depressed. However, at the end of 2018, additional pipeline expansions effectively debottlenecked the region. Regional pricing improved, with all price locations trading back to levels within variable transport costs of $0.20-$0.30 below Henry Hub.
Nevertheless, this can change in the near future, as production continues to grow and is quickly approaching capacity again. There are multiple projects expected to come online starting in 2020, yet they all are battling on the regulatory side, specifically related to environmental permits. The region will still struggle in shoulder seasons, and if the currently proposed projects cannot be placed online, expect basis to widen again as early as next year.
Final thoughts
So what has been learned to this point in 2019? The takeaway is clear that the myriad of efficiency gains and technological advancement drive high productivity, but not everywhere, and with significantly different market implications.
The outlook for 2020 still supports growth, but at a markedly slower trajectory than in recent years. Much will eventually hinge on the global demand picture and its ability to support the continually increasing output.
The industry has responded to Wall Street’s demands. The question soon will become whether Wall Street will respond to the industry’s performance.
All charts courtesy of Enverus. For questions or comments, contact Jennifer Presley, executive editor, E&P, at jpresley@hartenergy.com.
Read each of E&P's "2020 Unconventional Yearbook" articles:
OVERVIEW: Oil and Gas Production Forecast: 2020 and Beyond (see story above)
KEY PLAYERS: Shale Growth Slows For Top US Operators
TECHNOLOGY: E-fracs, Refracs And The Role Of Digital Technologies
ENVIRONMENT: Stepping Up for an Environmentally Sustainable Energy Future
LNG SPECIAL REPORT:
Recommended Reading

Deep Well Services, CNX Launch JV AutoSep Technologies
2024-04-25 - AutoSep Technologies, a joint venture between Deep Well Services and CNX Resources, will provide automated conventional flowback operations to the oil and gas industry.

EQT Sees Clear Path to $5B in Potential Divestments
2024-04-24 - EQT Corp. executives said that an April deal with Equinor has been a catalyst for talks with potential buyers as the company looks to shed debt for its Equitrans Midstream acquisition.

Matador Hoards Dry Powder for Potential M&A, Adds Delaware Acreage
2024-04-24 - Delaware-focused E&P Matador Resources is growing oil production, expanding midstream capacity, keeping debt low and hunting for M&A opportunities.
TotalEnergies, Vanguard Renewables Form RNG JV in US
2024-04-24 - Total Energies and Vanguard Renewable’s equally owned joint venture initially aims to advance 10 RNG projects into construction during the next 12 months.
Sitio Royalties Dives Deeper in D-J with $150MM Acquisition
2024-02-29 - Sitio Royalties is deepening its roots in the D-J Basin with a $150 million acquisition—citing regulatory certainty over future development activity in Colorado.