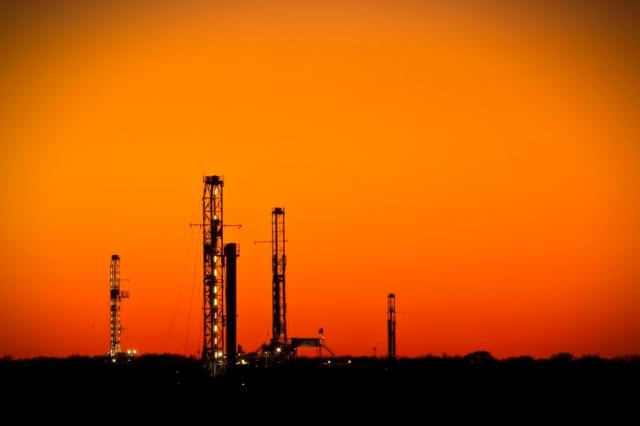
Oil and gas operations within the Eagle Ford Shale in Karnes County, Texas. (Source: Hart Energy)
[Editor's note: This story originally appeared in the April 2020 edition of E&P. Subscribe to the magazine here.]
Down 4%, down 8% and down 9%. Those are the last three quarterly averages for Hart Energy’s 2019 U.S. unconventional rig count. Had all gone well, and if one ignored sub-$50 oil prices, U.S. unconventional rig count was forecast (as of press time) to finish flat in the first quarter of 2020. For the “glass half full” crowd, a flat average rig count would have been good news. Maybe, just maybe, oil service sector carnage had established a painful bottom.
Granted, the current field activity storyline involved improved efficiency, deflating service prices and fortuitous E&P hedging that underpinned some drilling programs, especially in the Permian Basin.
RELATED:
US Oil Rig Count Drops to Lowest Since December 2016
Unfortunately, that combination created forecasting hazards. The original challenge for 2020 was, of course, the 10% to 15% pre-coronavirus decline in aggregate E&P capital spending. Furthermore, with service sector lines working on a cash basis only, it was unrealistic to expect additional sizeable service cost deflation. The E&P sector was consuming the oil service industry and its equipment, which was long-term unsustainable, especially if one bought the old thesis that production was destined to roll over in the face of increasing global demand. That theory held that the sky would become the limit on an activity recovery because oil service activity tracks commodity prices.
How real was that storyline in retrospect? Drilling efficiency gains stemmed from the conversion to pad drilling, suggesting the industry was entering a period of incremental improvement only versus traditional metrics such as spud to spud. Drilling contractors can bore hole even faster as the industry moves to infill drilling of less productive child wells, but fast drilling and quality horizontal wellbores often prove to be oxymoronic when the wells are turned over to the production engineers.
Fears of a pandemic and
a global crude oil war
over market share may cut
U.S. E&P capex by 25% in 2020.
The main problem with energy forecasting remains the uncertainty factor as the industry learned in March when the sector entered “the déjà vu all over again”’ phase of the oil and gas price cycle. A coronavirus-inspired decline in oil prices morphed into a global war for market share, which will last longer than the weeklong price boost after the Iranian assassination and the two-week price boost following the attack on Aramco facilities last fall. Now the wild card is how fast excess global crude supply will take to succumb to a market share war in the face of declining global demand.
There was little indication that the U.S. E&P sector had planned to attack the original problem, which was production volume growth. Spending less while continuing to grow made great press releases but kept Wall Street financing on the sidelines. If one uses natural gas producers as a yardstick, nothing provides the discipline to stop excessive production until commodity prices fall low enough long enough to restrict capex to maintenance production only.
What will the bottom look like? Tudor Pickering Holt & Co. rig count metrics had shown large-cap E&P companies up five units in the first quarter of 2020 versus a 25-unit decline in the fourth quarter of 2019. Large caps comprise 25% of the market. Similarly, small and mid caps were up 19 units versus an 18-unit decline in the fourth quarter of 2019. This cohort is 22% of the market. Big oil rose two units versus a 17-unit decline previously. But big oil is just 14% of the market. The rig count story year to date had been the 60-unit decline in rig employment among privately held E&P companies. This followed a 61-unit decline in the fourth quarter of 2019. Privates comprise 38% of drilling customers, down from 42% one year ago. Soon the public companies will join the privates in activity reduction. “From Russia With Love” is a wildcard that will halt U.S. E&P share buybacks and dividend increases as free cash flow evaporates in a capex environment that could fall 25% in 2020.
Recovery? It may be time to think 2022.
Recommended Reading
Keeping it Simple: Antero Stays on Profitable Course in 1Q
2024-04-26 - Bucking trend, Antero Resources posted a slight increase in natural gas production as other companies curtailed production.
Range Resources Holds Production Steady in 1Q 2024
2024-04-24 - NGLs are providing a boost for Range Resources as the company waits for natural gas demand to rebound.
BP Pursues ‘25-by-‘25’ Target to Amp Up LNG Production
2024-02-15 - BP wants to boost its LNG portfolio to 25 mtpa by 2025 under a plan dubbed “25-by-25,” upping its portfolio by 9% compared to 2023, CEO Murray Auchincloss said during the company’s webcast with analysts.
Mitsubishi Makes Investment in MidOcean Energy LNG
2024-04-02 - MidOcean said Mitsubishi’s investment will help push a competitive long-term LNG growth platform for the company.
Mexico Pacific Appoints New CEO Bairstow
2024-04-15 - Sarah Bairstow joined Mexico Pacific Ltd. in 2019 and is assuming the CEO role following Ivan Van der Walt’s resignation.


