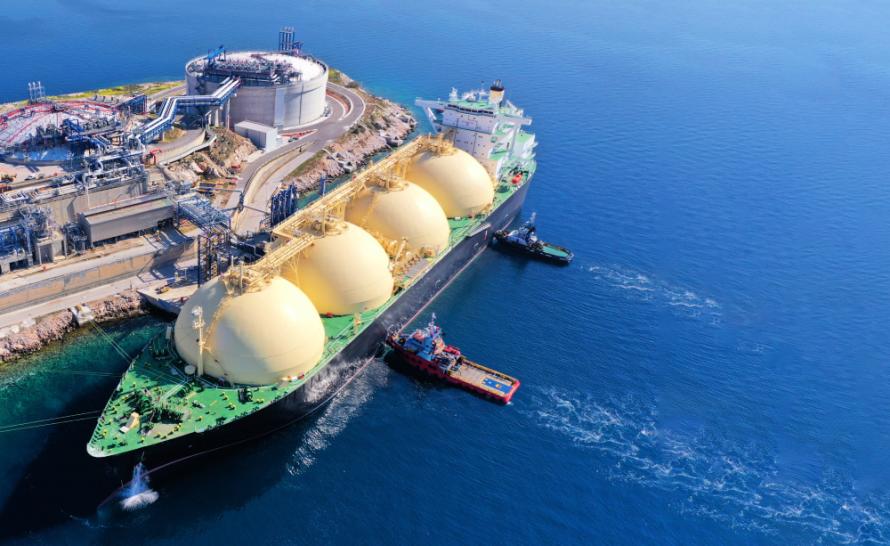
LNG trade—especially U.S. LNG exports—continues to grow amid geopolitical issues that threaten energy security for numerous countries. (Source: Shutterstock.com)
Australia remains the world’s largest LNG exporter but the U.S. is not far behind thanks to recent liquefaction additions.
Strong demand for LNG and significant U.S. aspirational liquefaction capacity in the pre-final investment decision (FID) stage will assure the U.S. maintains its top-tier ranking for years to come, according to a recent report by the International Gas Union (IGU).
Between January-April, new liquefaction capacity additions allowed Australia to boost its capacity to 87.6 million tonnes per annum (mtpa) while the U.S. boosted its capacity to 86.1 mtpa. The growth pushed the North American country ahead of Qatar with its 77 mtpa and into the second position.
LNG trade—especially U.S. LNG exports—continues to grow amid geopolitical issues that threaten energy security for numerous countries. At the same time, a continued global push to decarbonize economies has seemingly jettisoned a move away from fossil fuels such as oil and coal and to low- and zero-carbon sources like natural gas.
As of April, the global LNG trade was connecting 19 exporting markets with 40 markets equipped with LNG import facilities. China was the largest LNG importer in 2021, buying 79.3 mtpa in 2021, while Japan imported 74.3 mtpa. European LNG imports were 75.1 mtpa in comparison.
Global liquefaction capacity reached 459.9 mtpa in 2021, up 6.9 mtpa compared to 2020. The average global utilization rate was 80.4% in 2021, up compared to 74.6% in 2020 due to economic recovery following the lifting of COVID-19 restrictions, a prolonged European winter and drought in Brazil, all which boosted demand for LNG, the IGU revealed last week in its new 2022 world LNG report.
LNG has evolved as a vital energy source to “secure and reliable functioning of energy systems around the world… a vital tool for controlling emissions, particularly as the crisis in energy supply is forcing even the most climate-conscious economies to turn back to coal, wiping out emissions reductions achieved in recent years,” the IGU said, adding that “addressing supply constraints is going to be critical to energy security and economic stability in the world.”
LNG Trade
Global LNG trade in 2021 “reached an all-time high of 372.3 [mtpa], as the strong post-pandemic recovery resulted in a surge in LNG imports,” up 4.5% compared to 2020, according to the IGU.
To no surprise in 2021 Australia retained its position as the world’s largest LNG exporter shipping 78.5 mtpa, followed by Qatar (77 mtpa), the U.S. (67 mtpa) and Russia (29.7 mtpa), and in that order. Effectively, these top four countries controlled 67.8% of the LNG export market share in 2021.
Impressively, the U.S. added 22.3-plus mtpa of capacity in 2021, up 50% from just 44.8 mtpa in 2020. The increase in capacity was “driven by increased utilization at five large liquefaction trains that started commercial operations in 2020 (Cameron LNG T2-T3, Corpus Christi T3, Freeport LNG T2-T3).”
“The Atlantic Basin LNG markets grew in importance throughout 2021, with depleted gas storage in Europe and lower-than-average Russian pipeline deliveries driving Europe’s evolution from the market of last resort to a premium LNG buyer,” the IGU report said.
Aspirational Liquefaction Capacity
The present-day geopolitical situation in Russia-Ukraine has boosted the appetite for new liquefaction projects despite headwinds such as access to financing as lenders look to reduce their exposure to fossil fuel investments as they instead eye clean energy projects.
The global decarbonization push will force the LNG industry to seek solutions to reduce emissions in the liquefaction process and across the entire LNG value chain. But “it is also important to have clarity and consistency in the policy environment, which impacts financial risk and liquidity provision,” the IGU said.
Currently, 1,034.5 mtpa of aspirational liquefaction capacity is in the pre-FID stage, and the majority of that capacity is located in the U.S. (387.6 mtpa), Canada (210.4 mtpa) and Russia (136.7 mtpa). Another 52.2 mtpa corresponds to developments in Africa, which if they materialize could see the emergence of a key LNG export region while Australia has 45.5 mtpa of liquefaction capacity currently in the pre-FID stage.
The U.S. accounts for 37.5% of the total aspirational liquefaction capacity in pre-FID stage, followed by Canada (20.3%) and Russia (13.2%).
The growth in U.S. shale gas production in recent years is driving proposed projects such as Venture Global LNG’s Plaquemines LNG (21.6 mtpa) and Driftwood LNG (27.6 mtpa), both located in Louisiana.
“While most operational U.S. LNG projects are brownfield conversion projects, the currently proposed U.S. LNG projects are mainly greenfield projects that consist of multiple small- to mid-scale LNG trains delivered in a phased manner,” the IGU said. “This provides flexibility in securing long-term offtakers and increases competitiveness in project economics through modular construction.”
These developments come as the Middle East, and especially Qatar, looks to drastically increase its liquefaction capacity with the recent FID taken by QatarEnergy related to the North Field East (NFE), the world’s largest LNG project. The project will boost Qatar’s LNG capacity to 110 mtpa from 77 mtpa by 2026 and involves the construction of four new LNG mega-trains with a capacity of 8 mtpa each.

Recommended Reading

CNX, Appalachia Peers Defer Completions as NatGas Prices Languish
2024-04-25 - Henry Hub blues: CNX Resources and other Appalachia producers are slashing production and deferring well completions as natural gas spot prices hover near record lows.
Chevron’s Tengiz Oil Field Operations Start Up in Kazakhstan
2024-04-25 - The final phase of Chevron’s project will produce about 260,000 bbl/d.
Rhino Taps Halliburton for Namibia Well Work
2024-04-24 - Halliburton’s deepwater integrated multi-well construction contract for a block in the Orange Basin starts later this year.

Halliburton’s Low-key M&A Strategy Remains Unchanged
2024-04-23 - Halliburton CEO Jeff Miller says expected organic growth generates more shareholder value than following consolidation trends, such as chief rival SLB’s plans to buy ChampionX.
Deepwater Roundup 2024: Americas
2024-04-23 - The final part of Hart Energy E&P’s Deepwater Roundup focuses on projects coming online in the Americas from 2023 until the end of the decade.