Techniques and hardware for acquiring seismic data have evolved over the last 50 years, while computing advances have revolutionized data processing and interpretation.
“Everything that we’ve done in seismic over the last 100 years has been an evolution. And we do what we do because we can’t do it correctly,” said Sam Gray, who recently retired from his post as chief scientist at CGG. “Everything that we do is kind of an approximation, and we’re getting closer and closer and closer to being able to do exact science.”

Part of that evolution was a change in the source of the sound waves that geoscientists use to map the subsurface.
David Monk, SEG DISC instructor, said the industry moved away from dynamite as a regular source of sound waves in the 1960s, and began to use vibroseis around 1960.
“Onshore, vibroseis is pretty much the universal source,” he said.
Vibroseis uses controlled vibrations to send sound waves into the ground, which are received back at the surface and heavily processed to help map the subsurface features. In the early days, Monk said, it was common to shake the vibrators half a dozen times to ensure a good shot because of the cost of processing each individual shot. Now, it’s common to record lots of shots but without so much effort.
“We’ve replaced that heavy effort,” he said. “Today, the industry is typically just shaking a single vibrator one time, but we’re doing it in the same way, and the number of recording positions has gone up.”
That increase in recording positions has happened both onshore and offshore, with hardware for offshore acquisition via towed streamers becoming more plentiful and longer.
Gray said CGG introduced multistreamer acquisition in the early 1970s with two or three streamers towed behind a seismic acquisition vessel.
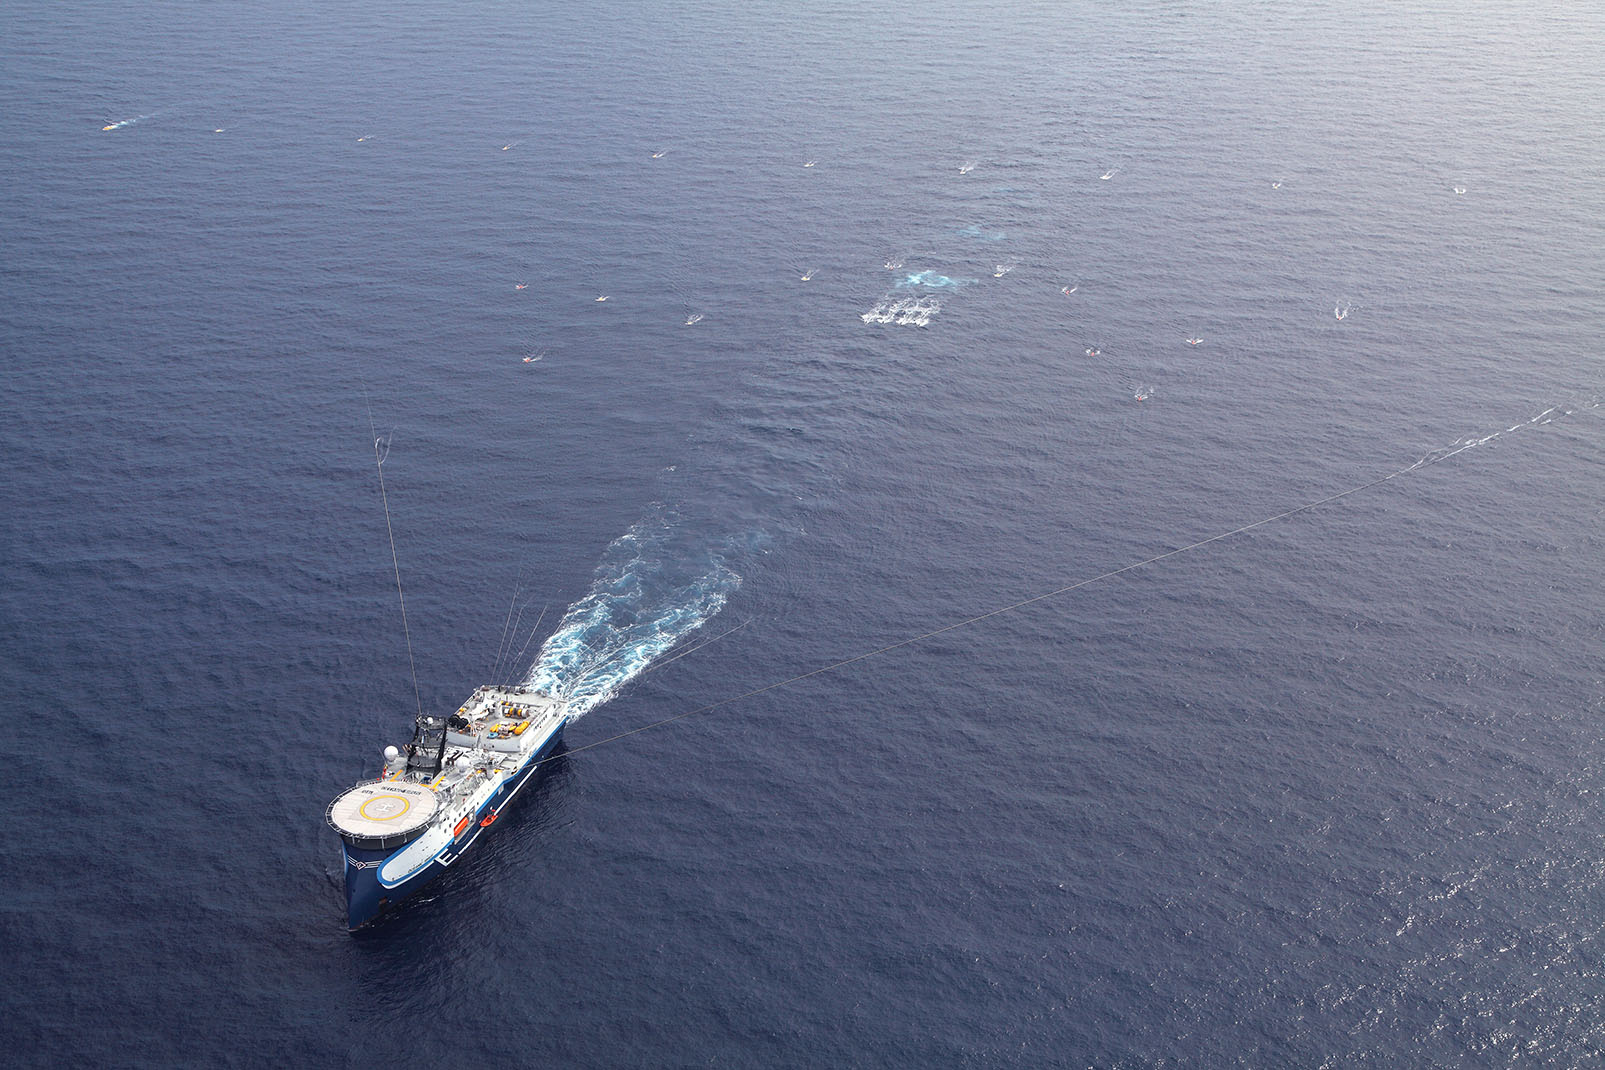
“Gradually, over the next half-century, that evolved into many, many, many streamers with a crossline aperture of kilometers. Very, very wide,” he said.
Adding the longer streamers helped produce better and cleaner data, he said, and imaging was limited by computing power.

Marianne Rauch, second vice president of Society of Exploration Geophysicists and TGS principal technical adviser, said one of the more recent advances in offshore seismic acquisition is the use of ocean bottom nodes (OBNs) for the placement of geophones on the seabed. One draw of OBNs, she said, is that it removes the need to factor in the water column when processing the sound waves.
“It improves the data quality,” she said, and it makes the survey more flexible.
OBNs also improve the quality of 4D, or time-lapse, seismic.
“OBN is fantastic because you can leave your nodes on the seafloor, and you record again after a year or half a year or two years, whatever. And this means that you will get actually one of the most accurate repeat services,” she said. “In the 4D environment, the problem is always seen that the repeat survey, they’re not really the same,” but using OBN removes that concern.
And while seismic acquisition vessels increasingly towed more and longer arrays, the hardware for onshore acquisition shrank in size.
In the 1970s, the industry was using geophones that were heavy and bulky, Gray said.
“Geophones were so heavy that you could only lay out so many in a day, and this limited the size of the seismic survey that you could perform,” he recalled.
Over time, they have been miniaturized.
“A geophone is now on a chip. And, of course, that chip has to be placed into the earth, so it needs a casing,” he said.
“The chip might only be a quarter-of-an-inch wide, and the casing for it is much smaller than geophones were 50 years ago. So, it’s been miniaturized and it’s been made digital. This allowed higher channel counts and higher fold.”
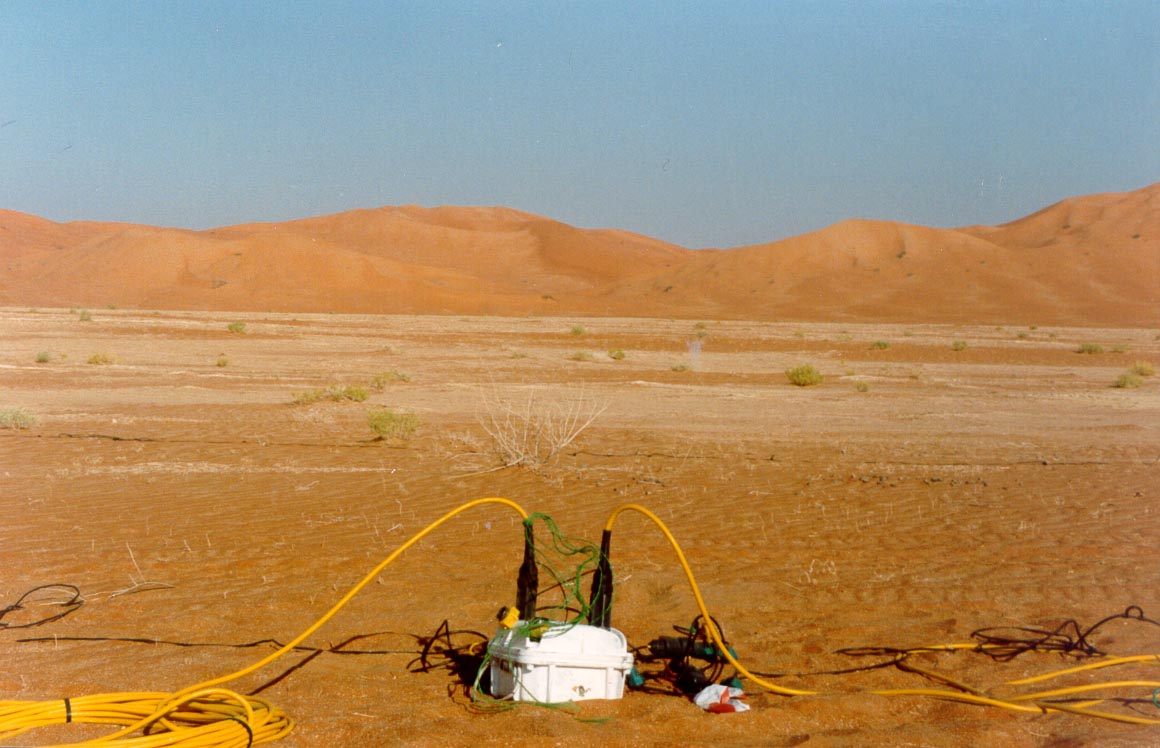
That also enabled seismic acquisition in a variety of settings, including desert, mountain and Arctic areas.
“Mountain areas are still really tough because you need mountain climbers to plant these geophones, so mountainous land acquisition tends to still be sparser than marine and arctic acquisition,” Gray said.
Currently, the geophone chips are recovered, he said, but there is research into sacrificial and biodegradable units that can be left behind.

Data explosion
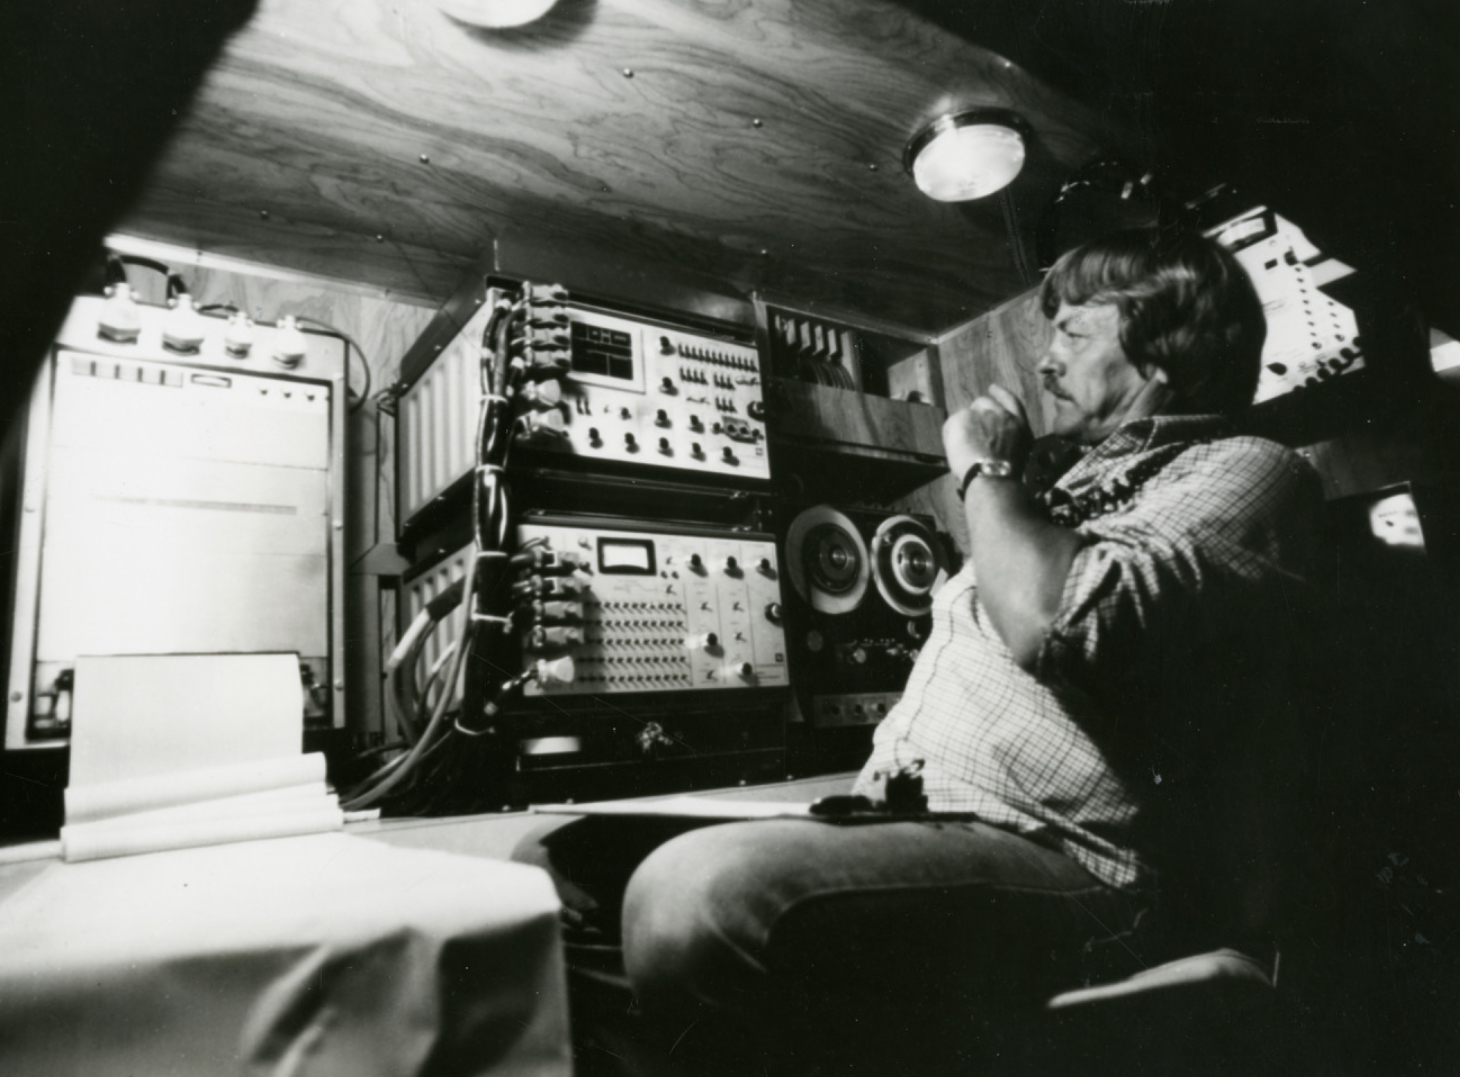
The digital revolution changed how seismic data was processed. Between the 1960s and 1980s, computing shifted from analog to digital, Rauch said, requiring the replacement of analog recording systems with digital systems. It also allowed better storage of data and the ability to better process the data.
“It just became much easier and more effective,” she said.
At the same time, the volumes of data were increasing. In the late ’70s, every recorded shot provided data from under 100 channels, Monk said.
“That has grown exponentially, to the stage where there are crews now recording 200,000 or 300,000 channels for each shot. And by the end of 2024, perhaps 2025, it’ll be a million. So, every time we record, every time we take a shot onshore, we’re going to be recording a million channels of data and a million pieces of data,” he said.
The data itself, he said, hasn’t become more sophisticated or complicated—there is just more of it.
“What do we do with all that data?” he asked.
Gray said the hardware that initially enabled major seismic processing advances was the world’s first supercomputer, the Cray-1. Oil companies were among the first to take advantage of Cray-1’s computing capabilities.
“It just blew people’s minds, which was great. It revolutionized the computation,” he said.
Over the years, Rauch said, high-performance computing became another game-changer. What once had required many hours to process could now be processed in an hour, she said.
“The technology has really, really moved fast and from very slow computers to huge and powerful computers,” she said.
Powerful tools able to process the data, she said, changed the seismic processing world. For example, the use of machine learning has enabled noise reduction and enhanced signals, she said.
Gray noted that access to high-powered computing changed the way the industry migrated data.
“Before we had big computers, migration was possible, but it was torture,” he said.
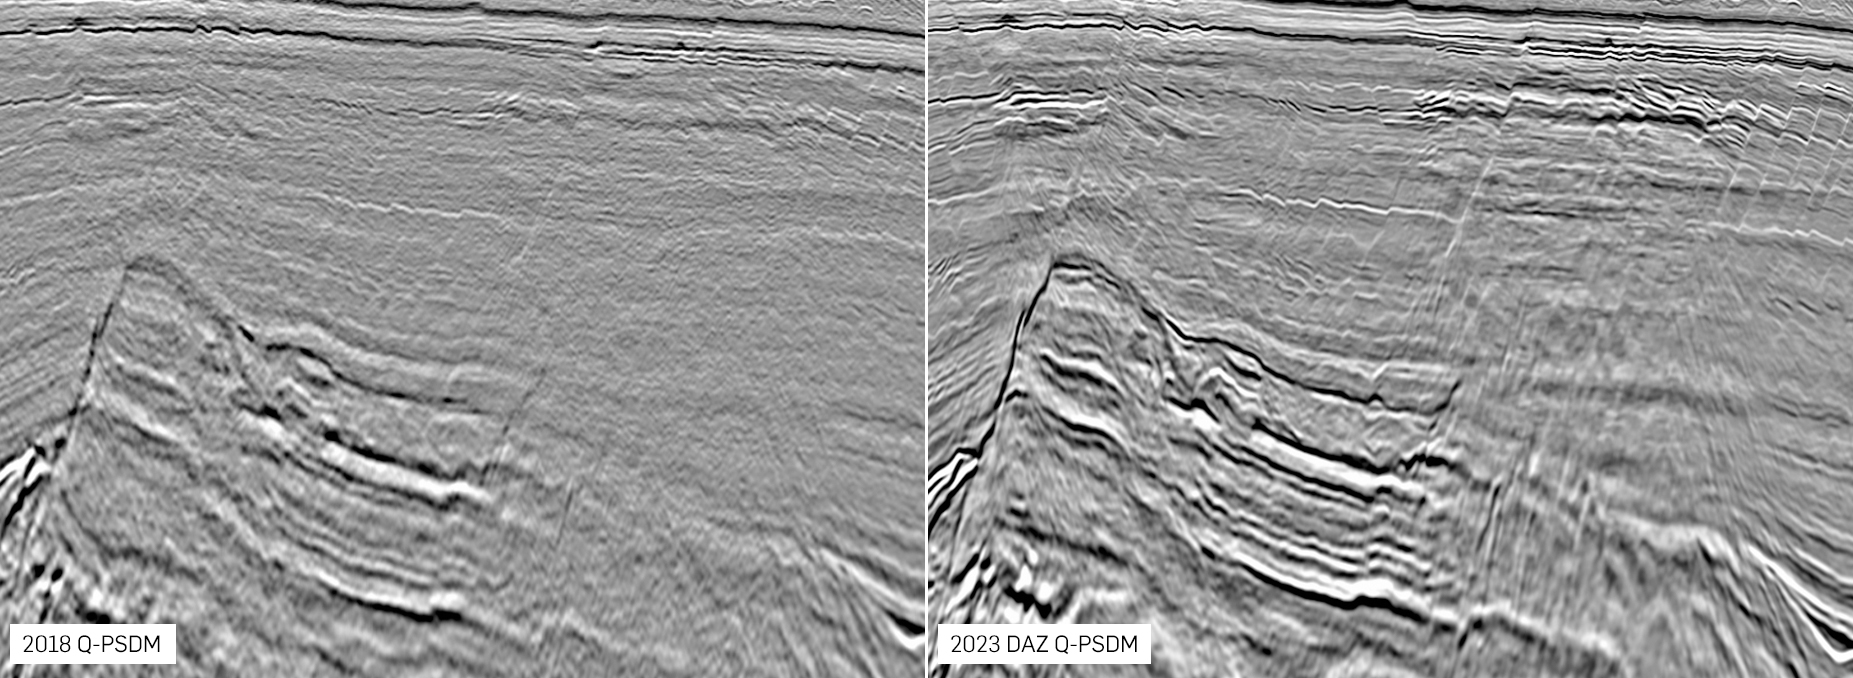
Computational power also enabled full-waveform inversion (FWI), which revolutionized velocity model building for migration. The latest FWI imaging produces better seismic images and next-generation elastic FWI, which uses the full elastic wave equation, has in the last year produced the most reliable lithology estimates to date, he said.
The type of surveys also evolved over the years, moving from 2D to 3D, and then adding in the time component for 4D seismic. 2D surveys yield a vertical cross-section image of the subsurface, while 3D surveys generate a cube, or stacked image of the subsurface.
While the concept for 3D seismic had existed for a while, Rauch said, “it became actually practical” in the 1980s. “3D was really a game-changer because now we could image the world as it more or less really is.”
And visualization rooms, which gained popularity in the early 2000s, took seismic data out of the two-dimensional world of paper and helped geoscientists see the data in space.
Gray said the visualization center made it possible to share enormous data volumes with many people and help them “understand structurally” the data. It was, he said, an alternative to printing the images out on paper.
As sophisticated as the processing has become, the price to process hasn’t changed that much since the early days of computing, Monk said.
“Compute capability has been coming up exponentially and the cost of compute has been coming down,” he said. “The cost to actually process seismic data has stayed almost constant over the entire time. But what we are doing with data is far more complex, and we are doing it on far more data.”

Recommended Reading

Pembina Declares Series of Quarterly Dividends
2024-04-10 - Pembina Pipeline Corp’s board of directors declared quarterly dividends for series 1, 3, 5, 7, 9, 15, 17, 19, 21, 22 and 25.
Kinetik Holdings Enters Agreement to Pay Debt
2024-04-04 - Kinetik Holdings entered an agreement with PNC Bank to pay down outstanding debt.

Apollo Buys Out New Fortress Energy’s 20% Stake in LNG Firm Energos
2024-02-15 - New Fortress Energy will sell its 20% stake in Energos Infrastructure, created by the company and Apollo, but maintain charters with LNG vessels.
Summit Midstream Sells Utica Interests to MPLX for $625MM
2024-03-22 - Summit Midstream is selling Utica assets to MPLX, which include a natural gas and condensate pipeline network and storage.

Hess Midstream Announces 10 Million Share Secondary Offering
2024-02-07 - Global Infrastructure Partners, a Hess Midstream affiliate, will act as the selling shareholder and Hess Midstream will not receive proceeds from the public offering of shares.