Justin Mayorga is the vice president for shale supply chain research at Rystad Energy.

Now well into the second half of 2023, the importance of hydraulic fracturing completion efficiencies remains the focal point for many service companies and operators, as both continue to be impacted by higher associated costs brought on by inflationary and activity-driven effects in 2022.
Against this backdrop, with many basins in the U.S. Lower 48 reaching maturity, some operators lacking premium acreage are now striving to enhance their strategies to overcome observed production degradation. Engineers in the U.S. shale industry have been motivated to explore operational improvements as a result of being confronted with both issues in a low commodity price environment. By doing so, operators are constantly pushing boundaries higher as lateral lengths and frac intensities continue to increase.
But it doesn’t stop there—operators are now finding new means of further lowering their proppant and fuel cost with the adoption of next-generation fleets that are high in demand. We’ll discuss these topics in depth while providing basin level examples.
Despite growing calls for energy transition, Rystad Energy firmly believes that U.S. shale production remains a crucial player in meeting global demand for hydrocarbons.
We’ll first investigate completion efficiencies and analyze improvements brought on by the first half of 2023. As service pricing continues to be elevated, frac efficiencies remain a key method to offset some of these increases.
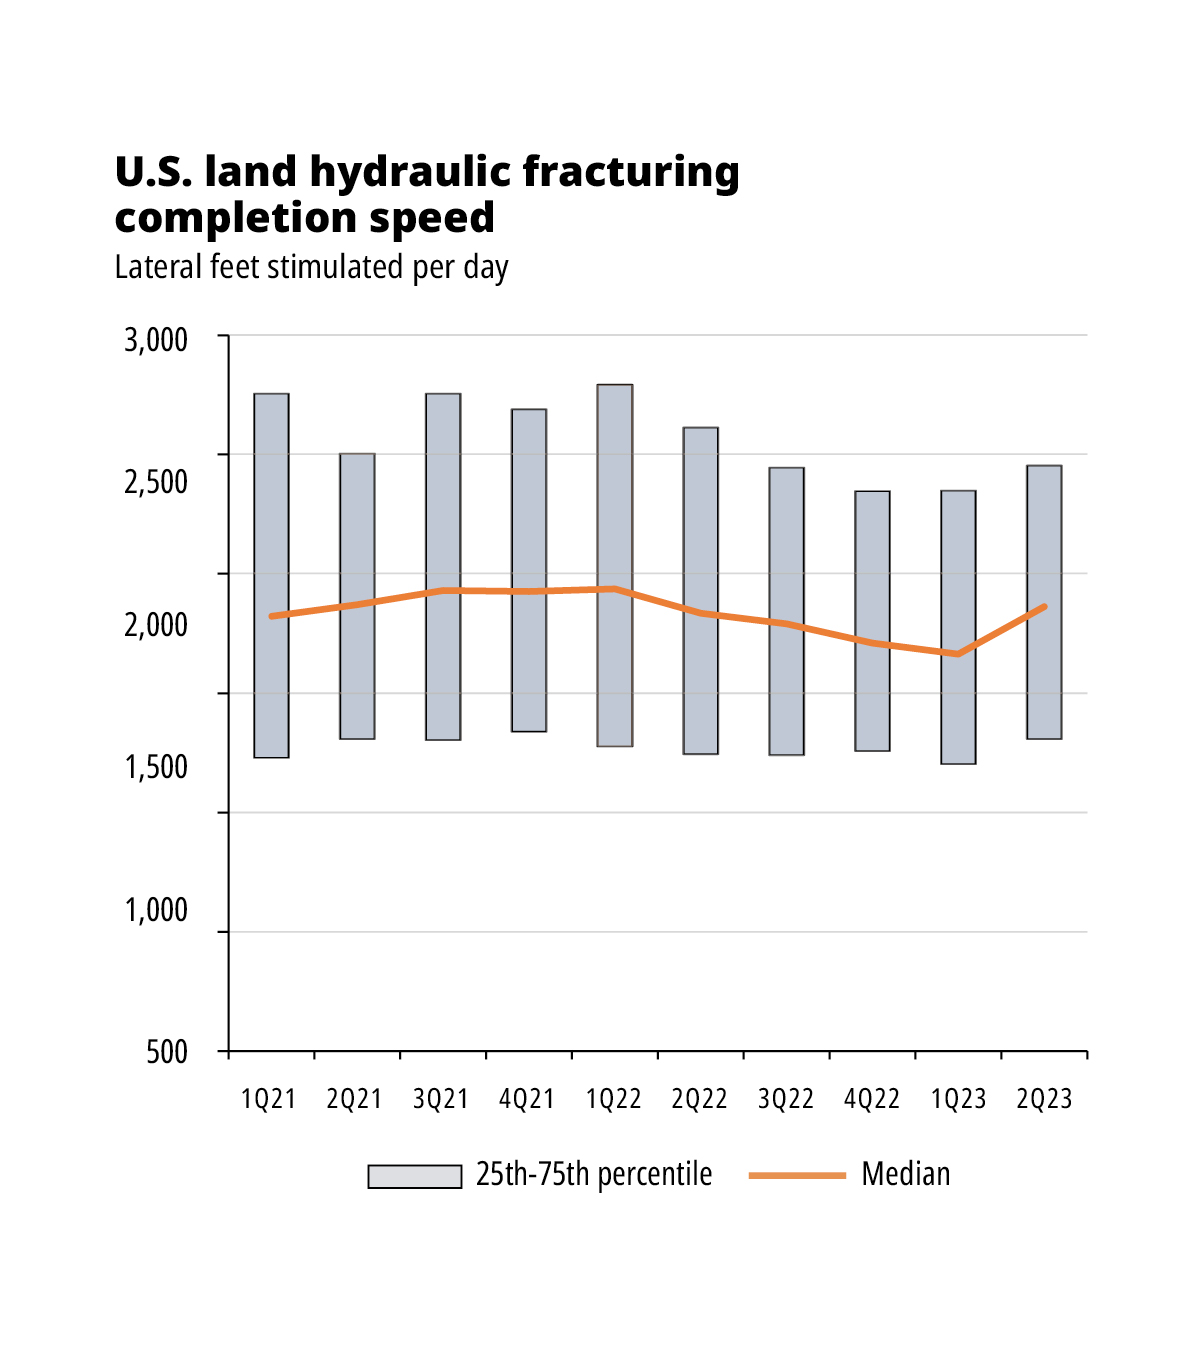
From an aggregated standpoint, stimulated lateral feet per day have decreased since first-quarter 2022 after hitting a high in fourth-quarter 2021. This seems counter intuitive to the story of increasing efficiencies, and this is why it’s important to analyze other associated metrics to paint the full picture.
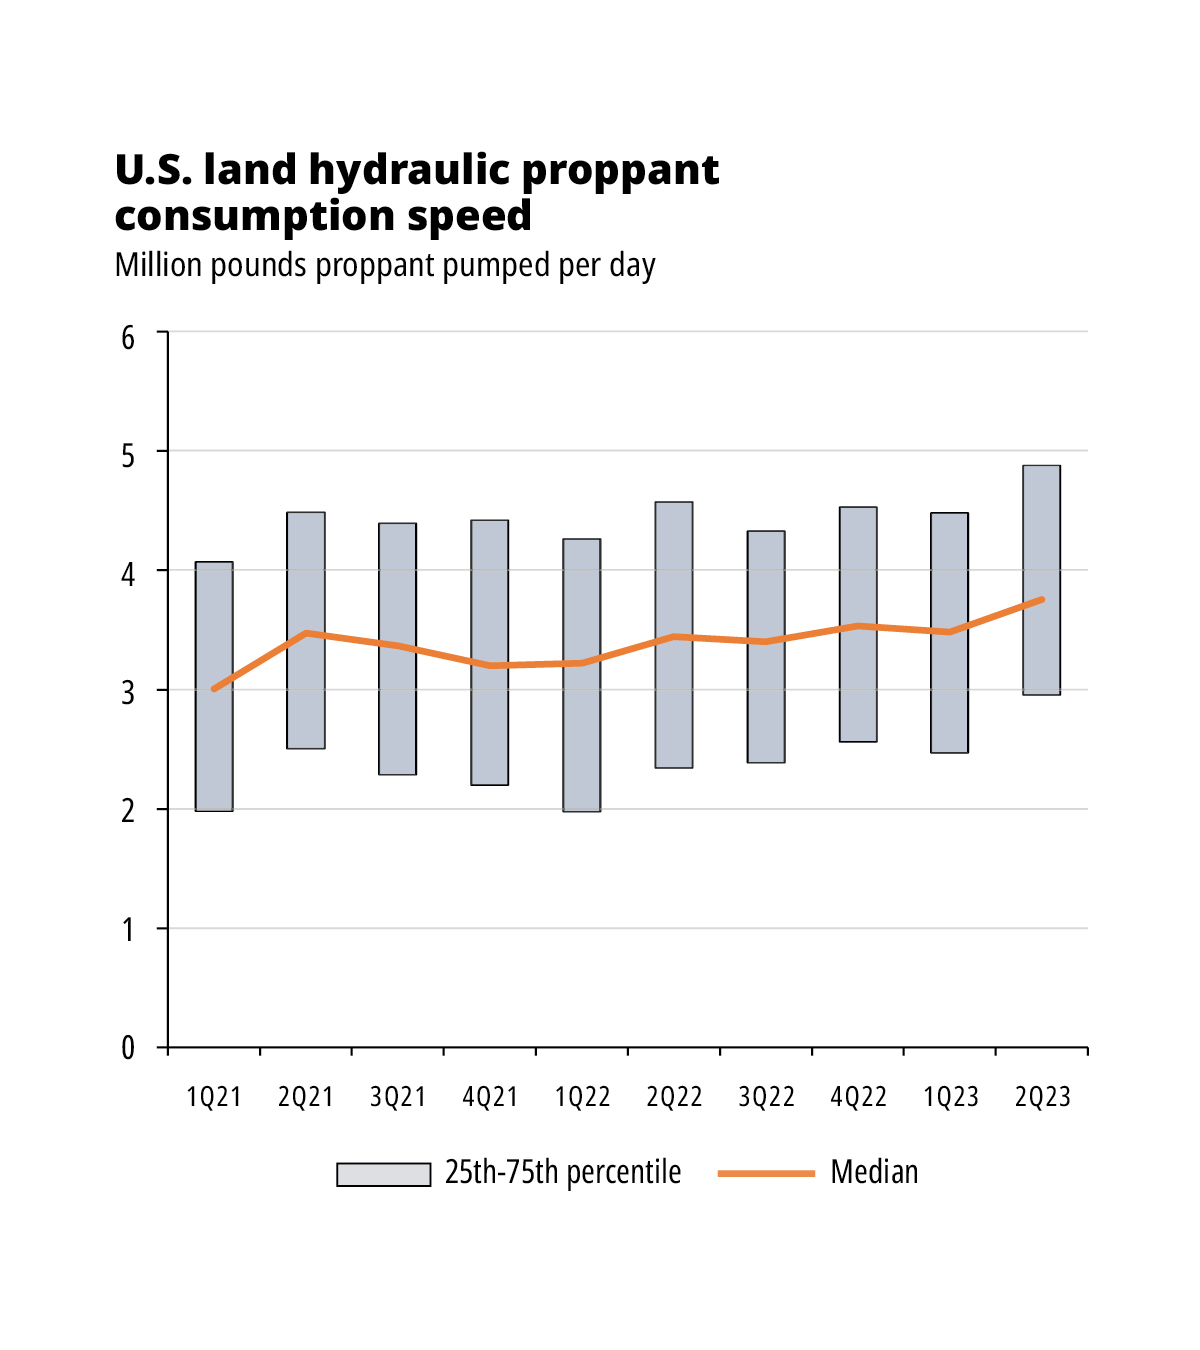
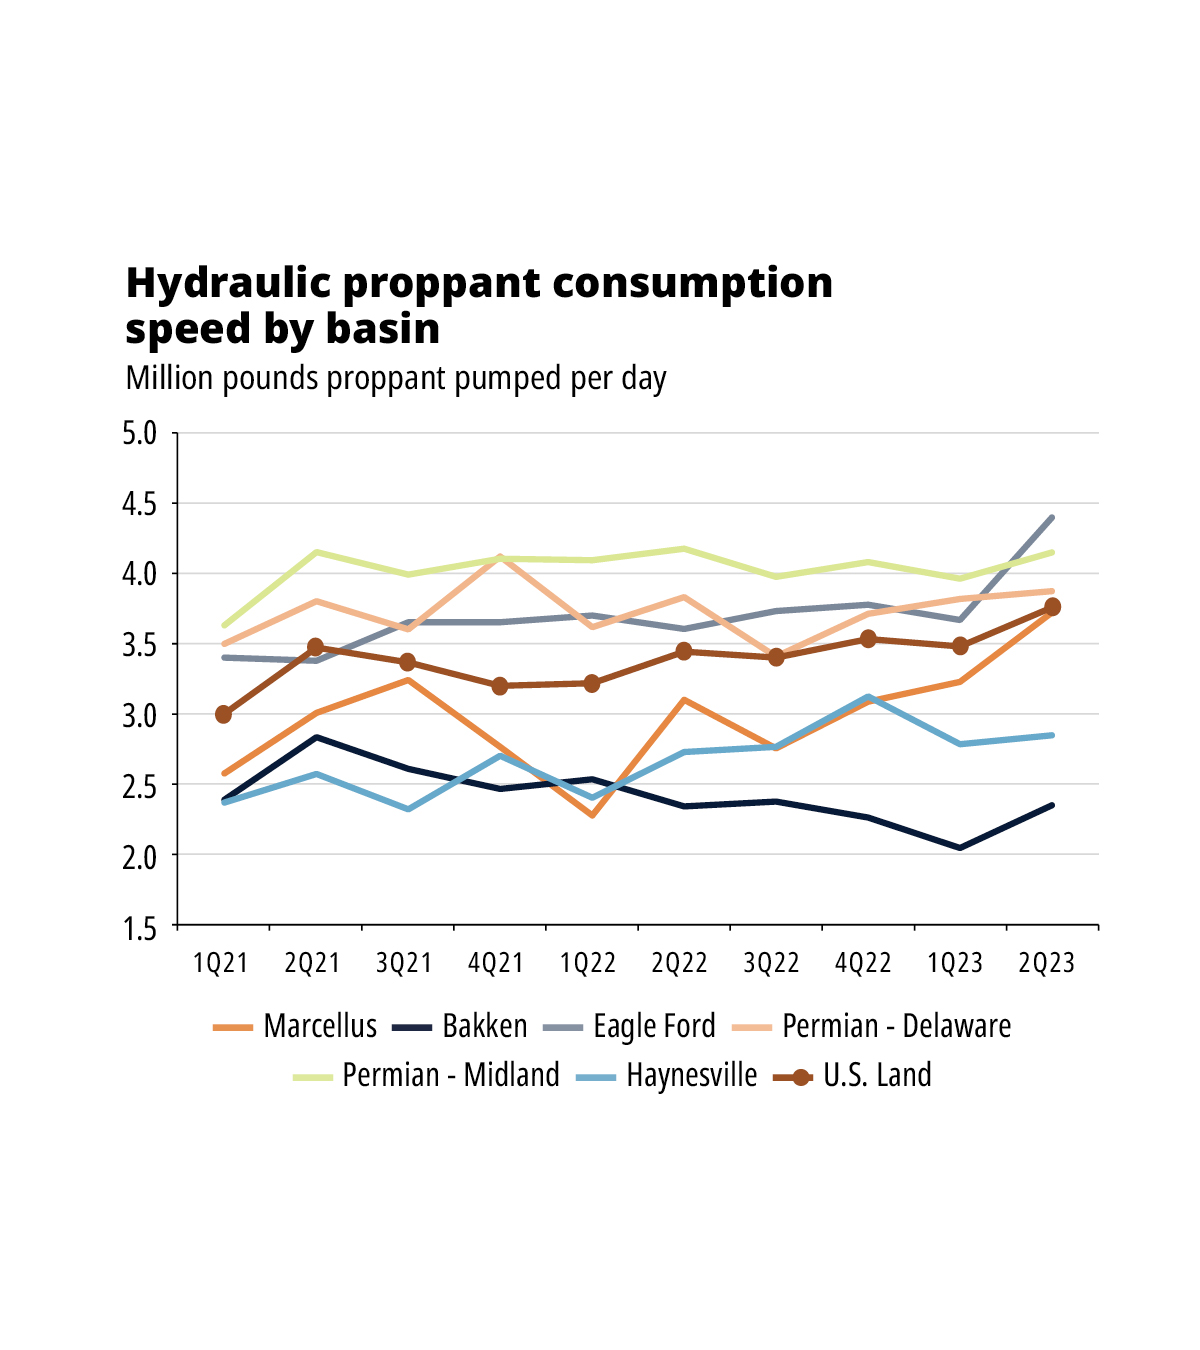
Lateral feet per day have been trending down; however, proppant pumped per day has continued to increase since first-quarter 2022. This essentially means that, despite completing wells at a slightly slower pace, operators have been able to displace larger amounts of proppant, which has resulted in an increase of 9% in proppant pumped per day compared to the prior year. Trends like this are observed in nearly every basin, where the Delaware Basin and Eagle Ford lead all others as proppant intensities continue to trend up despite being somewhat static for several quarters.
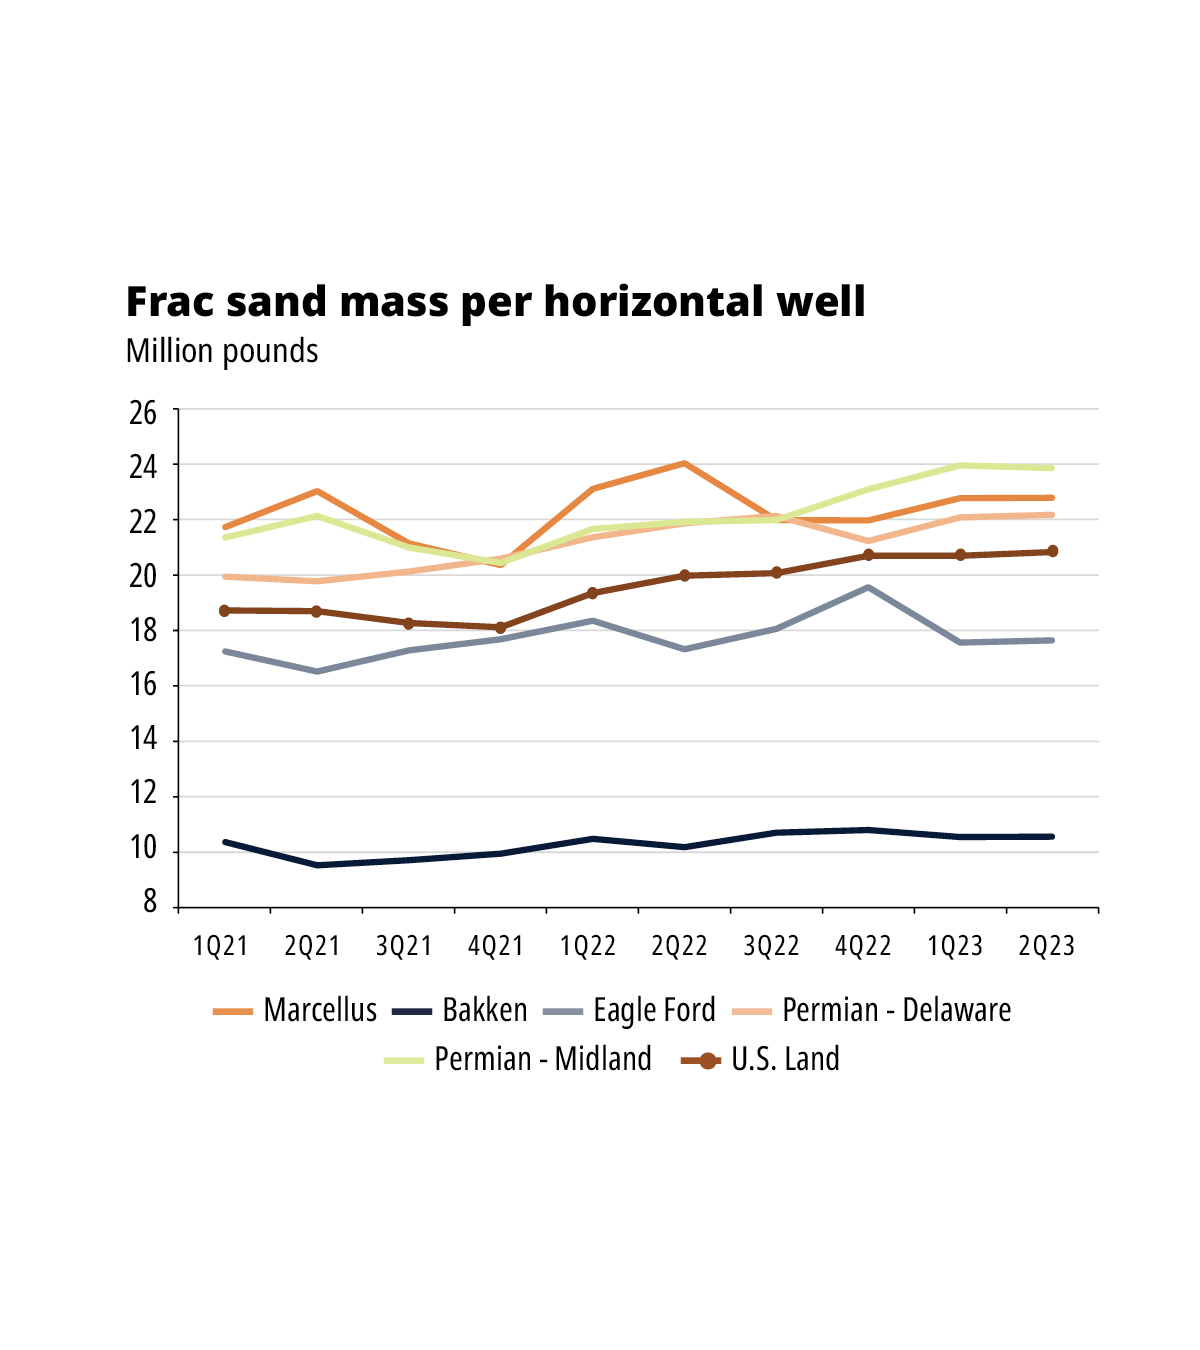
Because of this, the U.S. average proppant per well has continued to tick up as lateral lengths extend in various regions. For example, the average proppant mass per well within the Midland Basin has increased close to 24 million pounds per well, which was as low as 22 million pounds a year prior.
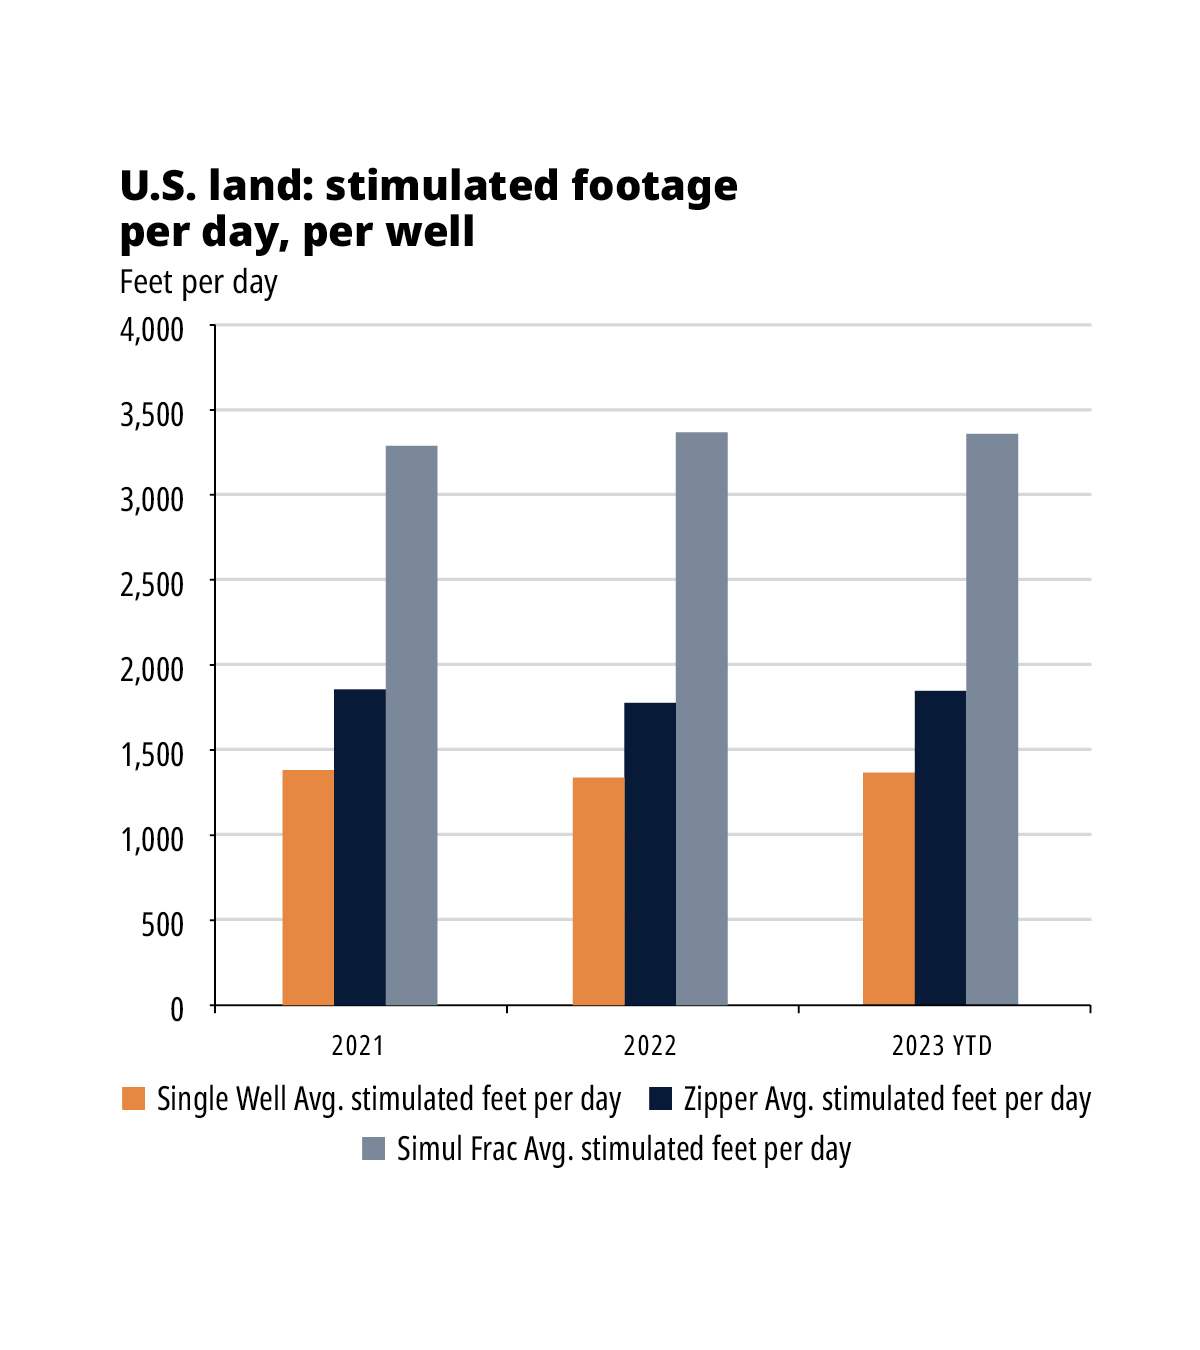
A handful of factors have allowed these types of gains, including, but not limited to, the reduction in time between well swaps, better maintenance programs and newer equipment. However, the main factor remains the adoption of simul-frac (also known as a double barrel and super zippers) activity. Many operators have been able to achieve superior metrics with this type of completion style.
Simul-frac refers to stimulating multiple wells at once with a single frac spread. For example, if you have a four-well pad, instead of fracturing one well while the wireline is perforating another, simul-fracturing will stimulate two wells while two wireline crews perforate another two. Some operators have taken this a step further and are now attempting to stimulate three wells at once, pushing the boundaries for completion speeds.
To date, Rystad Energy’s data is suggesting 2023 simul-fracturing has led to an increase of approximately 84% compared to traditional zipper fracturing operations. It comes as no surprise that the Permian Basin is the key region where simul-fracturing operation adoption is the largest; however, operators in other basins have engaged in this activity in 2023, including in the Eagle Ford and Denver-Julesburg Basin. It is important to note that this technique will not work for all. The primary users of logistical support and execution for large-scale projects are predominantly the larger public operators. To date, Rystad Energy estimates the adoption of simul-frac remains around 11% of all wells stimulated in second-quarter 2023.
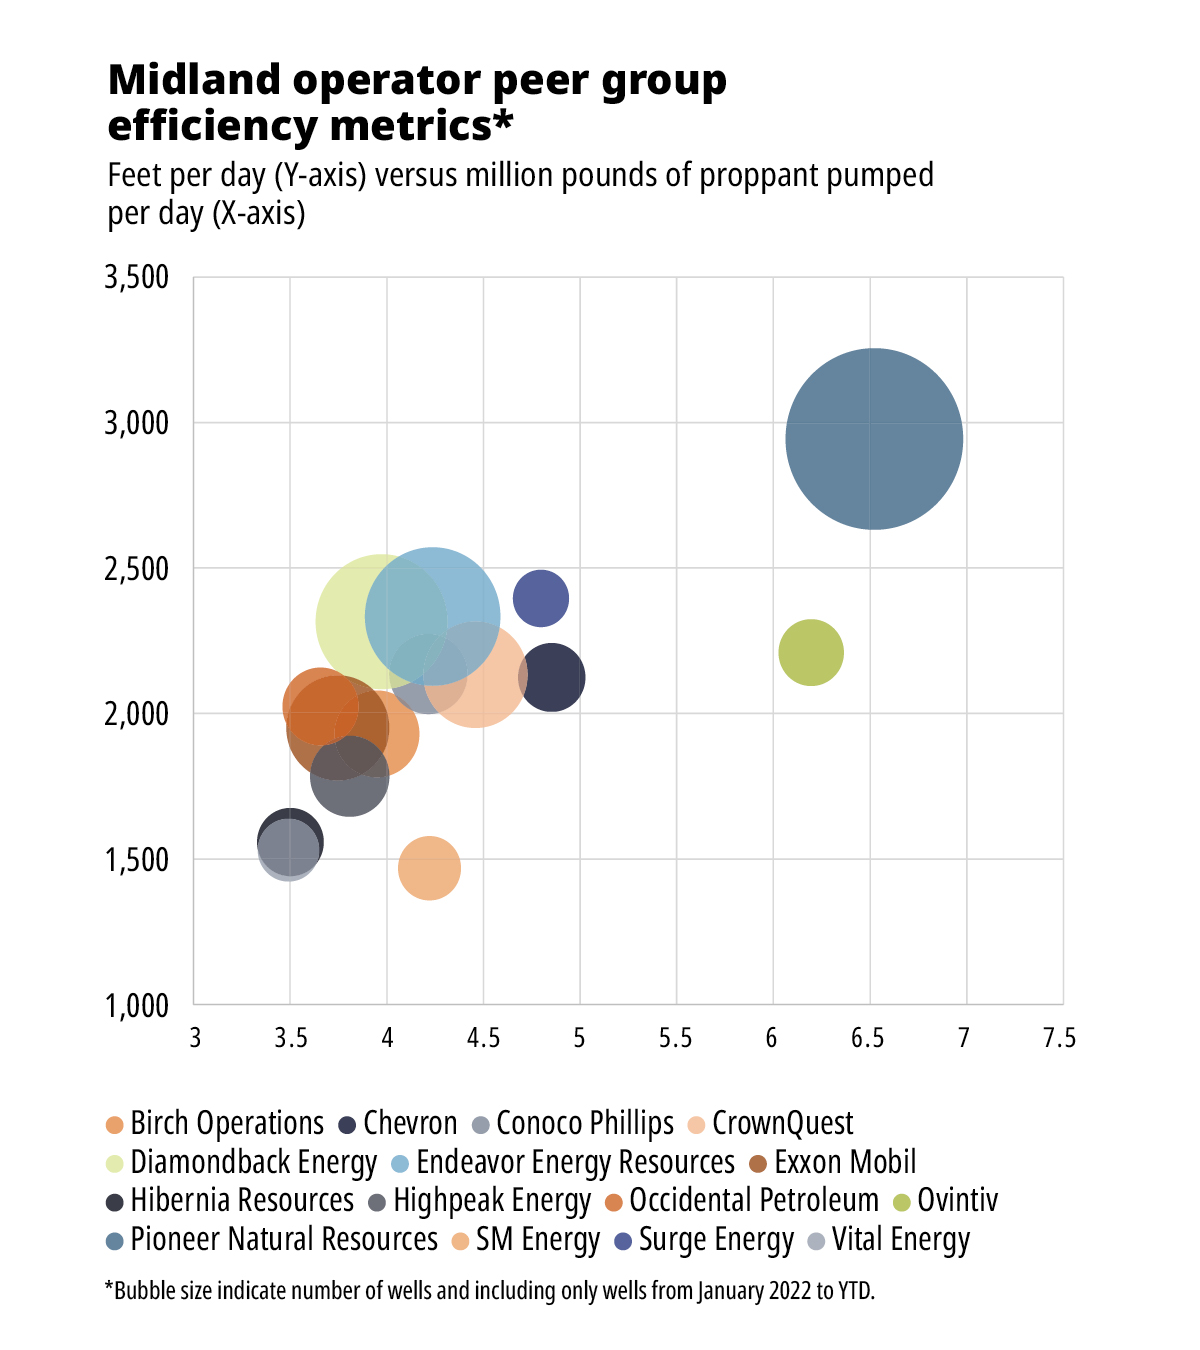
It’s becoming rather evident which operators are performing these types of operations when analyzing the top peer group within each basin. For example, taking the leading peer group based on the number of wells completed in 2023 within the Midland Basin, it’s quite obvious that Pioneer Natural Resources and Ovintiv lead the pack; both are heavily engaged in these types of operations. These two operators have pushed over 6 million pounds or 3,000 short tons of proppant per day.
Among the peer group, consisting of both public majors and private operators, none have reached a daily production level of 5 million pounds or 2,500 short tons of proppant. At this rate, both Ovintiv and Pioneer, due to their heavy simul-frac activity, are seeing at least a 20% uplift compared to others within the peer group.
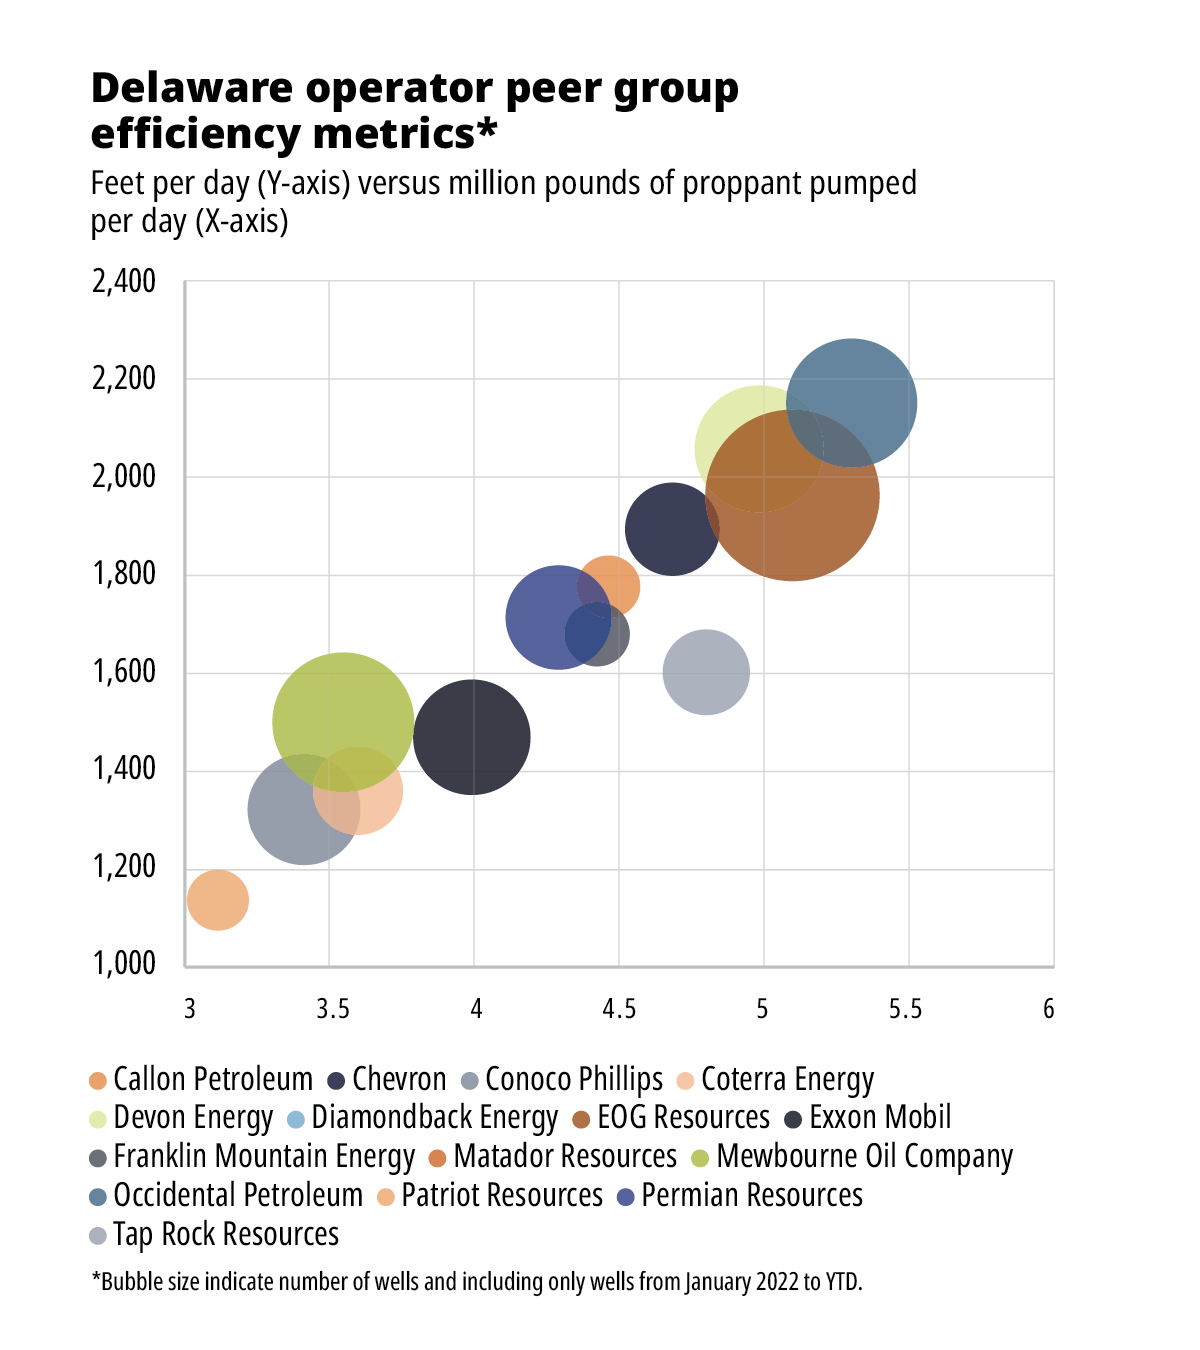
The Delaware Basin yields similar results with the top operators who heavily conduct these types of operations, such as EOG Resources and Occidental Petroleum, who remain the leaders in these metrics. This is important again because it comes down to cost and increasing the rate of return per well. During this period of high service pricing, despite premiums for additional horsepower for these types of operations, there’s a notable amount of cost savings, depending on the contract agreed upon.
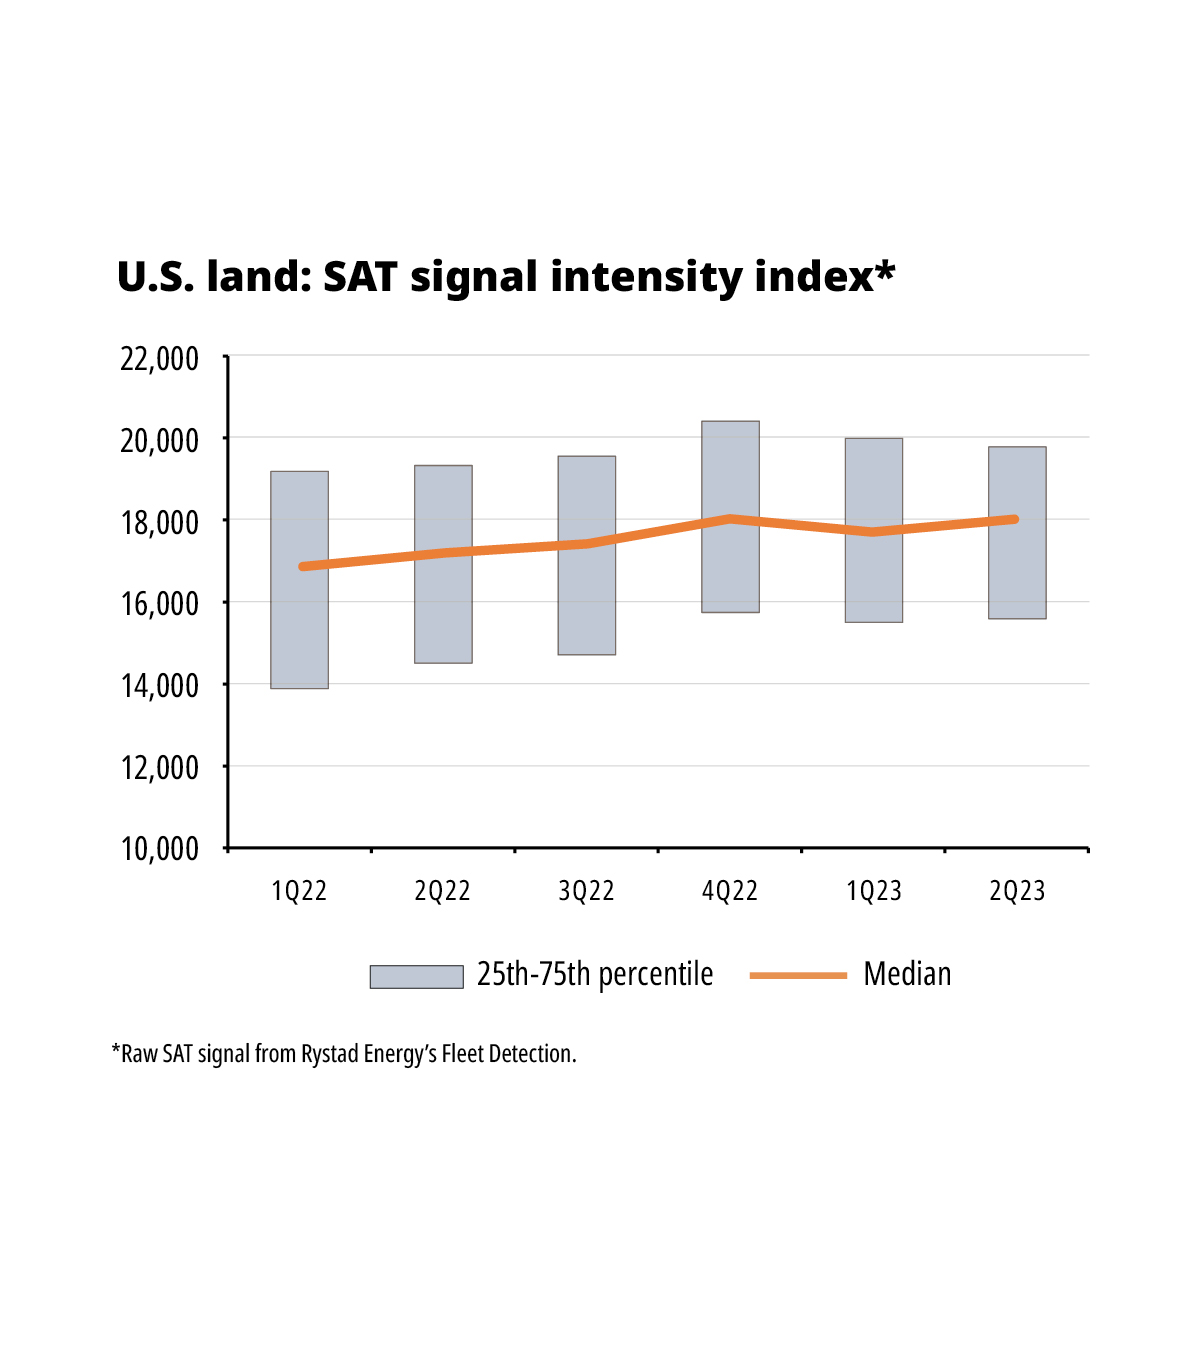
Simul-frac, however, is not the only indicator of how efficiencies have been increasing as traditional zipper frac operations continue to improve. This is tied to fleet size. Pressure pumpers continue to iterate that fleet size is increasing year over year, which is true to some extent. With extra pumps at hand, not only can faster rates be achieved, but redundancy for pump maintenance can also be increased.
This trend has not gone unnoticed by Rystad Energy’s satellite detection, which has observed a slow increase in signal intensity. Since the pad coordinates are known, using satellites to detect hydraulic fracturing activity allows for accurate near real-time indications of when a crew arrives on location, thus eliminating reporting lag associated with frac focus filings.
Rystad Energy currently views the average fleet size to be around 55,000-60,000 hydraulic horsepower (hhp), depending on the location and the customer needs. Of course, this varies from basin to basin and the type of completion.
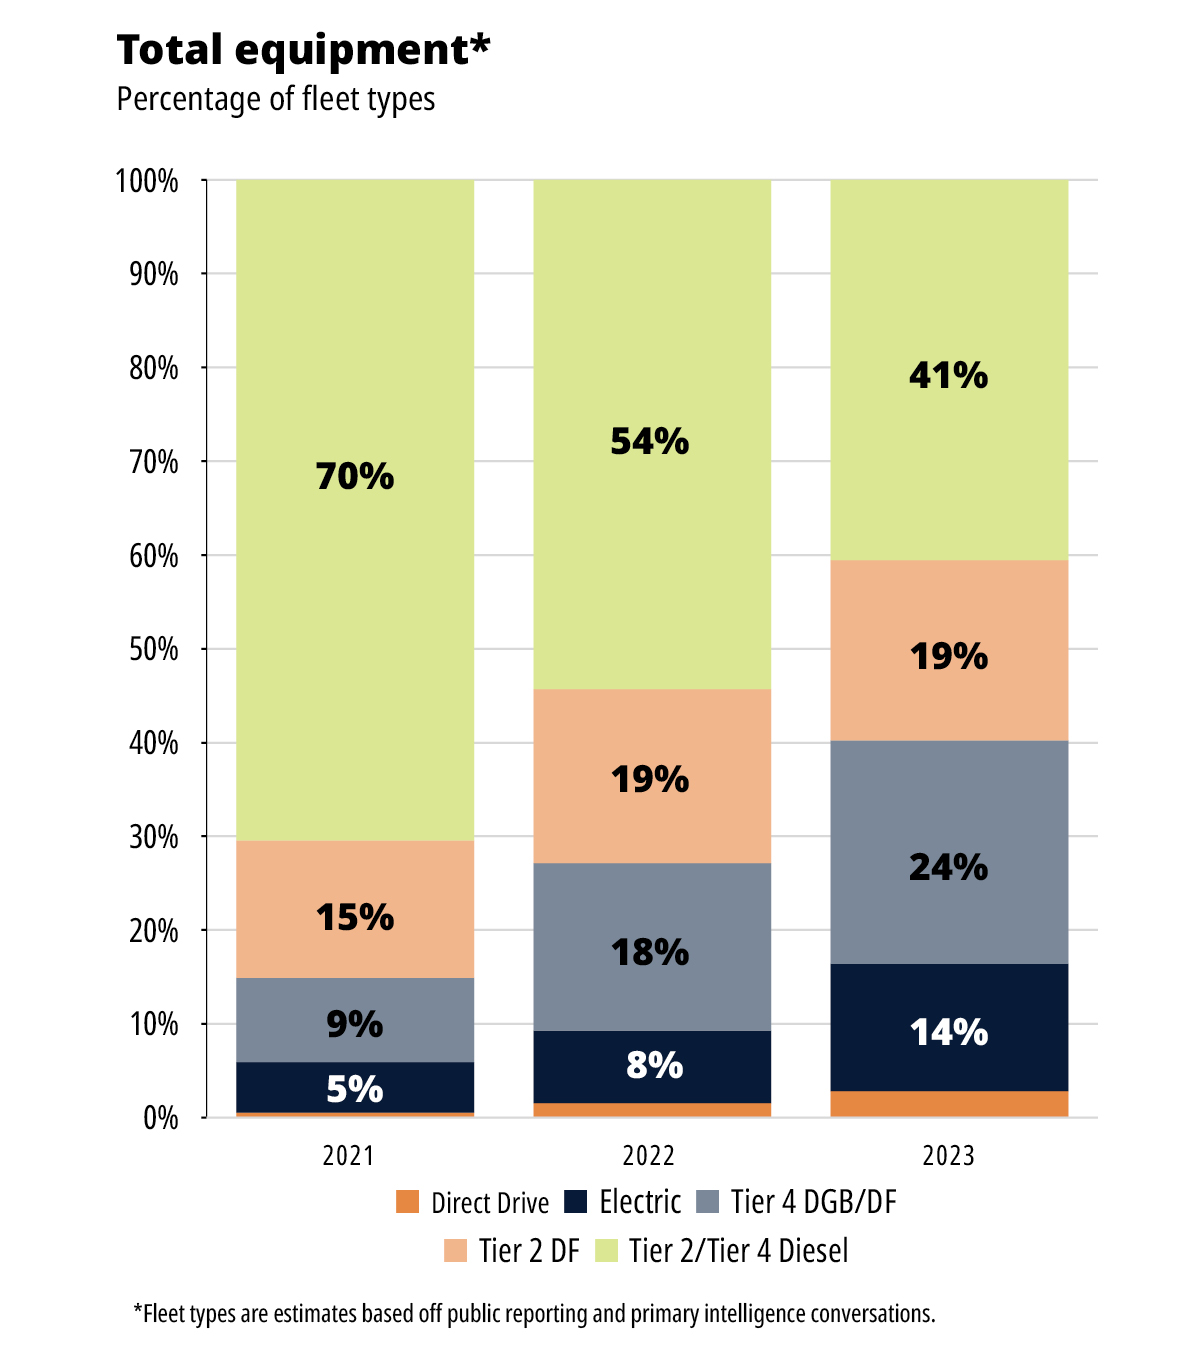
When it comes to technology, equipment continues to be the main advancement on the hydraulic fracturing front. Next-generation equipment or natural gas-capable fleets provide a strong value proposition as fuel displacement remains one of the most effective methods of well cost savings. In terms of emissions, these fleets have a positive impact as they use a cleaner fuel source.
This leads to a reduction in their overall emission profile compared to conventional diesel fleets, provided they are optimized. The adoption of electric fleets remains high, with companies like Evolution Well Services leading the way alongside established oil field giants like Halliburton and ProFrac.
This trend is particularly evident as pure electric providers continue to show confidence in the sector. These electric pumps provide a cleaner method of performing stimulation operations and leave a smaller footprint due to the increased hhp associated with these pumps. A standard electric configuration holds approximately 5,000-7,000 hhp compared to 2,500 hhp on a legacy diesel pump.
Electric pumps boast more horsepower than legacy diesel equipment, but they also have the ability to burn field gas, eliminating the need for CNG, further reducing fuel cost for the end user. There are still various configurations on the electric power generation side, with some pressure pumpers opting for an agnostic approach. This typically involves a large modular turbine (34 MW) or natural gas reciprocal generator (genset); although, gensets are becoming more popular due to their reliability and ease of maintenance.
Other solutions have also been developed, including 100% natural gas fleet types that will be rolled out through 2023. Once such example is Liberty’s DigiPrime fleet. While this remains in the early phases of deployment, the configuration eliminates the need for an offset power generation solution. It does this by having a natural gas engine mounted directly on the pump, packaging an all-in-one solution.
Rystad Energy currently refers to this type of pump as a mechanical direct drive. If this is successful, this could be a major disruptor in the next-generation fleet sector as it reduces the overall cost by eliminating offset power generation, which is a heavy barrier to entry for many. For example, a larger modular turbine could cost higher than $20 million per unit, while gensets could be as high as $10 million. BJ Energy Solutions has had its version of turbine direct drive units for some time now, which have been successful in harsh pumping environments such as the Haynesville.
While the U.S. shale patch continues to be dominated by diesel fleets, this is likely to shift toward natural gas fleets in the near future. Not only are newbuilds continuing to roll out the 100% natural gas side, but Tier 4 dynamic gas blending (DGB) or dual-fuel (DF) upgrades remain at a strong pace, with Caterpillar as a leader in the conversion sector. These types of pump configurations can achieve up to 85% diesel displacement if optimized. Several reports suggest that the accuracy rate in field conditions is around 60%.
Nonetheless, Caterpillar is continuously working on developing new updates to enhance its performance. Because of the lower capital cost to upgrade, nearly every premier pressure pumper has now upgraded or has plans to upgrade legacy diesel fleets to be DGB or DF capable, with players such as NexTier leading others in this type of adoption. Due to both fleet types, Rystad Energy continues to estimate that natural gas fleets will soon take the market share by the end of 2023.
In the U.S. shale space, companies are still prioritizing cost reduction and speed when it comes to materials used for stimulations through 2023. While there hasn’t been much change in this regard, the adoption of wet sand is becoming increasingly popular, particularly within the Permian Basin.
Proppant selection has always been a quick-moving topic, as conductivity used to be the key factor in performance and selection in recent years. There has been a significant increase in the number of in-basin sand mines. These mines can be found in every basin except for the Northeast.
It’s worth noting that even minimal conductivity is better than no conductivity at all. Because of this, operators are now sourcing proppant near their pads by constructing mobile mini-mines, which have been adopted throughout the Permian and Eagle Ford led by Hi-Crush. Again, it is important to note that these are wet sand mines, or rather, damp sand since the water content remains at approximately 5%. As this adoption continues to increase, even traditional dry sand mine plants are offering the service as it’s not only a means to reduce the end users’ cost, but it also has a strong ESG initiative by eliminating the drying process, which requires mass amounts of energy. This has led to in-basin sand mine adoption throughout the various basins.
The U.S. shale industry has continued to prove that it is willing to adapt quickly and do what is needed to improve its overall operations. Every year, we observe more and more innovations as the industry continues to shift and evolve, whether due to inflationary effects or the push toward ESG. As the industry continues to evolve, Rystad Energy will continue to monitor and benchmark as the fight for the top position continues to be an ongoing competition between operators and service companies alike.
Recommended Reading

Spate of New Contracts Boosts TechnipFMC's Subsea Profits
2024-04-30 - TechnipFMC's operational profits are growing as the company heightened its focus on “quality” subsea orders, which earned $2.4 billion for the first quarter.

Message in a Bottle: Tracing Production from Zone to Wellhead
2024-04-30 - New tracers by RESMAN Energy Technology enable measurement while a well is still producing.

Defeating the ‘Four Horsemen’ of Flow Assurance
2024-04-18 - Service companies combine processes and techniques to mitigate the impact of paraffin, asphaltenes, hydrates and scale on production—and keep the cash flowing.

Tech Trends: AI Increasing Data Center Demand for Energy
2024-04-16 - In this month’s Tech Trends, new technologies equipped with artificial intelligence take the forefront, as they assist with safety and seismic fault detection. Also, independent contractor Stena Drilling begins upgrades for their Evolution drillship.
AVEVA: Immersive Tech, Augmented Reality and What’s New in the Cloud
2024-04-15 - Rob McGreevy, AVEVA’s chief product officer, talks about technology advancements that give employees on the job training without any of the risks.