(Source: Hart Energy)
The toolbox for downhole inspection has historically been limited to a small handful of technologies. Calipers, magnetic-based tools, single-transducer acoustic tools and optical systems have seen limited technological advancement over the past three decades. Existing tools available to operators, except for optical systems, suffer from a severe lack of resolution; therefore, they are unsuitable for making precise measurements. Optical-based systems, although having high resolution, have issues when wellbore fluids are not clear. Optical systems also make inference-based measurements, as the information collected is qualitative rather than quantitative; dimensions may be affected by optical distortions from fish-eyes lens effects, perspective distortion and parallax lens effects.
This gap has driven the development of a new high-resolution acoustic-based imaging technology capable of detailed high-fidelity imaging through opaque fluid mediums. High-resolution acoustic imaging allows operators to capture full circumferential, dimensionally accurate images of their entire wellbores in a single pass—regardless of fluid clarity. Key applications and use cases include casing erosion, internal and external corrosion, sand and scale buildup, cracks, casing collapse, flow control device evaluation and wellbore obstructions. Another common application has been its use in measuring and evaluating perforation erosion in horizontal wells, due to the high-resolution nature of the data.
Technology overview
Advanced acoustic imaging technology uses a solid-state imaging head with up to 512 transducers to form a cylindrical or conical array, which then performs a 360-degree continuous scan. This was no easy feat. Creating a tool capable of capturing, processing and storing submillimetric resolution volumetric data means dealing with data rates more than 41 gigabits per second. A sophisticated downhole electronics package was developed that could withstand the harsh downhole environment of more than 300 F and 15,000 psi. The combination of a solid-state imaging array and high-speed electronics package also allows many advanced and proprietary imaging modes. These imaging modes are used to achieve even higher resolution and provide precise control over image quality—capabilities never seen before in downhole acoustic imaging.
To capture high-resolution images, groups of transducers called sub-arrays work in teams to send out pressure pulses that constructively interfere to allow both beam steering and precise focal distances. Both of these are dynamically controlled by software and change the timing of pulses within each sub-array. These two capabilities form the foundational building blocks for more advanced imaging techniques.
What this means in practice is that the acoustic signal will remain intact regardless of the feature orientation and shape, or if the tool is decentralized. From these high-fidelity acoustic signals, it is then possible to make submillimetric measurements and 3D reconstructions of the inside and outer diameters and of the casing.
Field observations
The technology can be deployed in vertical or horizontal wells and is capable of scanning entire wells in excess of 30,000 ft in a continuous scan. The technology has proven successful in imaging and measuring perforation erosion through any wellbore fluid in wells across North America.
More than 45,000 perforations have been imaged to date using the tool. From this extensive dataset, several interesting findings have started to emerge. Although these general trends and observations have helped operators understand nuances within their hydraulic fracturing programs, a detailed analysis of an individual well or pad is required to optimize a well’s design fully. This is due to the differences in behavior seen basin to basin, pad to pad and well to well. The greatest improvements have been seen when an operator isolates and optimizes a small number of parameters on each successive well.
The first observations noted from the dataset were the large differences in perforation erosion, and therefore proppant placement, in stages near the heel compared to stages near the toe of a well. Within the hundreds of stages imaged, it was common to see drastic changes in heel-toe bias and perforation growth from one section of the well to another. What this suggests is that well-location specific optimizations may be required to achieve equal distribution of proppant within a stage and that conducting partial wellbore scans is not conducive to fully understanding what optimizations are needed. One-size-fits-all designs across a wellbore did not appear to offer an optimal solution to achieve unbiased erosional patterns across all stages.
Another interesting finding was that highly eroded perforations, representing the top 0.5% in growth, were seemingly randomly distributed throughout wells. These outlier perforations have been found across numerous geographical regions, casing types and plug-and-perf completions designs. This phenomenon may be representative of lower fracture pressure rock or a lack of good quality cement. However, more research is required to fully understand and predict this behavior.
An unexpected finding was the pervasiveness of casing breaches located at depths where plugs were set. About 50% of the wells inspected to date had at least one full casing breach, with an even higher percentage of wells exhibiting significant wall loss at these locations. The mechanisms that are causing these casing breaches appear to be an erosional path that forms past a plug. However, further research and analysis are required to confirm this.
As expected, when a casing breach is present, perforation growth is negatively impacted in nearby areas. Perforation growth was measured to be up to 12% less in stages where a casing breach at plug depth was present.
Measurement capabilities and evolution
One of the challenges with such a high-resolution tool is the sheer volume of data captured. Datasets are several orders of magnitude larger than legacy tools. Although the tool is capable of capturing, processing and storing terabytes of data, unpackaging and analyzing the dataset can be a time-consuming task.
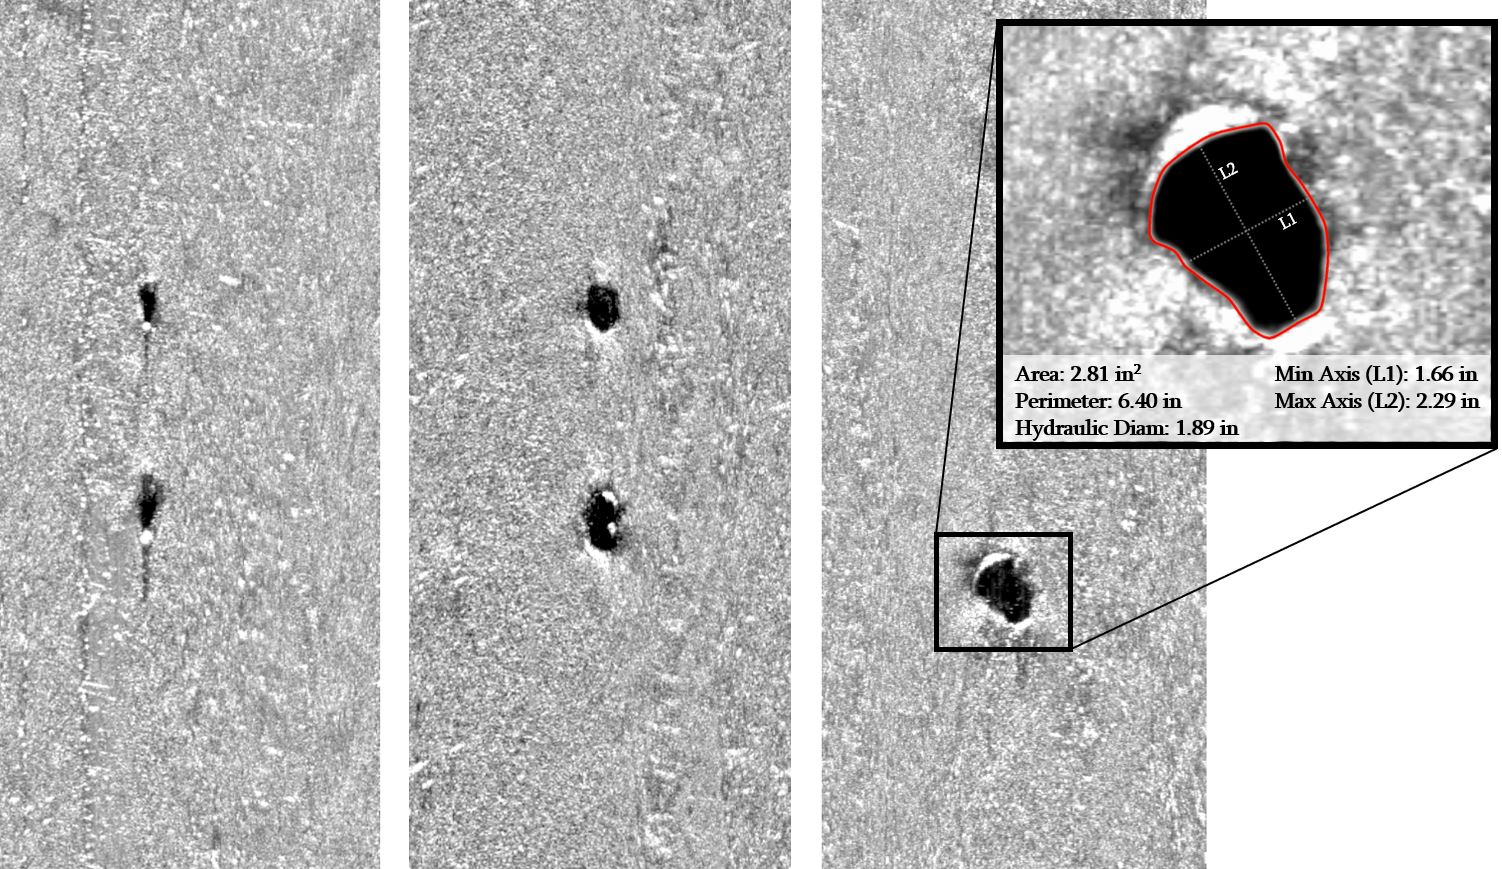
Historically, operators have been supplied with diameter measurements of every perforation, but they were only images and area measurements for a portion of each well. Analyzing, measuring and rendering the datasets had previously involved extensive man-hours from analysts. This manual approach limited the ability to provide full area measurements of every perforation due to the sheer volume of data analysis time required to do so. This is where automated analysis driven by sophisticated computational algorithms has changed everything. A significant amount of R&D has been put into automating the data processing, allowing area measurements of each individual perforation along with an image of its shape to be provided to customers. Now operators can receive a detailed image and measurement of each perforation, including its hydraulic equivalent diameter, entry and exit area, perimeter and dual-axis measurements.
Recommended Reading

Aramco Reports Second Highest Net Income for 2023
2024-03-15 - The year-on-year decline was due to lower crude oil prices and volumes sold and lower refining and chemicals margins.
Kissler: OPEC+ Likely to Buoy Crude Prices—At Least Somewhat
2024-03-18 - By keeping its voluntary production cuts, OPEC+ is sending a clear signal that oil prices need to be sustainable for both producers and consumers.

Northern Oil and Gas Ups Dividend 18%, Updates Hedging
2024-02-09 - Northern Oil and Gas, which recently closed acquisitions in the Utica Shale and Delaware Basin, announced a $0.40 per share dividend.

NGL Growth Leads Enterprise Product Partners to Strong Fourth Quarter
2024-02-02 - Enterprise Product Partners executives are still waiting to receive final federal approval to go ahead with the company’s Sea Port Terminal Project.

Endeavor Integration Brings Capital Efficiency, Durability to Diamondback
2024-02-22 - The combined Diamondback-Endeavor deal is expected to realize $3 billion in synergies and have 12 years of sub-$40/bbl breakeven inventory.