As a benchmark, the BHP Billiton-Petrohawk Energy Corp. deal was a validation of the global competitiveness of US shale plays and an affirmation that the Eagle Ford is emerging as the hottest play in North America this year. Although Eagle Ford acreage accounts for slightly more than one-third of Petrohawk's 1 million net acres sold to BPH Billiton, two-thirds of the South Texas acreage is located in the condensate and oil windows. In BHP Billiton's acreage positions in the Haynesville and Fayetteville, on the other hand, the acquired acreage positions acquired from Chesapeake and Petrohawk produce nearly 100% dry gas. The Eagle Ford, with its three distinct windows, offers unique opportunities for bigger players – both domestic and foreign – to scoop up acreage and enables tech-savvy, mid-cap E&P US companies to lift oil, gas, NGLs, and condensate.
The US $15.1 billion deal that brought the Aussie mining giant into South Texas should help rejuvenate the lackluster deal flow exhibited in the first half of 2011. Deal flow in the domestic oil and gas industry seemed to have hit a soft patch – similar to the US economy – with only $11.7 billion coming through in the second quarter of 2011 compared to $27 billion in the second quarter of 2010, according to Hart Energy's Acquisitions & Divestures Center. Year-to-date deal flow has similarly been soft: Only $24.4 billion worth of announced transactions were consummated in the first half of 2011, compared to $37 billion in the first half of 2010.

The expected Net Present Value is calculated at a 7.5% real discount rate (at constant prices) of a single type-well at "standard economic conditions". Crude oil, condensate, natural gas liquids and natural gas price assumptions: $90/bbl (oil), $7/mcfe (ngl) and $6/mcfe (gas). Operating expenses are set to $1.5/mcfe. Royalty and tax rates are set to 20% and 35%, respectively. Units are in millions US$.
The second bellwether deal of the first half of 2011 was the Marathon acquisition of Hilcorp Resources Holdings LP, announced June 15, for $3.6 billion in cash. Marathon acquired 141,000 net acres in four south Texas counties in all three hydrocarbon windows. According to Jack Aydin of KeyBanc Capital Markets, Marathon paid on the high end at approximately $21,000 per acre.
While Marathon and BHP Billiton were scooping up acreage, SM Energy concluded two deals whereby the company jettisoned roughly 100,000 acres for almost $1 million to help finance developments in the Eagle Ford. According to SM Energy's President and CEO Tony Best, the funds "will allow us to further develop our Eagle Ford assets while locking in some solid returns and maintaining a strong balance sheet." The two deals also brought in foreign companies – Mitsui, Statoil, and Talisman Energy – that are looking to learn more about North American plays.
Another way that Eagle Ford players are bankrolling drilling and completions is to form joint ventures. Anadarko Petroleum Corp. took this route when it signed a $1.55 million deal with Korea National Oil Corp (KNOC) to allow the foreign oil company to earn roughly one-third of Anadarko's interest in its South Texas basins. Suddenly, it appears the Eagle Ford is becoming the darling of international energy companies, eclipsing the Marcellus Shale play.
Acquisition prices for acreage in the Eagle Ford have risen dramatically this year. According to Aydin, deal values prior to the Mitsui deal with SM Energy averaged roughly $12,000 to $13,000 per acre. The Mitsui deal pushed the price up to $17,000 to $18,000 per acre. The Marathon deal again raised the marker to roughly $23,000 to $25,000 per acre. Acreage had been selling at $4,000 to $5,000 per acre since first quarter 2010, according to Hart's original Eagle Ford Playbook.
Permitting and drilling
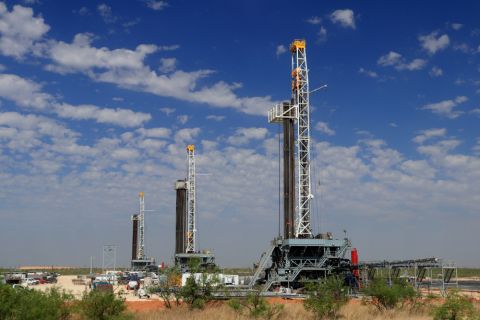
Figure 1 illustrates permitting activity, which also has surged in the districts that comprise most of the Eagle Ford Shale play. New permits in districts 1, 2, and 4 have overtaken districts 7B and 9, which represent the Barnett shale play. Unfortunately, some of the new field permits might also be in the Permian Basin (northeast corner of district 7B). The Haynesville has seen permit activity stay relatively constant for the past 18 months.

Number of new permits per month in districts 1, 2, and 4 (Eagle Ford); 7B and 9 (Barnett); and 6 (Haynesville) in the three Texas shale plays. (Data courtesy of the Texas Railroad Commission)

Rig count activity in the three Texas shale plays. (Data in figures 2-7 from the North American Shale Quarterly)
Production on the rise
Production is also picking up in the Eagle Ford as more resources are dedicated to lifting volumes. Most of the resources are deployed in the oil and condensate part of the play. Figure 3 shows that the amount of rigs dedicated to oil production eclipsed that of rigs dedicated to gas production in April 2011.

Oil and gas rig count in the Eagle Ford Shale play.

Production by hydrocarbon type from the Eagle Ford Shale play, barrels of oil equivalent per day.
Play economics is the key driver of Eagle Ford investment from already existing players and new entrants looking to establish a toehold in South Texas. According to Rehan Rashid and Saurabh Lele of FBR Capital Markets, "The Eagle Ford shale asset base could ultimately be worth somewhere between $85 billion (base case) and $200 billion (upside case) to the industry."
The FBR Capital Markets base case reflects the current initial production rate, estimated ultimate recovery assuming a 30-year life span, rig count activity levels, and product margins. Its upside analysis indicates that as cumulative wells drilled in other shale plays double, yields increase by 15% to 23%; the improvement in productivity is measured by increased average 30-day production rates. Of the four shale plays surveyed by FBR Capital Markets, the Fayetteville increased initial production the most at 23%, followed by the Barnett at 17.5%, the Bakken at 16%, and the Haynesville at 15%. Our base case liquids supply forecast is roughly 15% higher than the FBR Capitals base case and 25% higher when isolating just crude oil.
Top producers
Our production analysis is built from the bottom up by going to each of the major companies in the play and forecasting their production by hydrocarbon volumes. We note that the top companies that have staked out acreage in the Eagle Ford change quite frequently from quarter to quarter as M&A activity has heated up. At press time, the joint venture between Chesapeake and the Chinese National Offshore Oil Corp. (CNOOC) held a slight edge over EOG Resources. Although BHP Billiton beat out Newfield Exploration for third place, the Aussie giant's dry gas acreage is larger than any other major player in the Eagle Ford. The Anadarko/ KNOC joint venture comes in fifth. Six companies hold acreage positions between 200,000 and 250,000 net acres.

Production by company from the Eagle Ford Shale play, barrels of oil equivalent per day.
Looking at acreage positions from June 2010, the key differences are the purchase of Petrohawk by BHP Billiton and the cashing out of SM Energy. Shell and Pioneer Natural Resources have actually built their acreage position compared to one year ago.
Given the rapidly rising rig counts, the production rates of individual companies should see a rather rapid ramp upward. While EOG Resources has the lead in production as of July 2011, by year-end 2012 the Chesapeake/CNOOC joint venture will likely produce more barrels of oil equivalent given the current acreage positions and production schedule announcements. For the time being, BHP Billiton's production forecast is an extension of what Petrohawk had planned. Recent statements suggest, however, that BHP will spend more on drilling and completion costs going forward in all the acreage acquired from Petrohawk. Our NASQ forecasts suggests that the Talisman/Statoil joint venture, which didn't make the top 10 in acreage positions, will likely become the fourth largest volumetric producer in the Eagle Ford given deep pockets and an aggressive drilling schedule. The Anadarko/KNOC joint venture, Marathon Oil, and Murphy Oil are each expected to produce approximately 50,000 barrels of oil equivalent per day by the end of the forecast period. The top 10 is rounded out by Pioneer Natural Resources and El Paso, which didn't make the list in acreage positions. Newfield Exploration and Shell, despite being in the top 10 in acreage, did not make the top 10 in production.
The Eagle Ford has several small to mid-cap producers that will contribute significant volumes from the play. Cabot Oil & Gas and Magnum Hunter have working relationships with EOG Resources. Lucas Energy, Goodrich Petroleum Corp., Rosetta Resources, and Swift Energy all have acreage positions augmented by company permits, and rig activity should raise production from the Eagle Ford. Hence, the "other" producers already out-produce the individual heavyweights. We expect these others to out-produce the heavyweights throughout the forecast period, as depicted in Figure 6. Finally, ExxonMobil and British Petroleum also have sizable acreage positions and deep pockets to add to volumes to the Eagle Ford.
The NASQ believes that the Eagle Ford Shale play will produce more liquids volumes than any other play in North America. The rationale behind this assessment is that the economics suggest that companies will view their Eagle Ford acreage positions with higher internal rates of return and high net present valuations:
• Geology is favorable and comparable to the Bakken shale play;
• The Eagle Ford will benefit from advances in completion technologies at an earlier stage of its development than the Bakken;
• Play acreage and well spacing are optimized in sparsely populated and easily accessible locations; the play should be developed year-round with better climatic conditions;
• Initial production rates have been improving materially as the Eagle Ford is a more recently developed play with lessons learned from the Bakken shale play; and
• The play is closer to consuming and oil processing regions with the ability to export production.
Looking at some of the players in the Eagle Ford and the Bakken, the NASQ estimates the weighted, breakeven price for a barrel of oil equivalent will average roughly $5 per barrel cheaper in the Eagle Ford in our forecast period.
Most valuable players
Looking specifically at individual companies, the positions held by Chesapeake, BHP Billiton, and EOG Resources appear to be the most valuable in the play when measuring net present valuation, estimated ultimate recovery, and break-even prices. In fact, while BHP Billiton may have been criticized in the financial press for paying too much for its acquisition of Petrohawk, our analysis suggests that, at least for the Eagle Ford, its positions were highly rated. ConocoPhillips also appears to hold solid positions. Anadarko and Plains E&P hold middle-level tier positions when looking at our matrix. Solid positions are also held by Murphy Oil and Newfield Exploration (Figure 7).
Recommended Reading
TPH: Lower 48 to Shed Rigs Through 3Q Before Gas Plays Rebound
2024-03-13 - TPH&Co. analysis shows the Permian Basin will lose rigs near term, but as activity in gassy plays ticks up later this year, the Permian may be headed towards muted activity into 2025.
TotalEnergies Acquires Eagle Ford Interest, Ups Texas NatGas Production
2024-04-08 - TotalEnergies’ 20% interest in the Eagle Ford’s Dorado Field will increase its natural gas production in Texas by 50 MMcf/d in 2024.
Repsol to Drop Marcellus Rig in June
2024-04-28 - Spain’s Repsol plans to drop its Marcellus Shale rig in June and reduce capex in the play due to the current U.S. gas price environment, CEO Josu Jon Imaz told analysts during a quarterly webcast.
To Dawson: EOG, SM Energy, More Aim to Push Midland Heat Map North
2024-02-22 - SM Energy joined Birch Operations, EOG Resources and Callon Petroleum in applying the newest D&C intel to areas north of Midland and Martin counties.
Barnett & Beyond: Marathon, Oxy, Peers Testing Deeper Permian Zones
2024-04-29 - Marathon Oil, Occidental, Continental Resources and others are reaching under the Permian’s popular benches for new drilling locations. Analysts think there are areas of the basin where the Permian’s deeper zones can compete for capital.