Wellbores are placed using petrophysical data as well as what current wells in that area are achieving. Due to the high cost of wellbore entry for tools, the general approach to production expectations and estimated ultimate recovery (EUR) is an analysis of hydraulic stimulation effectiveness based on production, (comparison against nearby wells), or using the production and pressure curves to model the stimulation results.
The use of radio-isotope tagged proppant, evolving more recently into proppant supplier neutron reacting proppant additives, have proven effective to verify the position of proppant placement in specific clusters and along the wellbore. With the limited measurement distance away from the wellbore, this technology is best viewed as a near-wellbore proppant placement confirmation.
The use of chemical tracers for reservoir surveillance has long been used by operators to evaluate the field and development plans in conventional wells. Tracerco has been providing interwell and controlled release tracer technology for over 30 years.
Since 2006, the evolution of chemical tracer technology in frac applications has allowed operators to tag stimulation fluids as well as in-situ oil and gas to measure actual oil and gas production per stage, determine clean out efficiency of frac water from each stage, detect fracture communications to offset wellbores, and to confirm toe flow to verify the release of all frac plugs.
All this information empowers operators to optimise development plans by evaluating ongoing well designs correlating stimulation methodologies, as well as the petrophysical expectations. Ultimately, this enhances future performance from unconventional fields.
The appeal of chemical tracer technology is growing among operators. They can see the effective production from specific stimulated stages. Coupled with the fact that tracers require no wireline intervention or loss of production, tracer technology is able to show the production trend over several years in some cases.
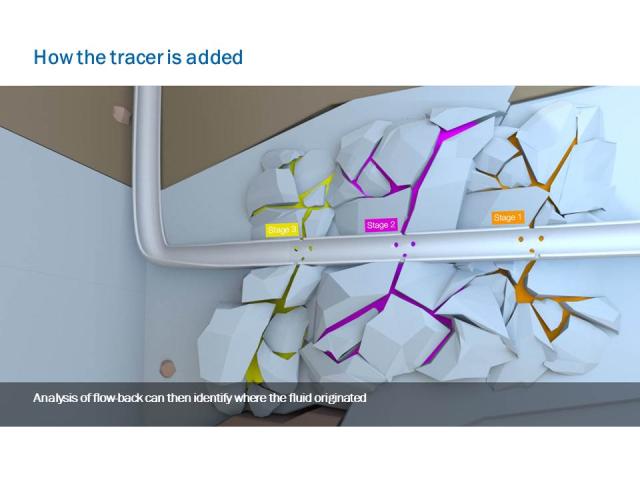
The key value of the use of chemical tracer technology is the use of specialised chemicals that are applied to the stimulation fluid as a marker for each phase (Figure 1). Aqueous soluble tracers are used for the stimulation water, high temperature organic tracers in liquid form for the in-situ oil phase, and non-condensing gas tracers for the vapor phase.
Principles of the technique
Analysis and quantification of post-frac hydrocarbon production can be accomplished using unique oil and gas based chemical tracers to indicate and measure stage production (Figure 2). The use of tracers specifically targeting the hydrocarbon phase is a relatively new approach to determining stage production based on actual oil and gas production over time.
The organic phase tracers are applied in the form of emulsion in the aqueous based stimulation fluid of each stage and are transported throughout the fracture matrix via the frac fluid. The selected specialised tracers are hydrophobic with a very strong affinity for either hydrocarbon liquid or gas, ensuring that the tracer will move across from the aqueous phase into the in-situ hydrocarbon.
The tracers are typically added to the stimulation fluid during the early and mid-stages of the proppant application, ensuring displacement deep into the fracture matrix away from the wellbore wherever the frac fluids propagate through the fracture matrix.
Sampling of returned water is not necessary since the tracers are exclusive to the hydrocarbon phase. Samples of the produced oil or gas are collected from the wellhead, (Figure 3), analysed for the presence and concentration of each tracer in each sample over time. Sample collection begins with first oil or gas and continues daily for a minimum of 30 days, and may be followed by weekly sampling for long-term production verification.
For each sample, the measured amount of tracer from each stage is proportioned to total oil production and indicates the amount of hydrocarbon produced from that stage during the sample time, with more hydrocarbon produced resulting in increased tracer displacement from that stage. As the concentration of each tracer is directly proportional to the volume of hydrocarbon flowing from the stage, each sample collected provides data similar to a production log identifying the hydrocarbon production of each stage at the time of sample. Reviewing the analysis of sequential samples provides a continuous measurement of production from each stage.
Where a production logging tool (PLT) will identify production during the specific point in time when it is run, the Tracer Production Log (TPL) is particularly useful in understanding how each stage produced over the sampling period. For example, does production begin from one stage sooner, or last longer than production from another stage?
This knowledge provides an indication of how choke changes affect the production from specific stages and identifies how the well comes on stream, with varied and changing individual stage productions as reservoir
Data sets
Figure 4 presents the tracer results presented in three distinct formats. The Stage Contribution Overview provides an executive summary of stage-by-stage well operation, showing the total production of each stage during the entire test period.
The Daily Stage Production Log presents the stage’s production variations occurring over time, and is useful to compare a stage production against other stages or during changing operational parameters.
The Cumulative Stage Production Log presents data similar to the daily production log, but smoothed to minimise the effect of daily variations and better illustrate operational trends.
Provided all stages are tagged, the stage production can be presented in barrels produced per stage, per sample, allowing a direct comparison of flow from the stages at the varied times, even though total oil production had changed.
The most value from use of hydrocarbon chemical tracer tagging comes from its ability to evaluate the success of drilling and completion activities in order to optimise future well design.
Reservoir professionals use an analysis of reservoir characteristics such as stress, TOC, Poisson’s Ratio, Young’s modulus, and permeability to indicate areas along the lateral with similar properties, and thereby identify areas for perforation where it is hoped that lateral coverage and completion efficiency can be maximized. Oil-smart tracers provide a measure of the success of these efforts.
A case history
An operator used a 30-stage wellbore to evaluate the use of three specific proppants for “tail-in,” with accompanying fluid changes required for that proppant. The operator had been utilising slickwater with 40/70 proppant as the primary completion design and wanted to determine if two other proppant options offered a better cost-to-production opportunity.
The three stimulation designs were applied to the wellbore stages sequentially along the wellbore in a 1, 2, 3 format, with the format repeating the length of the wellbore. Each design was stimulated identically with the exception of a different tail in program.
- One trial proppant “tail-in” used an experimental 30/50 ceramic proppant requiring a crosslink hybrid gel to carry the proppant.
- The second trial proppant “tail-in” used a standard 30/50 resin-coated sand, also requiring a crosslink hybrid gel to carry the proppant,
- The “baseline” completion design used only slickwater and standard 40/70 resin-coated sand in the tail.
Graphing the tracer response over time (Figure 5) provides information on how transient flow, planar and complex fracture matrices contributed to total flow during the days and weeks. In Figure 5, a clear shift in dominant stage production occurs between the early time flow regime and the more stable 2nd time production regime, with one stage dropping in production and another taking over as the leading producing stage.
Evaluating stage efficiency in such a graph can be complicated, and the better method to evaluate the results from stages that produced differently during the different operating conditions over the 40 days, would be to use a “total oil contribution” comparison of all stages tagged of each of the three designs. This method would then provide a better comparison and understanding of the effectiveness of the tested proppant to the wellbore and production.
Stage cumulative tracer responses for each design were identified, grouped and averaged to provide a comparative response profile for the 40 days. The three averaged cumulative measurements are presented in Figure 6.
- The experimental 30/50 ceramic proppant contributed the least amount of total oil,
- The standard 30/50 resin-coated sand contributed nearly the same as the baseline 40/70 resin-coated sand proppant,
- The “baseline” completion design continued to be the more effective early and late time completion strategy.
The visual representation of the stage flow over time in the Daily Tracer Production graph can be utilised to identify stage flow regimes and pinpoint their shift from transient to depletion/boundary dominated flow regimes. In Figure 6, the shift in flow regimes previously described is used as a divider to compare early production and later production to show the changing contribution to the total volume of tracer produced.
A comparison of the cumulative production for each of the two production regimes shows that the experimental 30/50 ceramic proppant contributed 1525 bbl of oil during the early time, with another 6475 bbl during stabilised production.
The standard 30/50 ceramic proppant contributed 2059 bbl and 8409 bbl for the two flow regimes, and the baseline completion design contributed the most with 2267 bbl during early production and another 9144 bbl during the stabilised production regime.
Environmentally Friendly
Looking forward at informational requirements of the oil and gas community, ongoing research and development in the area of hydrocarbon tracer tagging will see an ever increasing number of unique tracers developed to service increased multi stage stimulations beyond the number currently available. The industry should also anticipate improvements in extending tracer production to many years after well start up.
With the concern by the public on water and the environment hydraulic fracturing operations have, the chemicals utilized as tracers, in parts-per-billion levels, are in a biodegradable delivery system derived from a natural solvent that becomes part of the in-situ oil. The chemical and delivery system components have been tested and approved by a number of organisations including the Australian Department of Health, Cefas, US-EPA and the Environment Canada.
Conclusion
There is a distinct production rate difference between the three proppant and “tail-in” tests with the basic slickwater and 40/70 sand providing the greater production during the both the initial and stabilised flow regimes.
The tested experimental ceramic 30/50 proppant fared the worst, with the standard ceramic 30/50 proppant contributing near the same as the slickwater tail-in completion.
A case for continued sampling over a much longer time frame, 180 days, can easily be a benefit to production monitoring, allowing more data on long-term production aspects of any specific completion protocol.
The complexity of the unconventional fields, as well as the productivity differences due to wellbore placement and stimulation methods, means that having the right tool in terms of data to understand the effectiveness of the planning and execution of the wellbore and in-field drilling.
Knowing the effective stage production as part of the integrated comprehensive model of the field and development, will provide accurate modeling of the field, improved development planning and production optimisation, and short-term production forecasting capability integrated with the long-term formcast.
Recommended Reading
NOG Lenders Expand Revolving Credit Facility to $1.5B
2024-04-30 - Northern Oil and Gas’ semi-annual borrowing-base redetermination left its reserved-based lending unchanged at $1.8 billion.
Imperial Oil Names Exxon’s Gomez-Smith as Upstream Senior VP
2024-04-30 - Cheryl Gomez-Smith, currently director of safety and risk at Exxon Mobil’s global operations and sustainability business, will join Imperial Oil in May.
Diamondback Stockholders All in for $26B Endeavor Deal
2024-04-29 - Diamondback Energy shareholders have approved the $26 billion merger with Endeavor Energy Resources.
TotalEnergies Eyes Suriname FID by Year-end 2024
2024-04-29 - France’s TotalEnergies and U.S. partner APA Corp. look to place their long lead orders ahead of a final investment decision related to their joint development offshore Suriname in Block 58.
ProPetro to Provide eFrac Services to Exxon’s Permian Operations
2024-04-29 - ProPetro has entered a three-year agreement to provide electric hydraulic fracturing services for Exxon Mobil’s operations in the Permian Basin.

