
“What we are seeing get done are predominantly noncore asset sales by large companies carving off assets to improve their liquidity,” Grant Butkus, U.S. head of A&D advisory for Macquarie Capital, told attendees of Hart Energy's DUG Rockies conference on March 10. (Source: Hart Energy)
DENVER—Despite predictions of a ramp up in M&A activity, deal making in 2016 is turning out to be as sluggish as last year.
According to Grant Butkus, U.S. head of A&D advisory for Macquarie Capital, three key factors are behind the continued tepid pace of transactions: high debt levels for which assets are pledged as security, the continuing wide bid-ask spread and ongoing commodity volatility.
“Overall, it’s been a very slow 18 months around the A&D and M&A markets. And, as commodity prices stay down, we believe it’s going to continue to be hindered by those three factors,” Butkus said at Hart Energy’s recent DUG Rockies conference.
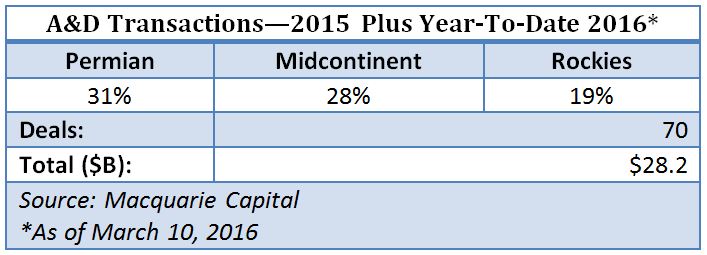
During the last three quarters of 2014, combined A&D and M&A transactions averaged more than $20 billion per quarter, according to Macquarie data. By contrast, for all of 2015 plus year-to-date 2016, all transactions, aggregating 70 deals, totaled only $28.2 billion. Regions ranking highest in the latter period were the Permian—31%, Midcontinent—28% and Rockies—19%.
“What we are seeing get done are predominantly noncore asset sales by large companies carving off assets to improve their liquidity,” Butkus said. “These don’t have an extremely meaningful impact to their overall balance sheet. The other thing we’re seeing is some distressed assets come to market, and predominantly that’s happening after some kind of restructuring transaction.”
High Debt
In terms of factors impeding a higher pace of transactions, Butkus began with high debt levels that in some cases were supported by key assets. The implication, he said, was “how do you sell a large chunk of what could be potentially your borrowing base?”
In terms of methodologies used by banks in calculating borrowing bases, Butkus cited historical data from Macquarie’s survey of energy lenders showing banks’ price decks being set at about 75% of West Texas Intermediate (WTI) strip prices in 2011. Since then, banks’ price decks have moved higher until, in 2016, the front-year is set at 97% of strip with the out-years set above strip, so that the banks are now evaluating assets in a loan portfolio “at strip and slightly above strip.”
This “deviation” from historical metrics has resulted in a “cushioning effect” on borrowing bases as commodity prices have come down, Butkus said. Coupled with more widespread use of hedges in 2015, this partly explains the absence of “a wave of distressed assets [hitting] the market.”
Butkus offered an example based on an assumed flat production profile and a 65% advance rate. If a borrowing base was set in the fourth quarter of 2014, the negative effect of falling oil prices during 2015 would be cushioned by the banks’ use of a rising price deck relative to strip prices, coupled with greater use of commodity hedges, such that borrowing bases “stayed above senior secured loan levels.”
For the A&D and M&A markets, the debt issue triggered by declining borrowing bases in the wake of slumping commodity prices impedes getting deals done, according to Butkus. The debt levels carried by some companies “make it difficult to acquire these companies, because you’re essentially acquiring the debt of companies that don’t have the assets to really support it. And going forward, we think that’s going to slow A&D and M&A activity.”
The Spread
A second item slowing activity is the continued wide bid-ask spread. To illustrate how this issue has grown in importance, Butkus suggested that the bid price was related to strip prices as buyers seek to protect against downside commodity price risk affecting asset values, whereas the ask price was more closely aligned with the consensus Wall Street price deck going forward.
“While the strip prices takes a very long time to get to a WTI price of $60 per barrel, most Wall Street price decks are going to $60 or something higher very quickly,” he noted. “If how Wall Street is evaluating an asset reflects how the equity of a company is being evaluated, and strip prices reflect how the debt is being evaluated, there is a growing difference between those two.”
From 2011 to 2013 the divergence between strip prices and a consensus Wall Street price was typically about 10% and sometimes rose to the low teens, whereas today the difference has been as much as 30-35%, according to Butkus. “The difference between those is representative of what we’re seeing in the bid-ask spread, and how different parts of the capital structure are being valued.”
Volatility
A third factor was oil price volatility between signing a purchase and sale agreement (PSA) and closing a deal, which typically can take 45, 60 or 90 days. The greater the difference between prices in effect at the time of the PSA and the time of closing, the harder it is complete a deal because of “significant change, leading to repetitive price re-trading and failed deals.”
While oil price volatility has tended to narrow recently, “we think this has been one of the things that has been hindering the market,” Butkus said. He noted a Macquarie product called a “pre-acquisition hedge” that enables customers to lock in commodity prices at PSA and avoid commodity volatility through closing.
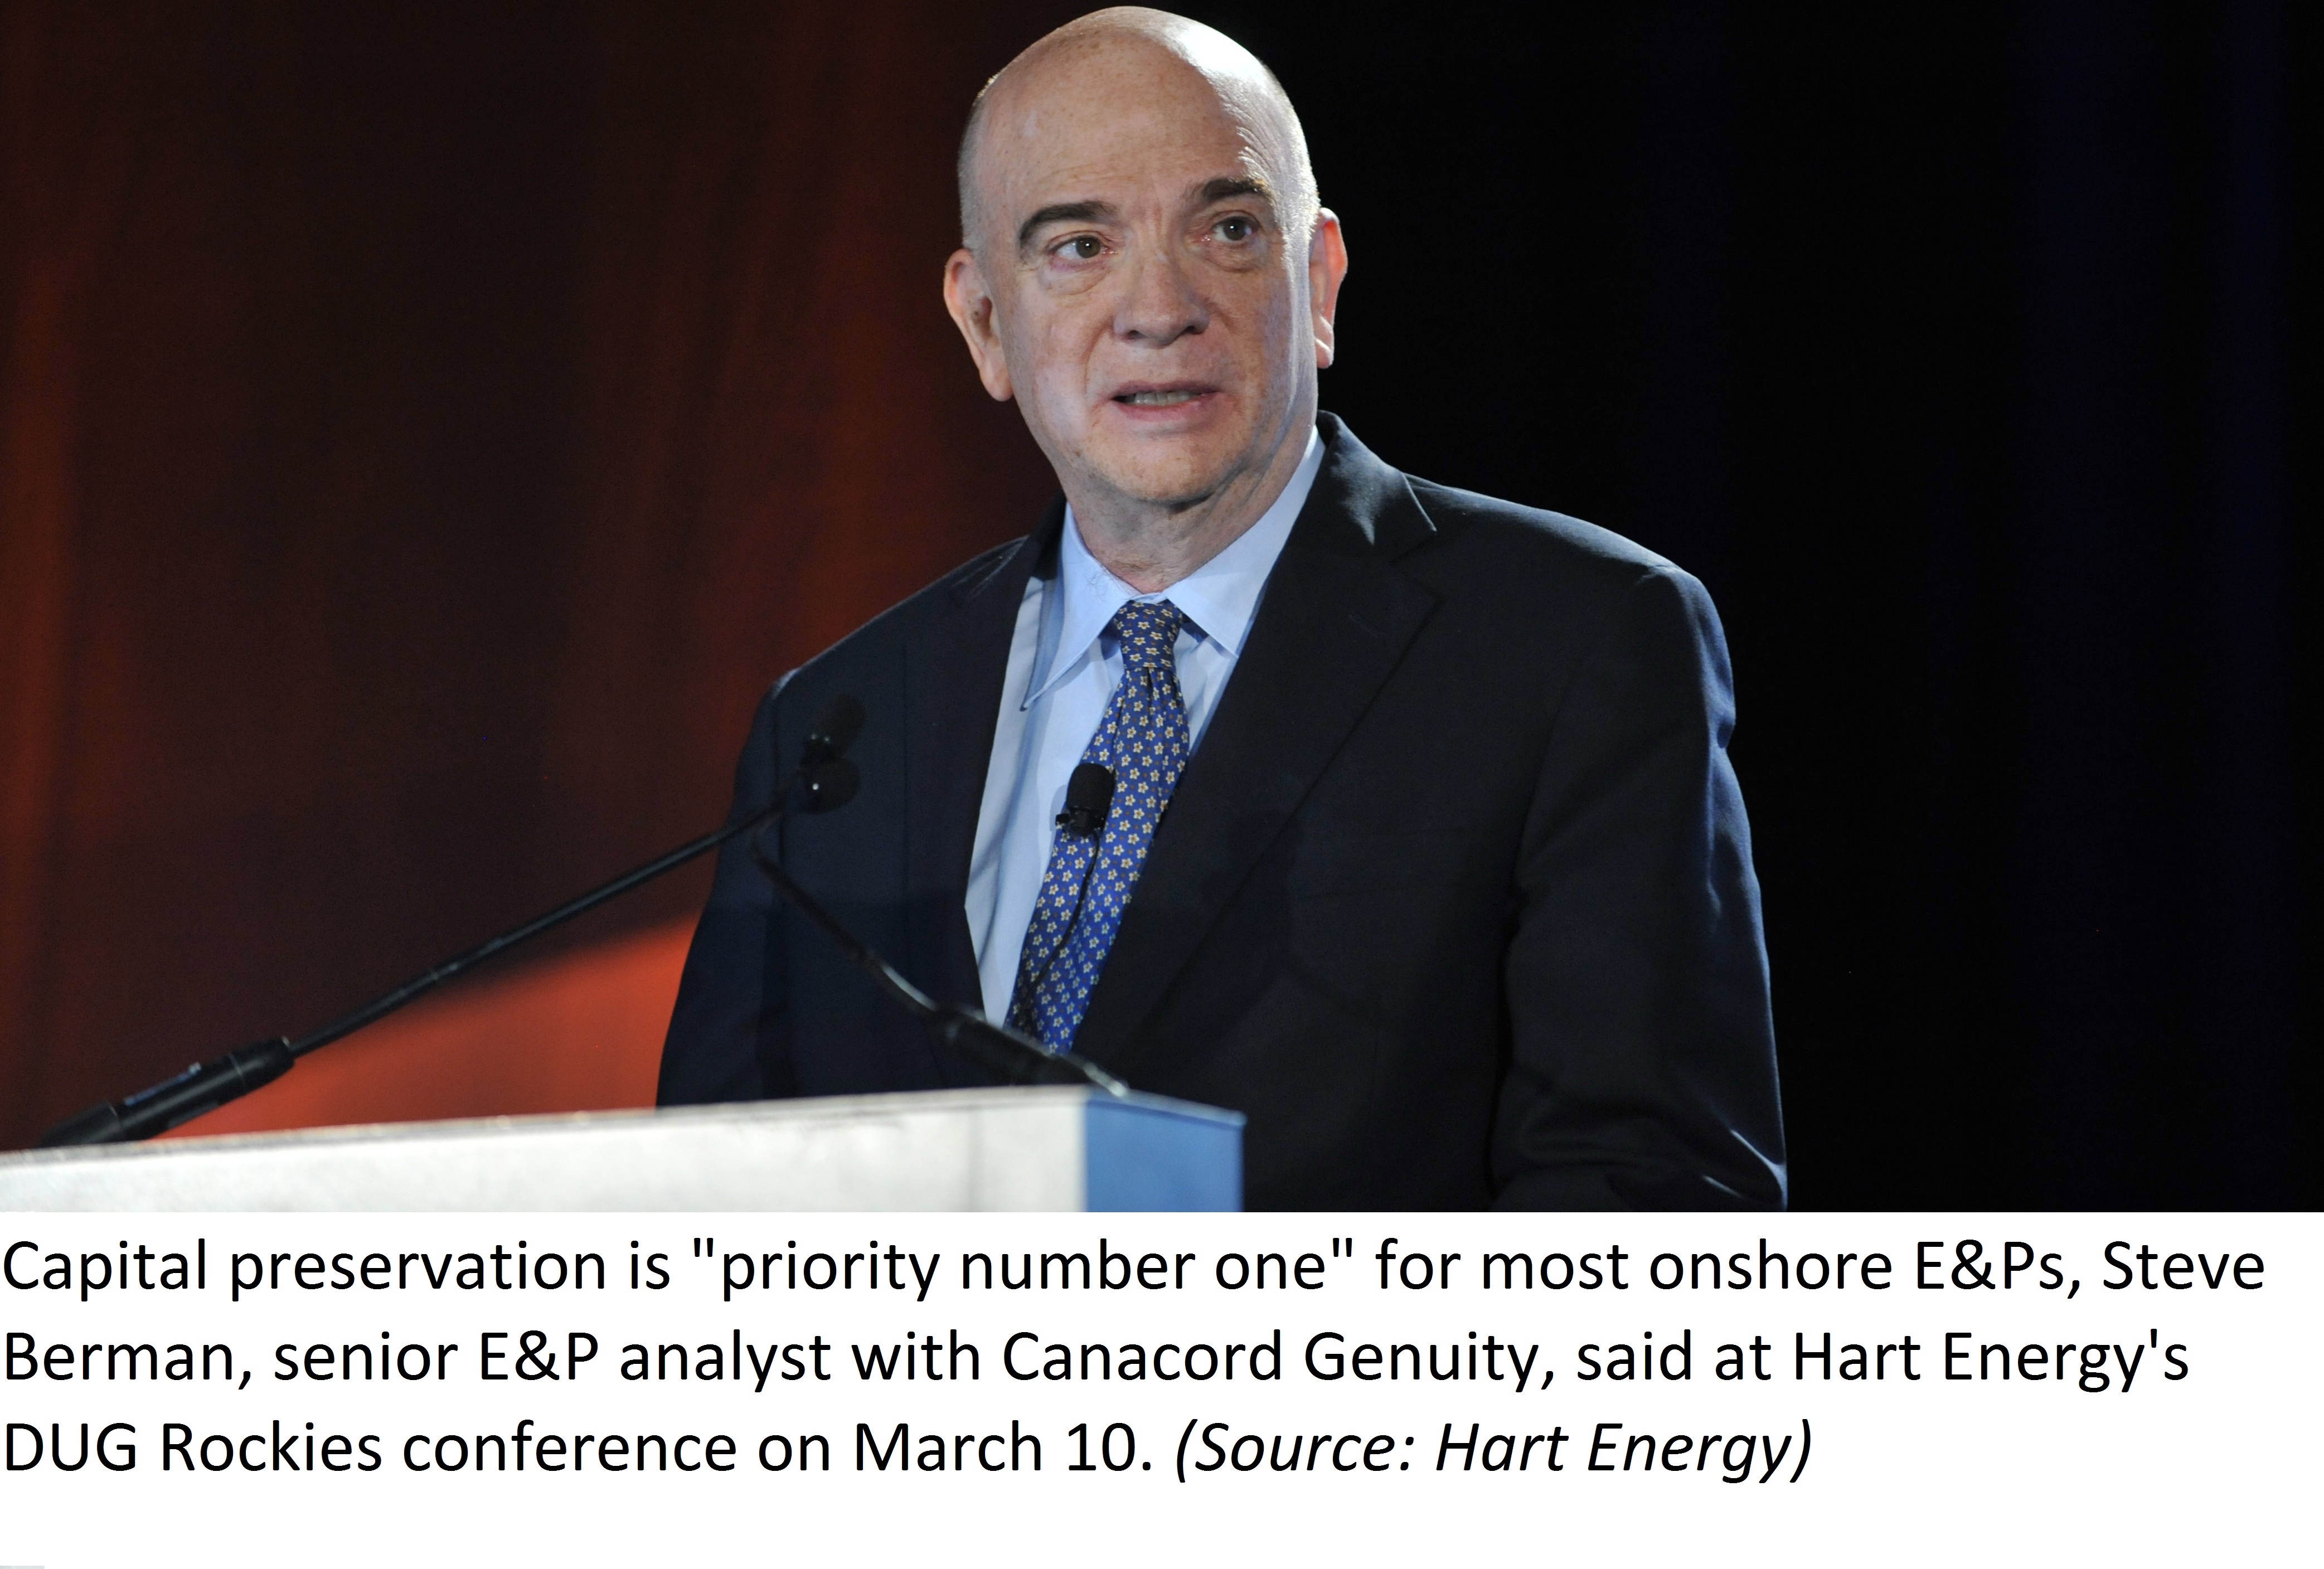
Addressing individual company strategies, Steve Berman, CFA and senior E&P analyst with Canacord Genuity Inc., highlighted capital preservation as “priority number one” for most onshore E&Ps, many of whom are expecting to come out of the spring redetermination season with, on average, 20-30% reductions in their borrowing bases. In addition, E&Ps’ commodity hedges were also rolling off, he said.
With E&Ps needing to focus on what they can control, Berman said, budgets should be set within cash flow or close to cash flow breakeven even if it means no production growth or even declining output. “Drill the best wells you can at the lowest possible costs and hold off on completing wells,” he advised, noting industry estimates of 4,000-6,000 drilled but uncompleted wells.
Tapping public equity markets, if possible, provides “certainty” and often has been “well received” with stock prices moving higher following equity offerings, Berman said. He noted that about 17 deals were transacted this year. Additionally, private equity stands on the sidelines awaiting deals, although the bid-ask spread likely needs to narrow for deals to be finalized.
Recent private-equity-backed deals cited by Berman included Rex Energy Corp.’s (NASDAQ: REXX) $175 million joint exploration and development agreement with Benefit Street Partners LLC, and a credit agreement for $350 million between Clayton Williams Energy Inc. (NYSE: CWEI) and lender Ares Management LP. The latter is a second-lien term loan that will be used to pay down outstanding debt on Clayton Williams’ revolver. The deal also includes stock warrants for Ares from Clayton Williams.
Chris Sheehan can be reached at csheehan@hartenergy.com.
Recommended Reading
Chevron’s Tengiz Oil Field Operations Start Up in Kazakhstan
2024-04-25 - The final phase of Chevron’s project will produce about 260,000 bbl/d.

Rhino Taps Halliburton for Namibia Well Work
2024-04-24 - Halliburton’s deepwater integrated multi-well construction contract for a block in the Orange Basin starts later this year.

Halliburton’s Low-key M&A Strategy Remains Unchanged
2024-04-23 - Halliburton CEO Jeff Miller says expected organic growth generates more shareholder value than following consolidation trends, such as chief rival SLB’s plans to buy ChampionX.
Deepwater Roundup 2024: Americas
2024-04-23 - The final part of Hart Energy E&P’s Deepwater Roundup focuses on projects coming online in the Americas from 2023 until the end of the decade.