Recent significant discoveries by Apache in the West Texas Delaware Basin and ExxonMobil offshore Guyana make clear that more effective seismic imaging of geology might help identify similar opportunities both in relatively new areas and those that might be considered “known” or of little potential. An alternative processing treatment for conventionally acquired 2-D and 3-D seismic survey data produces subsurface images scaled in approximate absolute velocities, representing a seismic view showing remarkable detail and approximating subsurface geology. Indicated velocity changes are made visible by this method and also track quite closely actual velocity variations observed from logging results. These results can be obtained in both conventional and unconventional objectives. In particular, new and previously unrecognized opportunities might be noted in frontiers and even in older areas.
HPR
Highest possible resolution (HPR) imaging, which follows from seismic holography, has been studied and written about by several prominent geoscientists. The final data presentation by this method is a full-wavefield composite inversion that also includes an estimated velocity trend function. It is entirely a seismic product since there is no propagating wavelet, and no subsurface information is used in the data treatment. Boundaries are described by those frequencies necessary to represent their character. That is, higher energy boundaries will show narrower (and necessarily lower) frequency content due to surface roughness and vertical gradation. Frequency content then also becomes a depositional energy measure, and frequencies in the hundreds of Hertz become obtainable from standard (and existing) seismic survey data. Outputs typically have 16 times the sampling of standard presentations and are viewed with an extended visual dynamic range color display. Resolution is increased by factors approaching five, especially in the deeper section. Marine ghosting effects vanish, and interpretability of the geology is increased 25-fold to 30-fold.
Capturing information content
High-velocity (impedance) lithologies (especially carbonates and consolidated sands) have little seismic expression and often go unrecognized, even unsuspected. Thin and deeper consolidated clastics can be mapped and resolved adequately for other follow-on attribute studies to be applied. Fluid-bearing chimneys can be mapped in detail. Well ties show remarkable character matches. There are also indications that microstratigraphy requiring definition in the hundreds of Hertz becomes accessible for study. Changing the basic paradigms by which seismic field data are treated more fully captures the information content embodied and significantly enhances hydrocarbon E&P opportunities.
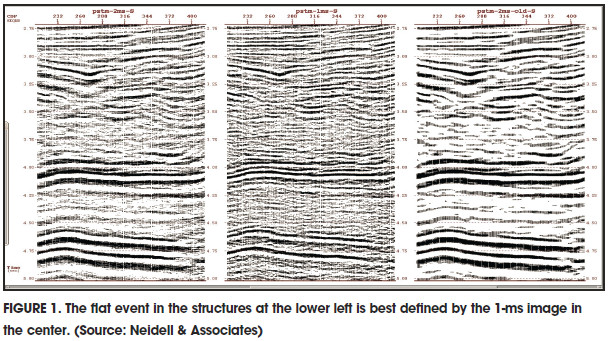
Figure 1 shows a comparison of processing alternatives for a short seismic profile using standard seismic displays. Both HPR images at the left and center have greater resolution than the standard 4-ms processing at the right. Only the 1-ms processing at the center has the resolution necessary to see the flat spots in the two structures at the left, one just below halfway down and the other deeper in the section below it.

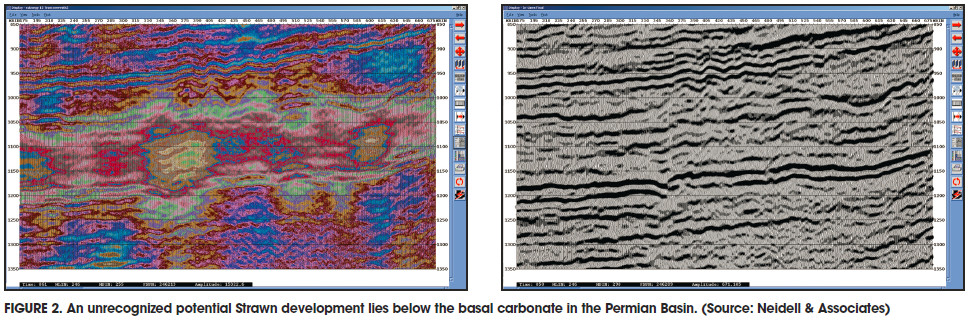
Of course, the standard displays do not do justice to the full information content of the data. This requires a display having far greater visual dynamic range. One such display shows some Permian data using highly contrasting color steps of 122 m/sec (400 ft/sec). Figure 2 contrasts the composite inversion with the HPR data in traditional display format. The Cisco and Canyon structures (pinks and green) above the basal carbonate (blue and red) have produced more than 100 MMbbl of oil. A very similar velocity character is shown by the Strawn development below the basal reflector (pink and green again), and this has not been drilled. Conventional seismic displays offer little incentive to investigate such features, and nearby well control is very sparse.


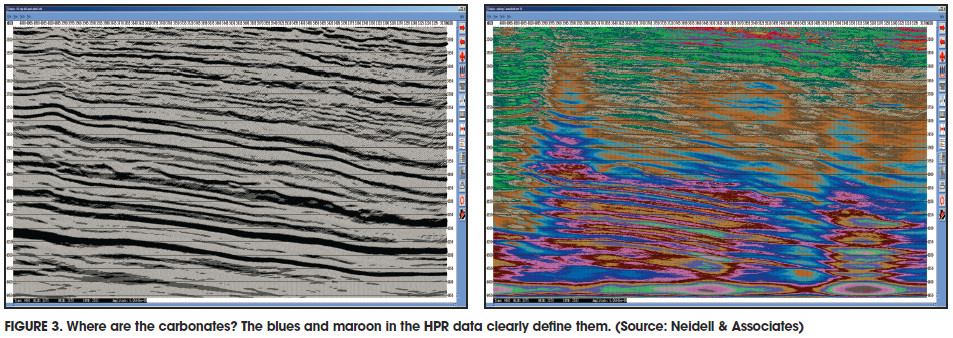
On both sides of the Atlantic Ocean there are clastic opportunities overlying prospective carbonate developments. But viewing the HPR data in standard display, some may ask where the carbonates are (Figure 3). The velocity display even shows the consolidation effects on the carbonates as one moves deeper in the section, with the mustard color indicating even higher carbonate velocities.
What benefits does this technology offer in the unconventional setting? In Figure 4 the interval between two railroad tracks on the standard display is expanded to show three distinct members, an upper and lower shale bracketing a carbonaceous middle member. A corresponding gamma ray log helps validate the rock properties. Velocity variations within the middle member also are clearly seen. There is, of course, often a good correlation between production capability and velocities as seen, but both clays and calcites are involved.


Finding hydrocarbons is one matter, but producing them effectively is another matter. If it was possible to somehow associate a velocity value or range of values with the hydrocarbons, it would be possible to better define and appreciate the reservoir architecture. This would make development more effective and greatly reduce costs. Figure 5 shows a clastic offshore example and an onshore carbonate, where the most likely occurrences of hydrocarbons are shown in black. These both are from known production. The industry will always benefit from exceptional geological study and innovative thinking for finding and producing hydrocarbons. Now the industry can add to these truly extraordinary seismic imaging to further enhance its abilities. Discoveries like those cited earlier might not be so infrequent if the industry combines insight and intellect with superior seismic imaging.
References available.
Contact Executive Editor Rhonda Duey at rduey@hartenergy.com for more information.
Recommended Reading
Keeping it Simple: Antero Stays on Profitable Course in 1Q
2024-04-26 - Bucking trend, Antero Resources posted a slight increase in natural gas production as other companies curtailed production.
NOV Announces $1B Repurchase Program, Ups Dividend
2024-04-26 - NOV expects to increase its quarterly cash dividend on its common stock by 50% to $0.075 per share from $0.05 per share.
Initiative Equity Partners Acquires Equity in Renewable Firm ArtIn Energy
2024-04-26 - Initiative Equity Partners is taking steps to accelerate deployment of renewable energy globally, including in North America.
Repsol to Drop Marcellus Rig in June
2024-04-26 - Spain’s Repsol plans to drop its Marcellus Shale rig in June and reduce capex in the play due to the current U.S. gas price environment, CEO Josu Jon Imaz told analysts during a quarterly webcast.
Ithaca Deal ‘Ticks All the Boxes,’ Eni’s CFO Says
2024-04-26 - Eni’s deal to acquire Ithaca Energy marks a “strategic move to significantly strengthen its presence” on the U.K. Continental Shelf and “ticks all of the boxes” for the Italian energy company.


