Playing the financial “what if” game is faster and easier when data from multiple sources is all in the same system.
For years, oil and gas companies have used programs like Excel to crunch data that was used to make business decisions, but that system takes time. One operating company needed to provide information to investors but knew there had to be a better way.
Zeno Technologies developed and launched its Energy OS (Operating System) to help shale producers keep track of their numbers, compare performance and evaluate what a change in oil price or inflation might mean for the business.
Historically, said Matt Stammers, Zeno’s senior vice president of marketing and people, operators have collected data about production, price decks and expenses from various sources, which means evaluating the financial performance of an asset can require multiple calculations across different platforms. And changes have to be tracked.

“They’re trying to use Excel to understand how their assets are performing,” Stammers said. “It’s not fun for them today.”
“They no longer need to look at financial performance quarterly or monthly. They can look at it daily.” - Matt Stammers, SVP of Marketing and People at Zeno Technologies
Further, he said, it’s “scary that people are still trying to understand financial performance in this way.”
The spur for creating Energy OS started with Echo Energy, which wanted to get a better handle on how the company was performing financially and what it might look like in the future, Stammers said.
It was, he said, a data problem, and that made it difficult to get to the truth of how well a company was doing.
”They were struggling to get answers,” Stammers said and knew there must be a way to bring together modern data management and analytics tools and the energy industry and merge that into a “single golden record.”
Zeno was founded in January 2020 with Echo as an original founding partner. The company worked in stealth mode for about a year and a half, launching publicly in October 2021.
“Now we have a working platform and live revenue-paying customers on that platform,” Stammers said.
Zeno’s newest customers include a privately held producer seeking to optimize the financial return on its investments, a pre-asset organization using Zeno to assess potential acquisition targets, and a leading operator in the Permian Basin and Eagle Ford Shale looking to make better-informed A&D decisions.
How it works
Energy OS is meant to help the energy companies hone their daily operations so they are financially efficient and able to see what happens to the business if there’s a $5 change in the price of oil or what 10% inflation might do to the portfolio, he said. It also allows blending of historical data to help companies better understand the health of their business.
The new Command Center in Zeno’s Energy OS has three key sections: home, reserves and returns. The home screen provides key metrics, displays forecasts versus actual performance, shows which assets are over- or under-performing, presents the planned drilling program, highlights potential acquisitions and lists top news headlines.
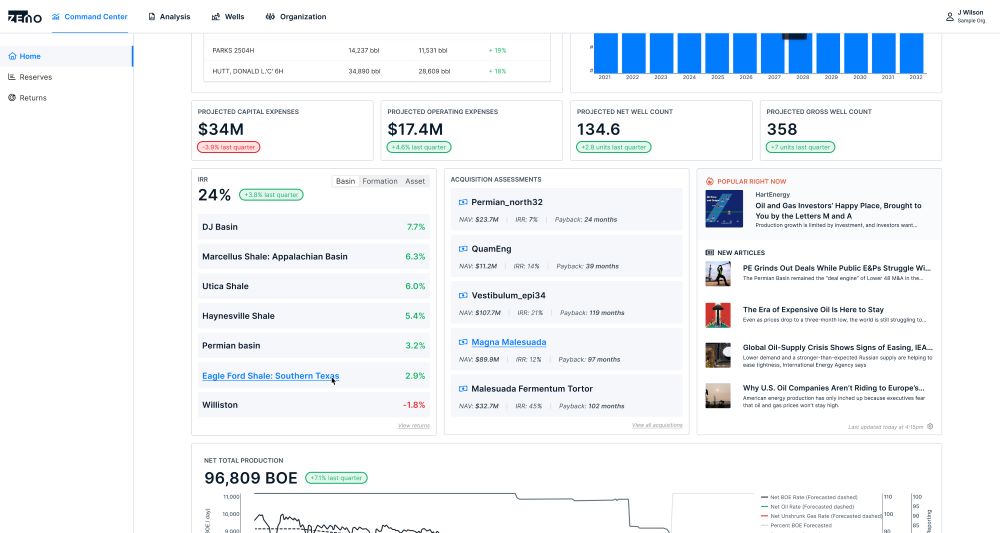
For instance, the operator can see how bringing an acquisition into the company would affect certain metrics, such as cash flows and payback, Graham Coskey, solutions architect at Zeno, said.
In the reserves section, companies can drill deeper into the operating plan and check out individual assets and basins from a financial and production standpoint. Currently, Coskey said, operators often have to go to multiple places to obtain all the data needed to evaluate how assets are performing.
“It’s very difficult to have a holistic view of everything in one place, in one app,” he said.
As Stammers put it, it takes time to get the numbers together, and by the time the information is collated, “they’re running their business looking backward” operating off of old information.
Energy OS updates production and pricing data nightly.
“They no longer need to look at financial performance quarterly or monthly. They can look at it daily,” he said.
The returns section shows payback information, rate of return and charts. It also helps operators identify if they are spending more money than they anticipated on an asset and factors those details into updated forecasts and metrics, Coskey said.
Finally, it allows comparison between different operating scenarios to help with planning and to compare different quarters.
“Comparing plans is difficult today, especially when everything lives in revisions of Excel,” Coskey said.
But comparing plans is important for operators because it allows them to play the “what if” game.

“It allows them to play with different numbers without affecting the data. What if operating costs go up by 5%, or gas or oil prices go down by 5% or oil goes from $120/bbl to $80/bbl?” - Graham Coskey, Solutions Architect at Zeno Technologies
“It allows them to play with different numbers without affecting the data. What if operating costs go up by 5%, or gas or oil prices go down by 5%, or oil goes from $120/bbl to $80/bbl?” Coskey said.
Stammers said this type of software hasn’t been available to the oil industry before because it requires bringing data together from a myriad of sources and blending it into something that people can understand and make decisions based on the data.
The platform is hosted in AWS and runs calculations using computing power from parallel computing, he added.
During onboarding, all the data sources are mapped so Energy OS can receive data on a frequency determined by the client.
“We want everything talking to each other on the back end. We get the systems hooked up so the nightly feed is there,” Coskey said.

Recommended Reading

Dividends Declared in the Week of Aug. 26
2024-08-30 - Here is a selection of dividends declared from select upstream and service and supply companies.

Talos Energy CEO Tim Duncan Steps Down; Mills to Take Helm
2024-08-30 - An analyst said Talos Energy President and CEO Tim Duncan was forced out over share price performance, although other factors may have played a role.

HNR Acquisition to Rebrand as EON Resources Inc.
2024-08-29 - HNR’s name change to EON Resources Inc. and a new ticker symbol, “EONR,” will take effect when trading commences on Sept. 18.

Hunting Wins Contracts for OOR Services to North Sea Operators
2024-08-29 - Hunting is securing contracts worth up to $60 million to deliver organic oil recovery technology to increase recoverable reserves for North Sea operators.

GreenFire Appoints Rob Klenner as President to Deliver Geothermal Solutions
2024-08-27 - As president of GreenFire Energy, Rob Klenner will be responsible for overseeing GreenFire’s geothermal energy projects.