With the winds of last year's merger-and-acquisition gale still swirling through the streets of downtown Calgary, few will not ask what that was all about. The extent of M&A activity, capped by the quintessential Alberta Energy-Pan Canadian combination (living proof that elephants can and will eat elephants), begs the question: how many elephants can one eat and how does one get bigger after running out of elephants? Another important question also comes to surface: is the industry really getting any better? That is, is it finding new supplies of oil and gas and are those supplies adequate to put aside national energy concerns, such as security of supply, and the ultimate cost to the North American consumer? Addressing these and other concerns first requires a glance back and a thorough analysis of the performance of the leading players. Clearly, the future will be guided by these companies that have established a profile of success and respect in the industry. Using research from a study provided by Benjamin Financial Solutions Inc., a Calgary oil and gas software and research firm, a six-year historical evaluation was undertaken to measure the financial and operational performance of 24 of the top North American publicly traded E&P companies. Adjusted to U.S. dollars, both Canadian and U.S. companies were first grouped and evaluated together, and then evaluated by the country in which each had primary operations. Performance measures were evaluated on both a combined and country-specific basis. The purpose was to find answers to a number of key questions. First, what was the six-year growth rate of company assets, including production, reserves and cash flows, and in the absence of more M&A activity, is it safe to assume this growth rate will prevail? Second, how was the historical growth financed and what will be the sources of capital for future growth? Third, what, if any, assumptions can the industry make that it will access sufficient capital, in the form of cash flow and debt and equity issues, to finance the growth? Group results Reviewing the balance-sheet data first by combining both U.S. and Canadian companies reveals that, on a combined basis, total assets grew by a compound annual growth rate (CAGR) of 24% from approximately $39 billion to $114 billion. During the same period, long-term debt increased 22.7% from $12.3 billion to $34.3 billion. On a combined basis, total revenues for 1996-2001 were approximately $180 billion; net earnings were $17 billion and cash flows $66 billion. Year-over-year, revenues grew 16%, earnings 24% and cash flow 22.5%. Operationally the Canadian and U.S. companies performed measurably well. Production had a CAGR of 15% during the period with a corresponding growth in balance-sheet proven reserves of 18%. Proven reserves for the combined 24 companies at year-end 2001 were approximately 19 billion barrels of oil equivalent (BOE) and cumulative production for the period was 7.5 billion BOE. Given the combined proven reserve base of 8.4 billion BOE at year-end 1996, the group adequately replaced its combined production during the period. Crossborder competition Comparing the companies across borders provides some interesting insight into differences that exist. For example, the Canadian companies grew assets 4.3% faster during 1996-2001, compared with their U.S. counterparts. However, daily production grew less than 1% faster on a year-over-year basis compared with the U.S. group and growth in proven reserves increased by a slight margin of 3% when compared with the U.S. companies. The dollar value of assets per proven BOE for both groups grew at approximately the same pace year-over-year; the Canadian group outpacing the U.S. group by only 1%. However, the value of assets per BOE on average for the Canadian group was significantly lower: $4 per BOE versus $5.70 for the U.S. group during the period. Measuring profitability by return on equity (ROE) and return on assets (ROA) reveals both groups were in the same ballpark. The Canadian group averaged ROA of 14% during the period, while the U.S. group came in at 13%. The Canadians performed better on an ROE basis, generating an average of 21% versus the U.S. group's 18% average during the period. In terms of cash flow per BOE, the Canadian group generated $7.40 per BOE produced while the U.S. group averaged $9.60. The Canadian group, however, did slightly better in the net earnings department, generating $2.20 per BOE of earnings versus $2 for the U.S. group. On average, all companies together generated $8.73 of cash flow per BOE, during the period. Price-to-cash-flow multiples steadily declined for both groups on a year-over-year basis. The Canadians saw a decline of almost 7% per year while the U.S. group saw a 6% decline. Future growth challenges To continue at the established growth rate, it is quickly apparent these 24 companies have their jobs cut out for them. Using the compound annual growth rates of assets, reserves and production from the past six years is a good starting point from which to project future capital requirements. As said, the companies collectively increased the value of balance-sheet assets on a year-over-year basis by 24% in the period. Assuming this growth rate in assets continues for the next five years, in the absence of continued M&A activity, the capital that would be required to finance this growth could exceed $200 billion. Assuming proven reserves continue at a CAGR of 17.8%, the group will end the period with approximately 43 billion BOE, having added approximately 24 billion BOE to the balance sheet. If achieved, this would translate into an asset value of $8.33 per BOE of new reserves in the ground. In addition, if BOE-per-day production continues to increase by a CAGR of 15% during the period 2002-2006, this will equate to cumulative production of 13 billion BOE or 68% of the existing proven reserve base. Overall, growth in balance-sheet assets could come from successful exploration and M&A activity. Looking at reserve additions for the period between 1996 and the end of 2000 (2001 data was incomplete at the time of this writing) and breaking out this data by reserve discoveries and extensions versus net reserve acquisitions suggests that M&A activity played a leading role. Net oil acquisitions outpaced new discoveries almost 22%, growing 42% per year versus 20% for discoveries and extensions. Net gas acquisitions for the group grew 62% whereby discoveries grew only 15%-a 47% difference. On a combined basis, total reserve additions, by both acquisitions and discoveries, grew 27% per year. In terms of total net reserve volumes added during the five-year period, 3.7 billion BOE came from acquisitions while 8.1 billion were added through new discoveries. For the period ending 2000, 40% of the total net reserve additions came from acquisitions and for the period ending 2001, updated preliminary data from the U.S. group suggests that as much as 70% of total reserve growth will be from acquisitions. How much capital? Quick math would suggest that if the companies in the Benjamin study continue to generate $8.70 of cash flow per BOE for the next five years, they would fall short of their capital requirements to the tune of $90 billion-an average $3.75 billion per company. To finance the entire growth in assets with cash flow alone would require about $15 per BOE or at least $30 WTI per BOE of sales, using an average ratio of $2 of sales revenue per BOE for each dollar of cash flow per BOE. In the absence of continued M&A activity, the shortfall, therefore, must come from either debt or equity. How much capital can the industry expect from the debt and equity markets? We have already seen a decrease in overall market value measures, which could suggest that the public market may turn a cold shoulder to these investments. Debt levels are also coming down as a percent of total assets, as is the percent of shareholder capital, and we haven't even begun to talk about how future taxes and environmental liabilities are slowly increasing their respective claims on total assets. Assuming the trend towards lower market valuations continues for the next five years, many companies might be left with little choice but to pay a higher cost for new equity. It is also difficult to predict if the financial institutions will be willing to support the historical standard multiple of two times debt to cash flow, which has seen signs of erosion during the past several years. In short, it might be premature to suggest the debt and equity belt-tightening will continue for the next five years but it is realistic to suggest that it is likely. Cameron Smith, managing director of Cosco Capital Management, New York, agrees that times are changing but suggests the changes have been going on for some time now. "What we have seen is a decrease in capital coming from the public equity markets in the U.S. and Canada, coupled by an increase in private capital with a focus in the U.S. on larger equity issues of $50 million or more and in Canada on smaller issues of under $4 million." Smith is confident the trend will continue during the next five years. "There has been an explosion in private capital available for oil and gas investments in the U.S. during the past decade, needed to fill the void left by the public equity market," Smith says. "In 1997, for example, only six private oil and gas capital firms existed, which represented $1.5 billion in available capital. Today, 14 firms exist with combined annual capital investment budgets of $10 billion." This is encouraging news for an industry that has seen an erosion of its market valuation during the past six years, but is the influx of private capital enough to satisfy the appetites of the 24 companies in the study? Andrew Boland, oil and gas analyst with Peters & Co., Calgary, offers an interesting twist: he suggests there is now a "broad market flight back to tangible assets evidenced by a recent expansion of price multiples and share price premiums to net asset values." Boland is confident this short-term trend will continue-approximately $500 million was raised last year in Canada just for small-cap oil and gas firms and there is now a "concentrated interest" in nurturing small caps into large caps and new equity capital will be that driving force. However, when it comes to large-cap producers, Smith and Boland both suggest the market and industry may have to lower expectations of growth-especially if M&A activity slows. Keith Hudson, manager of new ventures with Husky Energy, also agrees expectations might have to be lowered. Husky Energy, for example, would be fulfilling its mandate with a 10% annual growth rate during the next five years, funded primarily with cash flow, he says. Moreover, he doubts the large producer group in general will be rationalizing any significant component of its remaining asset base. "Much of the rationalization is over. The clean-up completed during the previous cycle in the 1990s," Hudson explains. So where do the lending institutions fit in? Despite historically low interest rates in 2001, approximately $7.6 billion in financing charges were paid during the past six years by the 24 companies in the study. Hardly a paltry sum considering that interest rates averaged 6.4% during the period. Debt levels also appear to be maintaining a high percentage of total equity, averaging 84% during the past six years, which might be further indication of sustained interest in financing oil and gas assets. Offsetting what would be normally considered a high leverage ratio are low debt-to-cash-flow multiples and consistently high ROE values for the companies. In addition, the value established as a result of still being around today is significant. Going forward, if the companies can continue to support a 30% debt-to-total-assets ratio, it might be fair to conclude that senior-debt financing will maintain at least that exposure to future asset growth during the next five years. Room for more M&A? Another important statistic from the study results is the number of companies that still exist in the industry that could provide the basis for additional M&A activity. Further consolidation will likely occur among the 24 companies during the short-term; however, outside of this group, there now exists limited opportunities. For example, in the study, an additional 260 publicly traded U.S. and Canadian companies were surveyed and measured for total asset value. On a combined basis, $139 billion of asset value existed at fourth-quarter 2001. Outside of buying assets from private companies and the integrated oil companies, it might be unrealistic to suggest that any further M&A activity will lead to significant asset growth during the next five years for the 24 companies-thus paving the way for concentrated exploration activity, like it or not. Clearly, the industry, guided by many of the companies examined, has some challenges ahead. Most certainly, M&A activity will continue but it could be argued that the degree of contribution to the industry as a whole might be negligible if the only recognizable purpose at this point is to get bigger for the sake of getting bigger. In the final analysis, the one task ahead that will lead all others is the need for the oil and gas industry to find and develop new reserves through old-fashioned exploration. With this challenge comes a heightened need to make sure sufficient capital and opportunities will be available to sustain this effort. M Robb Moss, CFA, is president of Benjamin Financial Solutions Inc., a Calgary firm that specializes in financial analysis software and data management and research for the North American oil and gas industry.
Recommended Reading
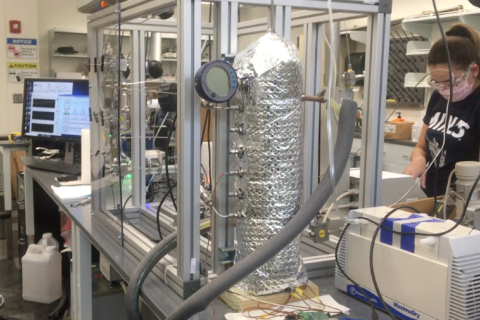
Going with the Flow: Universities, Operators Team on Flow Assurance Research
2024-03-05 - From Icy Waterfloods to Gas Lift Slugs, operators and researchers at Texas Tech University and the Colorado School of Mines are finding ways to optimize flow assurance, reduce costs and improve wells.
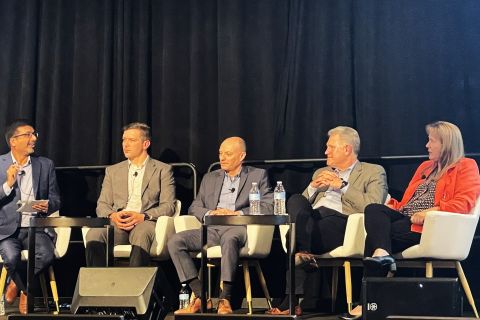
Fracturing’s Geometry Test
2024-02-12 - During SPE’s Hydraulic Fracturing Technical Conference, industry experts looked for answers to their biggest test – fracture geometry.

Haynesville’s Harsh Drilling Conditions Forge Tougher Tech
2024-04-10 - The Haynesville Shale’s high temperatures and tough rock have caused drillers to evolve, advancing technology that benefits the rest of the industry, experts said.
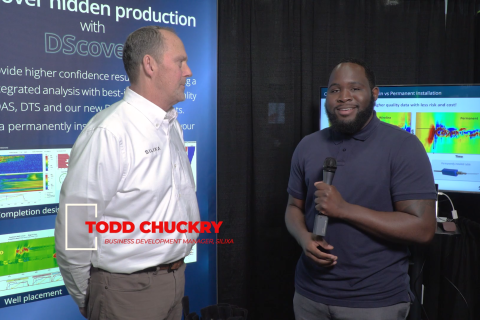
Exclusive: Silixa’s Distributed Fiber Optics Solutions for E&Ps
2024-03-19 - Todd Chuckry, business development manager for Silixa, highlights the company's DScover and Carina platforms to help oil and gas operators fully understand their fiber optics treatments from start to finish in this Hart Energy Exclusive.
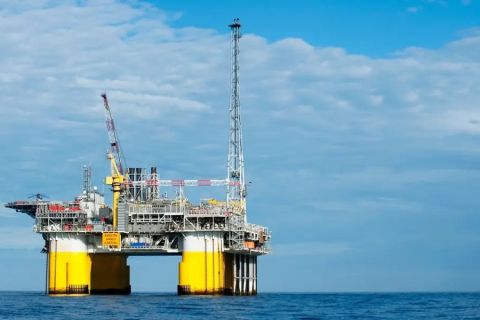
2023-2025 Subsea Tieback Round-Up
2024-02-06 - Here's a look at subsea tieback projects across the globe. The first in a two-part series, this report highlights some of the subsea tiebacks scheduled to be online by 2025.