Sir John Browne's vision for a world-class supermajor, propelled by synergies and cost-cutting after acquiring Amoco, Arco and Vastar Resources, is evidently paying off. For the first time since 1997, BP topped the list of major and integrated oil companies whose upstream financial and operating performance has been ranked by Michael Mayer, managing director and major oils analyst with <$iPrudential Securities >, Menlo Park, California. For the 11th year, Mayer dissected the performance of11 major companies from 1996 through 2000, based on nine performance indicators. <$iBP > became king of the hill because it scored well across the majority of nine indicators and was in the top tier for four: depreciation, depletion and amortization (DD&A) expenses, production income, cash flow and upstream returns. <$iShell > was a close second, also ranking in the top tier of four measures, posting good results in production costs (that is, incurring the lowest costs), production replacement ratio (excluding the effects of mergers and acquisitions), finding and development costs and upstream returns. The lowest overall ranking went to <$iMarathon Oil Co. >, followed by <$iUnocal >. These companies scored lowest on the most of the nine indicators (See chart.) During the five-year period studied, the Group of 11 spent $216 billion to find, develop and acquire oil and natural gas reserves. In the process it replaced 150% of its production at an average cost of $4.86 per barrel of oil equivalent. Through the period, worldwide production costs ranged from $3.92 per BOE in 1999 to a high of $4.45 in 1996. Costs were $4.29 per BOE in 2000, including production taxes. In the U.S. only, production costs were $4.89 per BOE, up 23% from the prior year, the result of much higher revenues leading to higher taxes. Since 1996, <$iRoyal Dutch/Shell > has exhibited the largest decline in worldwide production costs, 36%. <$iPhillips Petroleum > showed the greatest gain, up 41%. The group generated upstream cash flow of $7.90 per BOE and earned $3.70 per BOE. During the period, the spot price of West Texas Intermediate averaged $21.29 per barrel and U.S. natural gas averaged $2.68 per thousand cubic feet. Aggregate net income ranged from $1.47 per BOE in 1998 to $6.93 in 2000. Reserves growth Using standard guidelines as set forth by the Securities and Exchange Commission and the Financial Accounting Standards Board, the net present value of reserves for the group was $5.69 per BOE at year-end 2000, up 35% over 1996. Unocal posted the largest net increase, 72%. Conoco's NPV rose 66% and BP's rose 52%. Only four companies were able to increase their worldwide BOE reserves from 1996 to 2000 by more than 20%: <$iTotalFinaElf >, <$iTexaco >, <$iConoco > and Phillips Petroleum, which led in this category by increasing its BOE reserves by 133%. The latter's acquisition of North Slope reserves from Arco Alaska (BP) turned the tide. Upstream returns Upstream returns, or cash out as a percent of cash in, have risen dramatically since 1990, Mayer points out. The industry generated cash flow of $11.36 per BOE produced in 2000-some 240% of the average cost of replacing production through drilling and acquisitions over the 1995-99 period. This was much higher than the more typical 125% to 175% seen throughout most of the 1990s. Over the five-year period, Royal Dutch/Shell managed to bring in the highest cash flow as a percentage of costs incurred (2000 cash flow versus costs for 1995-99). It reported 367%, followed by BP at 341%, TotalFinaElf at 294%. The lowest performer in this category over the same period was Unocal with 165%, Phillips with 179% and Amerada Hess with 194%. Over time, it is interesting to watch the players move up and down in these rankings as their individual exploration success, debt ratios and financial results change. For example, in 1990, the first year Mayer conducted the study, Phillips Petroleum came in first and BP (absent Amoco and Arco) was last, in 10th place. In 2000, these two companies swapped positions: BP was first and Phillips was ninth. In 1992 Conoco ranked 15th, yet through the 1990s it rose steadily, to reach number one in 1998 and 1999. This past year it slipped back to third What does relative size and performance mean to a company's future? Mayer notes that three of the bottom four performers in 1998 (Arco, Mobil and Elf Aquitaine) have since been acquired by stronger, larger competitors. If Mayer's annual study is any indicator, the trend seems to be working still: Chevron, which is in the process of acquiring Texaco, outranked its merger partner every year from 1992 through 2000. On the other hand, <$iAmerada Hess > has climbed slowly but steadily in the rankings, moving from last place in 1994 to fifth in 2000. With its recent announcement that it will buy <$iTriton Energy, > will Amerada rise even higher in Mayer's study by 2002 or 2003?
Recommended Reading

Occidental Increases Annual Dividend by 22%
2024-02-11 - Occidental Petroleum Corp.’s newly declared dividend is at an annual rate of $0.88 per share, compared to the previous annual rate of $0.72 per share.

Atmos Energy Announces Quarterly Dividend
2024-02-11 - Atmos’ dividend marks the company’s 161st consecutive quarterly dividend.

From Restructuring to Reinvention, Weatherford Upbeat on Upcycle
2024-02-11 - Weatherford CEO Girish Saligram charts course for growth as the company looks to enter the third year of what appears to be a long upcycle.

Atlas Energy Solutions Declares Dividend
2024-02-09 - Atlas Energy’s dividend represents a 5% increase from the previous quarter’s dividend.
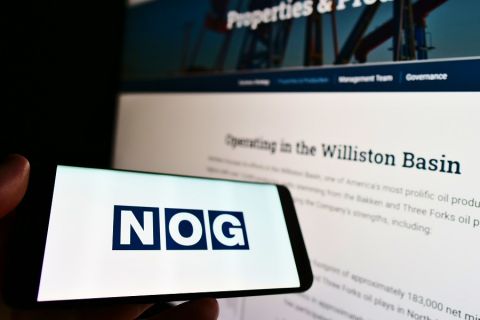
Northern Oil and Gas Ups Dividend 18%, Updates Hedging
2024-02-09 - Northern Oil and Gas, which recently closed acquisitions in the Utica Shale and Delaware Basin, announced a $0.40 per share dividend.