
On a gloriously sunlit, red letter day in West Texas last February, the main discussion at the Midland Petroleum Club centered on the dramatic transformation of the Permian Basin. Later, privately, the talk turned to how long good times would last. The consensus? Zero to three years, with some old-timers favoring the shorter forecast.
Fast forward to 2015. The old-timers were right, thanks to a rediscovered four-letter acronym: O, P, E, and C. Perhaps the alphabet provides the best tool for forecasting 2015 oil and gas activity. Will the current downturn resemble the letter V, W, U or L?
Whatever the letter, the world has changed since that February afternoon in Midland.
Until October 2014, the meme was that oil was a global commodity and rising production from the tight formation revolution would be unable to do to oil prices what rising gas production did to domestic natural gas prices earlier this decade.
OPEC singlehandedly altered the global oil narrative from a demand-driven bull case that required crude exports to sustain the domestic industry into a bearish meme about an oversupplied market.
Consequently, interest in a 2015 outlook has grown sharper as the impacts of the late 2014 price decline work through operator bank accounts.
At $70 oil, $215 million has been shaved out of domestic industry daily crude oil revenues, according to Hart Energy’s industry revenue model, a 27% drop versus last summer’s peak. Monthly revenues for crude oil have fallen to third-quarter 2012 levels, which was not a happy time for oilfield services companies.
Monthly industry revenues from oil, natural gas and natural gas liquids neared the $40 billion threshold during last summer’s peak (and got within shouting distance of the all-time peak in 2008 of $42 billion). Currently, revenues are closer to $30 billion, or levels similar to the second and third quarters of 2013, which was actually an expansionary period in domestic crude oil production and associated drilling activity.
But the sky is no longer the limit. Expectations of an activity drop have grown from 10% of the rig count initially to 25% of the rig count in a sub-$70 oil world.
That translates into about 500 fewer active rigs in 2015. Compounding the situation is a deteriorating high-yield debt market for energy, which fueled the outspend in drilling despite little free cash flow as operators worked to unlock the secrets of tight formation oil plays across the U.S.
Operators are responding by cutting capex—early estimates range from 8% to 15% for 2015 at $70 oil.
Operators are pushing service providers for price reductions, signing shorter contracts, and looking to shave costs, partly by moving away from expensive massive sand slickwater fracs in areas like the Williston Basin in favor of crosslink or hybrid gel completions that may be more expensive on a per-stage basis, but make sense on better economic yield as lower commodity prices negatively impact the trend towards enhanced completions.
Commodity prices are also impacting manufacturing. Some operators in both the Bakken and Marcellus plays were cancelling newbuild rig orders at the end of 2014, according to Hart Energy market intelligence surveys.
Some momentum will roll into 2015. Pressure pumpers working the Bakken expect demand to linger into first-quarter 2015 on the basis of previous commitments before tailing off. Contractors in that same market intelligence survey pointed to work slowing in Wyoming at press time in early December.
Despite the cuts, domestic oil production will still rise in 2015, though at a lower rate. It is possible to predict where activity will decline. If it’s noncore, it’s unsustainable at pricing below $70, no matter whether operators are in the Bakken, Permian Basin, or Eagle Ford.
Pullbacks are on tap for emerging plays such as the Tuscaloosa Marine Shale and Mississippi Lime as well as portions of the Niobrara in the D-J and Powder River basins. Also look for the pace to slow offshore as operators delay spending on larger projects.
And that gets back to the alphabet forecast. What started in mid-November 2014 as anticipation that the industry would drill through a V-shaped recovery has morphed, post-OPEC, into expectations of a U-shaped downturn with a bottom in the first half of 2015.
With recovery a 2016 event, that leads to the final two alphabet letters to describe oil and gas in 2015, which is more A&D.
Recommended Reading
Asia Spot LNG at 3-month Peak on Steady Demand, Supply Disruption
2024-04-12 - Heating demand in Europe and production disruption at the Freeport LNG terminal in the U.S. pushed up prices, said Samuel Good, head of LNG pricing at commodity pricing agency Argus.
Texas LNG Export Plant Signs Additional Offtake Deal With EQT
2024-04-23 - Glenfarne Group LLC's proposed Texas LNG export plant in Brownsville has signed an additional tolling agreement with EQT Corp. to provide natural gas liquefaction services of an additional 1.5 mtpa over 20 years.
Exclusive: Chevron Balancing Low Carbon Intensity, Global Oil, Gas Needs
2024-03-28 - Colin Parfitt, president of midstream at Chevron, discusses how the company continues to grow its traditional oil and gas business while focusing on growing its new energies production, in this Hart Energy Exclusive interview.

Midstream Builds in a Bearish Market
2024-03-11 - Midstream companies are sticking to long term plans for an expanded customer base, despite low gas prices, high storage levels and an uncertain political LNG future.
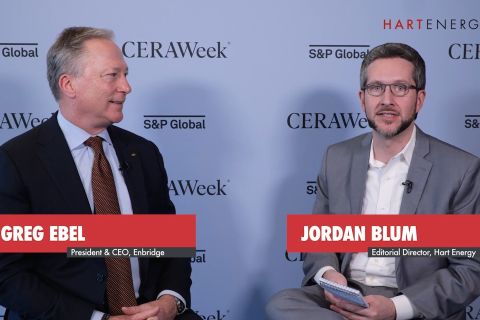
Exclusive: Renewables Won't Promise Affordable Security without NatGas
2024-03-25 - Greg Ebel, president and CEO of midstream company Enbridge, says renewables needs backing from natural gas to create a "nice foundation" for affordable and sustainable industrial growth, in this Hart Energy Exclusive interview.