All oil and gas exploration, production and processing operations continue to face increasing pressure to be more efficient in meeting their business targets. This goal requires finding new and faster ways for work teams to analyze information, make decisions and take action without compromising process integrity. Teams in all areas—from upstream to downstream operations and among different functional areas—have to collaborate to fully meet business objectives. For a group to reach a common interpretation and conclusion, it must be able to look at the same information and key performance indicators (KPIs).
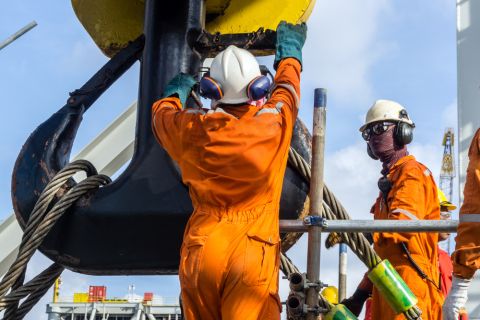
On drilling and production platforms, oil and gas producers are going into deeper water and drilling at greater depths into formations at higher temperatures and pressures. The cost and potential hazards of these operations are high, but so are the rewards if the operation is successful.
Many different systems and data sources are used from all parts of the process. These provide information that needs to be put in context and viewed by many different disciplines for the successful drilling, completion and production of hydrocarbons from the asset. Giving the entire production team the same view of data, drawings, trends, live video and other real-time operation information facilitates true collaboration and is essential to accurate assessment of any production situation and informed decisions on what actions need to be taken (Figure 1).
The manual collection of information from all processes related to the production platform is time-consuming and imperfect at best. It can slow down the decision-making process or even lead to wrong decisions based on older, poor-quality or incomplete data. When managers or operators meet to discuss the challenges and tasks ahead, the accurate display of trends, requirements and bottlenecks is essential to the identification of priorities and actions. Traditional tools usually don’t provide a comprehensive enough view of what is happening on the platform.

FIGURE 1. All oil and gas exploration, production and processing operations continue to face increasing pressure to be more efficient in meeting their business targets. True collaboration between the entire production platform team is essential to meeting this goal. (Source: ABB)
New generation with newer expectations
As the automation and operations workforce demographics continue to change, younger team members are looking for different, more modern tools to do their jobs more effectively. Members of the new generation of operators and engineers entering the oil and gas industry have different expectations on how they will access routine and critical information, what tools they can use and how these tools should perform. They will also use different approaches to collaborate with their extended work team.
Today’s generation is used to accessing information everywhere and anywhere from their smartphones and tablets and expects intuitive, easy-to-use-and-understand interfaces. Access to information must be direct, interactive and quick, and the ability to collaborate with their work team must be the same.
A number of new solutions harness today’s interactive mobile technologies to help oil and gas producers. One of these solutions is ABB’s 800xA Collaboration Table (Figure 2).
Operator interface of the future
The Collaboration Table merges gaming and 3-D technology, uses ABB’s 800xA integration platform and incorporates its ergonomic display technology. It automatically collects data from different sources in the field and then represents KPIs in an intuitive manner in conjunction with live process data.
Using an interactive screen, operators can easily access information from various processes and pinpoint what actions need to be taken in their respective areas. The display is a highly intuitive interface and window into platform operations representing the fusion of an enterprise management system with tactile smartphone technology.
The system’s functionality is not restricted to the mere collection of data. The display unit is a large touch screen, rather like an oversized tablet. It displays the platform in three dimensions with its KPIs. The platform is shown as a 3-D model of the actual structures and equipment.
Using intuitive touch and multitouch functions known from smartphones and tablets, the displayed model can be rotated to bring different elements to the foreground. Users also can zoom into specific elements to enlarge details, permitting additional data to be displayed. The viewer can seamlessly move from the overall platform KPIs to lower level KPIs and further down to individual process variables.

FIGURE 2. The Collaboration Table provides a 3-D overview of a platform, site or location and adds more clarity by showing the information in its proper context. It can visualize a specific site, location or part of the process by using 3-D graphics can and render KPIs on top of these using different kinds of displays. (Source: ABB)
Intuitively following chain of effects
KPIs and variables can be displayed in different formats ranging from simple figures to historic trends. Color coding allows the instant highlighting of values that require attention. A KPI that falls below a defined threshold draws attention to itself by changing from a green (all is well) to a yellow (caution) color coding. A further negative development makes it red.
An example of such a trend might be an increase in the volume of waste/rejects, which in turn might be caused by maladjustments in the underlying process. Besides variables extracted directly from the process, values from other inputs can be displayed in a similar manner.
The tool makes it easy to intuitively follow the chain of effects from the problematic KPI down to the root cause, which could be in a completely different part of the process. Trending tools help differentiate between random fluctuations and genuinely slipping performance and help the collaboration team decide what issues need to be tackled with the greatest urgency.
The KPI application provides a 3-D overview of a platform, site or location and adds more clarity by showing the information in its proper context. It can visualize a specific site, location or part of the process by using 3-D graphics, and it can render KPIs on top of these using different kinds of displays.
With intuitive user interfaces and multitouch interaction, the model can be rotated to bring different elements to the foreground. The interaction tool allows the user to zoom in and enlarge details, displaying additional data. The viewer can seamlessly move from the overview level to a lower level view and display lower level KPIs further down to individual process variables.
The Collaboration Table provides a new way of presenting information on different levels from an enterprise overview to process KPIs on a detailed object. It can interface with numerous data sources and access real-time process data and historical data from other automation systems from other third-party systems such as business planning and accounting systems.
More importantly, it serves as a useful tool to gather the relevant data and package it on an intuitive platform so everyone on the team can collaborate on the best course of action to meet the immediate process and long-term business objectives.
Recommended Reading
Texas LNG Export Plant Signs Additional Offtake Deal With EQT
2024-04-23 - Glenfarne Group LLC's proposed Texas LNG export plant in Brownsville has signed an additional tolling agreement with EQT Corp. to provide natural gas liquefaction services of an additional 1.5 mtpa over 20 years.

US Refiners to Face Tighter Heavy Spreads this Summer TPH
2024-04-22 - Tudor, Pickering, Holt and Co. (TPH) expects fairly tight heavy crude discounts in the U.S. this summer and beyond owing to lower imports of Canadian, Mexican and Venezuelan crudes.

What's Affecting Oil Prices This Week? (April 22, 2024)
2024-04-22 - Stratas Advisors predict that despite geopolitical tensions, the oil supply will not be disrupted, even with the U.S. House of Representatives inserting sanctions on Iran’s oil exports.
Association: Monthly Texas Upstream Jobs Show Most Growth in Decade
2024-04-22 - Since the COVID-19 pandemic, the oil and gas industry has added 39,500 upstream jobs in Texas, with take home pay averaging $124,000 in 2023.

What's Affecting Oil Prices This Week? (Feb. 5, 2024)
2024-02-05 - Stratas Advisors says the U.S.’ response (so far) to the recent attack on U.S. troops has been measured without direct confrontation of Iran, which reduces the possibility of oil flows being disrupted.