(Source: Hart Energy)
[Editor's note: A version of this story appears in the May 2020 edition of Oil and Gas Investor. Subscribe to the magazine here.]
While energy markets continue to be volatile, fewer oil and gas producers have hedges in place than in prior years. In addition, a number of producers hedged with strategies containing sold puts on large portions of their production. This essentially creates a trapdoor where a company doesn’t have price protection below the strike price of the sold put, which for some is anything less than $45/bbl on crude.
The following is a survey of 30 of the largest public oil and gas E&P companies and their hedging activities as disclosed in their Dec. 31, 2019, 10-K filings. It also includes comparisons to the same survey done in the prior year.
The first trading day of 2019 was the lowest daily closing price achieved by the prompt WTI futures contract in 2019 at $46.54/bbl. From there, it was a rocky ride between closing prices from around $50/bbl to $65/bbl for the remainder of the year. The crude price crash in early March 2020 that took prices down to nearly $30/bbl surprised many. Natural gas prices followed an unusual path in 2019. Early in 2019, the prompt natural gas futures price reached just above $3.50/MMBtu, similar to price levels in early 2018. However, the average closing price for the prompt natural gas contract during the final two months of 2019 was about $1.55/MMBtu lower than the average closing price for the final two months of 2018. Natural gas prices have dipped well below $2/MMBtu in early 2020.
The following survey provides as much information as possible based on information disclosed in regulatory filings. U.S. GAAP accounting rules form the minimum disclosures companies must provide in their filings to provide users these understandings:
An entity’s use of hedges;
How the hedges and the hedged production are accounted for in the filing; and
How the hedges affect the financial statements.
While the accounting rules require entities to disclose the level of an entity’s derivative activity, there can be variance in practice as to how much information a company discloses about the instrument types, volume of production hedged and the average hedge price.
Why hedge?
Upstream companies have relatively straightforward objectives, which are to search for, develop and extract hydrocarbons. These activities are very capital intensive and require large amounts of cash. Companies need enough cash flow, not only to support a level of capex and exploration activity to ensure that oil and gas continues to flow but also to make debt payments, comply with debt covenants and support general and administrative costs. Hedging programs at upstream companies are developed with the primary purpose of providing a level of cash flow to increase the likelihood of meeting those needs.
Without the protection of an effective hedging program, an upstream company’s cash flows are subject to the volatility of the market. An upstream company without hedges will benefit from higher market prices, but they have a very short amount of time to react when market prices decline. This is a predicament many upstream companies experienced during the 2014 price downturn and what many experienced in early March 2020.
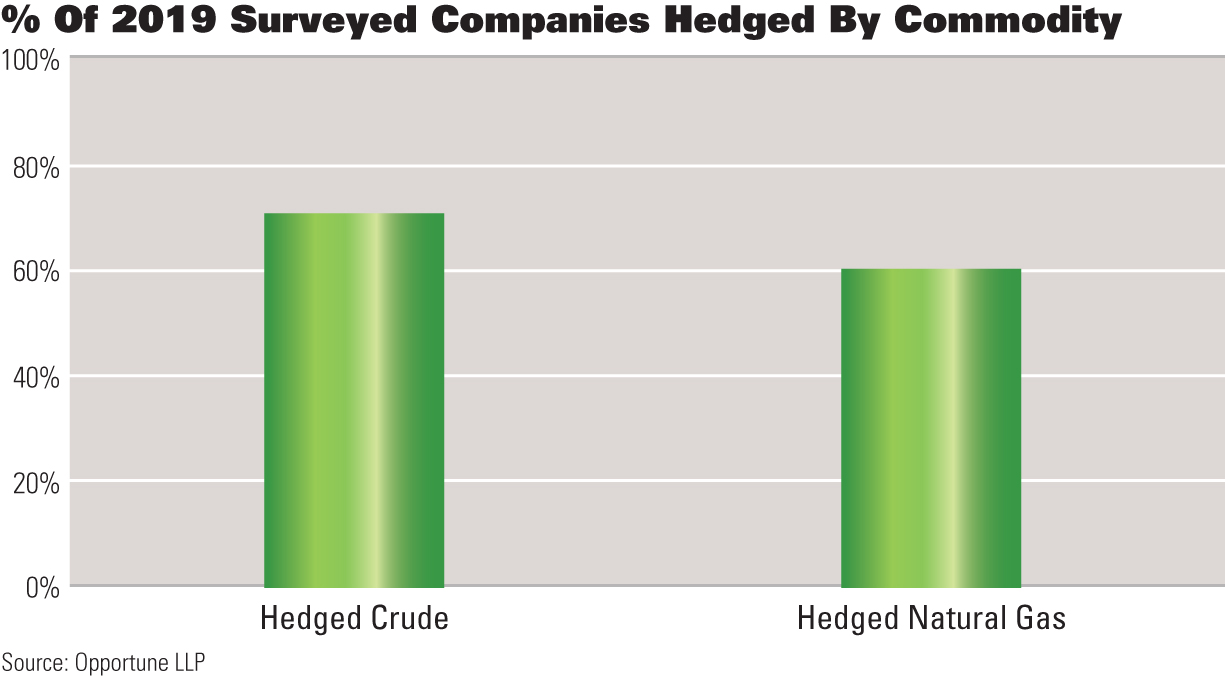
The following outlines the percentage of companies in the survey that maintained hedges as of Dec. 31, 2019, for crude, natural gas or NGL. Consistent with prior years, it’s clear that the majority of public oil and gas producers maintain hedging programs. However, fewer companies had hedges than in prior years. Twenty-five of the 30 upstream energy companies surveyed, or 83%, had hedges on the books as of Dec. 31, 2019. This was down from 93% as of Dec. 31, 2018. As of Dec. 31, 2019, 70% of the surveyed companies had crude hedges in place, and 60% had gas hedges in place.
Types of instruments
While some companies will state that they have a hedging program and have executed hedges, investors should carefully consider the types of instruments utilized. The downside protection provided by some instruments may not be that significant. The following notes the number of companies holding various instrument types in their hedging portfolio.
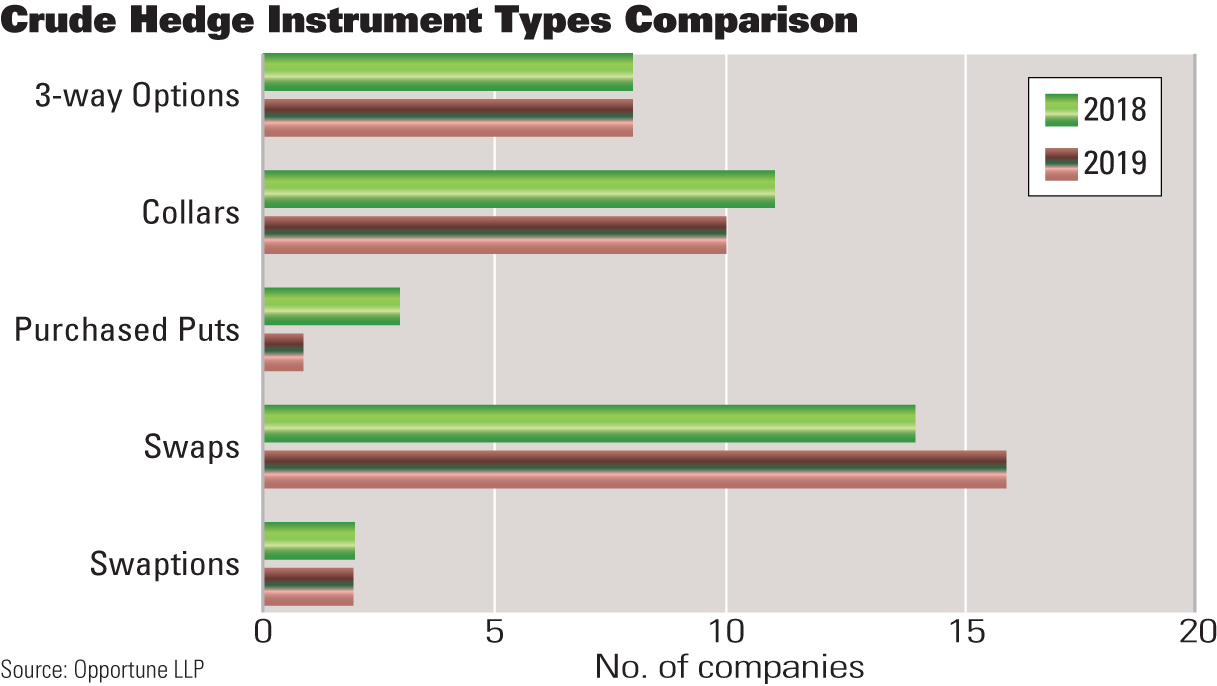

Of the companies reviewed, swaps continue to be the preferred instrument for both natural gas and crude. For a producer, swaps provide the highest amount of
downside protection. However, swaps limit upside price participation. This leads producers to utilize purchased puts, which can be costly, or costless collars, which allow the producer to participate within a range of price movements.
Other instruments noted in the survey were swaptions, three-way options and put spreads. Swaptions, often used to raise a strike price by allowing a counterparty to increase the volume or lengthen the tenor of the contract at its discretion, continue to represent a minority of the instrument types utilized by the public companies.
Three-way collars and, to a lesser extent, put spreads (purchased put and sold put) continue to exist. Many producers were hurt by strategies containing sold puts during the 2014 price collapse as they contain what some consider a trap door. For example, a producer that entered into a three-way option with a $45/bbl sold put, $50/bbl purchased put and $60/bbl sold call would participate in price movements between $50/bbl and $60/bbl.
However, once the price goes below $45/bbl, the company would have no downside protection. This was particularly painful for many producers in 2014 that had sold puts in the $65/bbl to $75/bbl range under the belief that prices wouldn’t go below those levels. Opportune is seeing this pattern again in early 2020 where current oil and gas market prices are below sold put strikes. There’s no downside protection beyond the strike price of the sold puts. Producers hedging chunks of the production with these instruments were definitely not prepared.
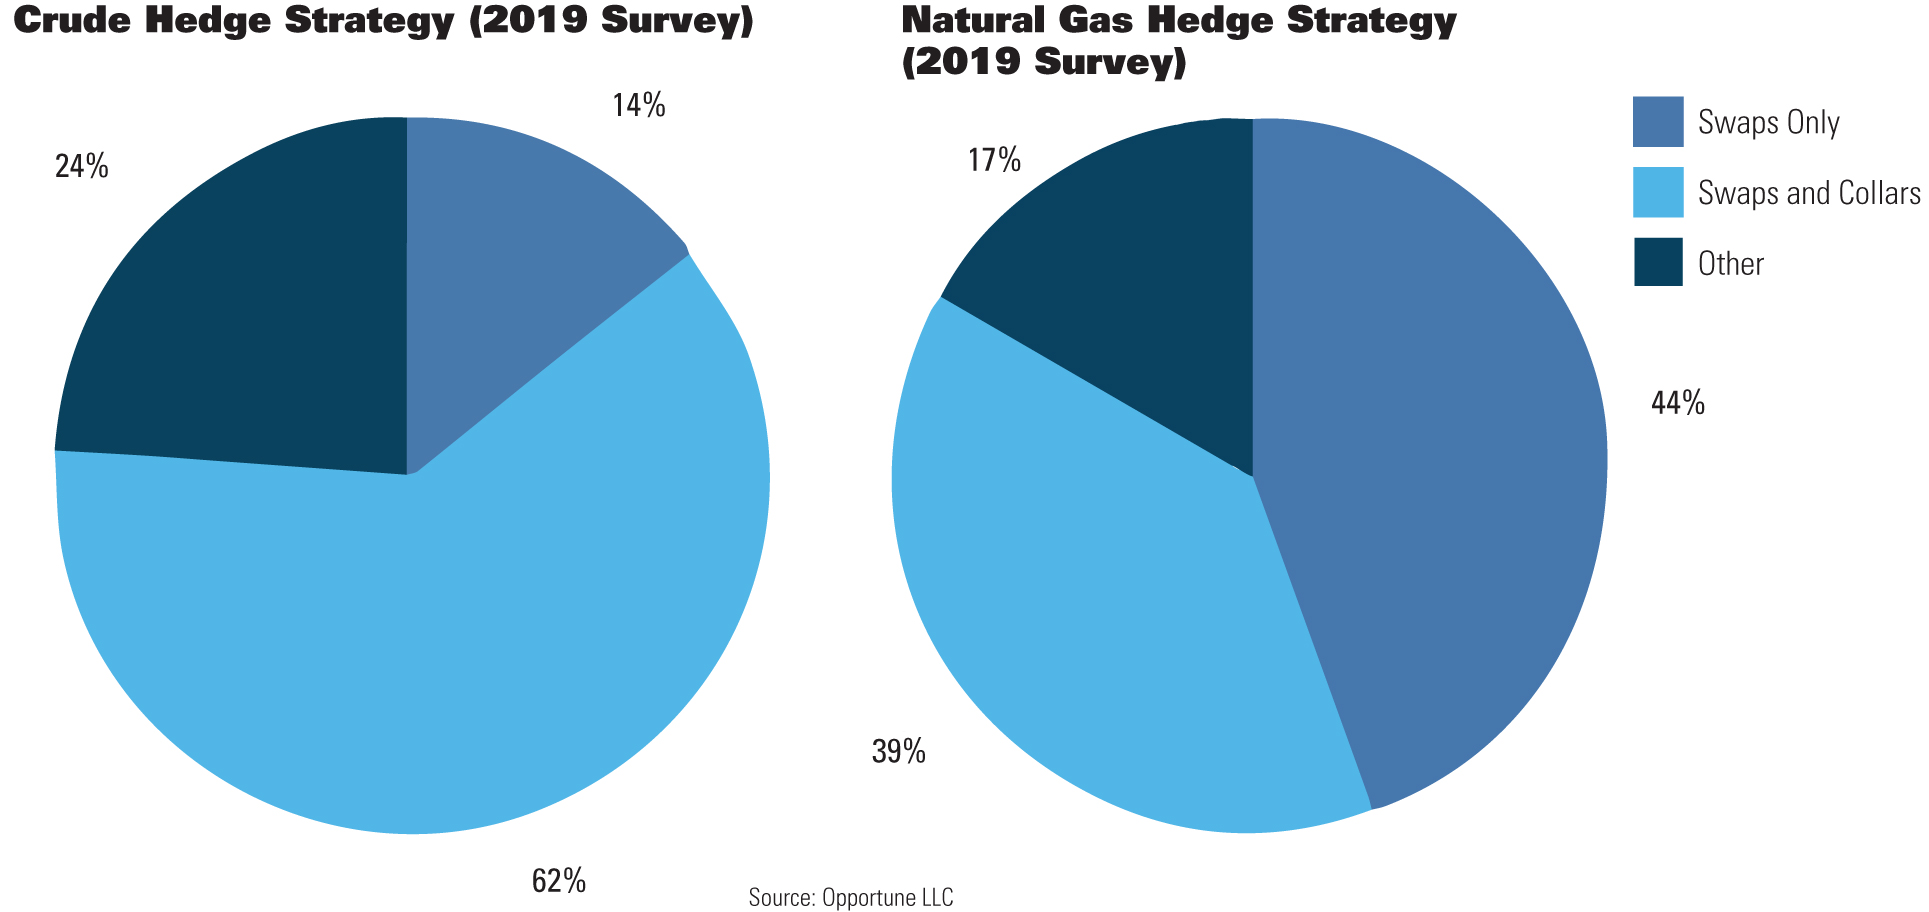
A strategy utilizing both swaps and collars was common for both crude and natural gas. The types of instruments used for gas remained generally consistent with the prior year, with over 80% of hedging companies utilizing either exclusively swaps or both swaps and collars. The use of crude collars and three-way collars remained consistent in 2019 compared to 2018.
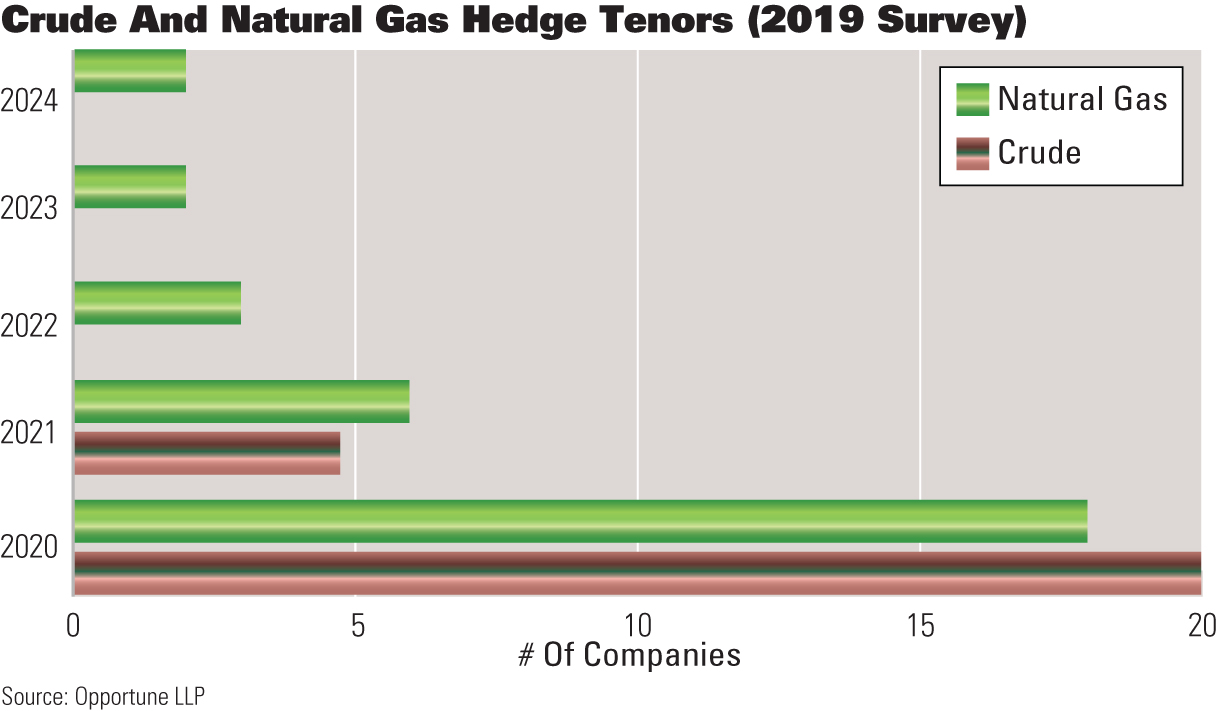
Length of hedging
When executing a hedging program, many companies are challenged with how far out to hedge their production. If prices increase over time, they largely give up upside. However, if prices drop, it allows a company to weather the storm for a longer period. Based on the survey results, it’s common for companies to hedge some level of the prompt 12-month period representing calendar 2020. None of the companies hedged crude beyond 2021, while a handful of companies hedged natural gas in 2022 to 2024.
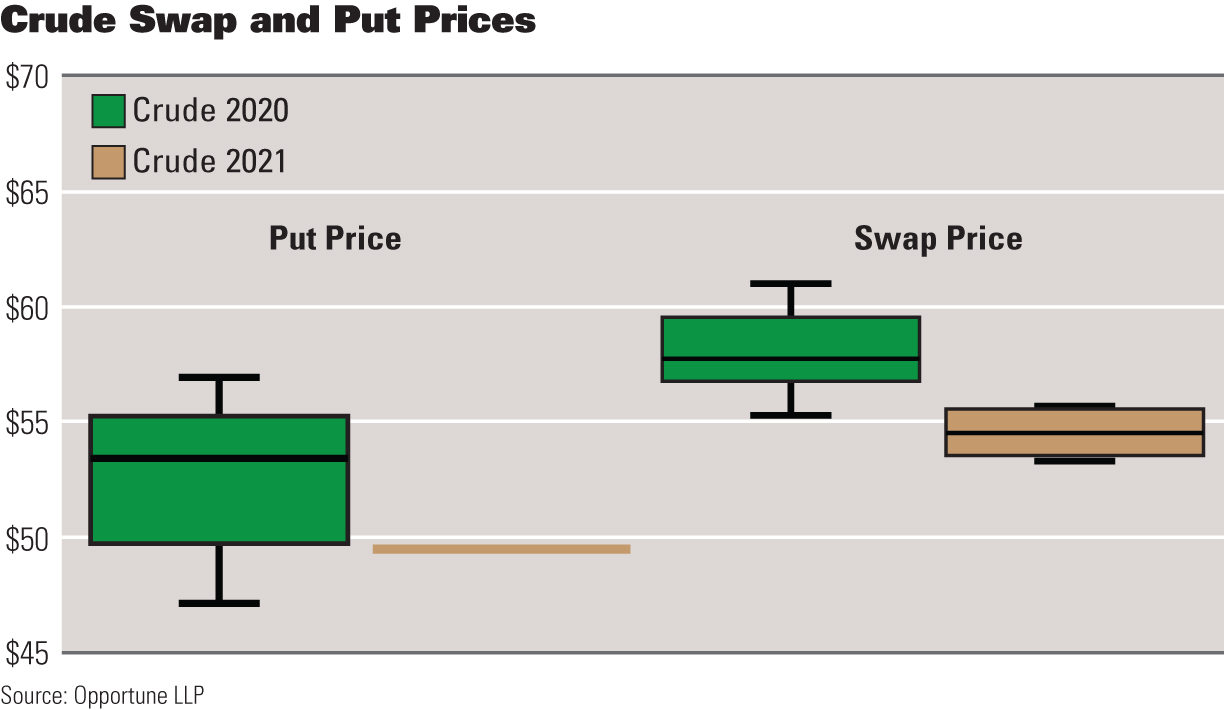
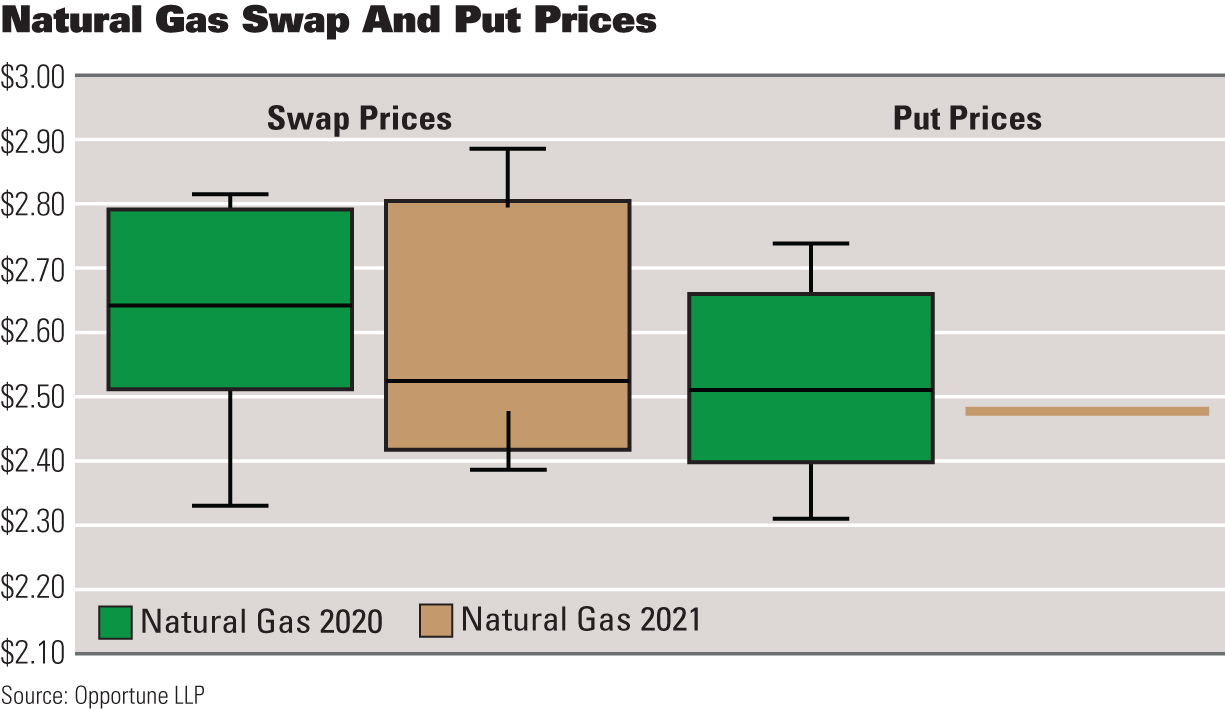
Price levels
The ability to only hedge at the top of the market is impossible. The decision of when to hedge and at what price level is rooted more in the risk management policy of providing predictable cash flows than in an ability to predict prices. As a hedging program is intended to increase cash-flow predictability, the price level at which companies execute hedges is often heavily influenced by operating budgets and debt compliance.
Of the 25 companies that disclosed that they had hedges on their books at the end of 2019, 20 gave their average prices for WTI Cushing crude, Henry Hub natural gas or both. The average swap price for crude was $58.41/bbl for 2020 and $54.52/bbl for 2021. The average swap price for natural gas was $2.58/MMBtu for 2020 and $2.54/MMBtu for 2021. The average collar put price (non-three way) for crude was $53.48/bbl for 2020 and $49.68/bbl for 2021. The average collar put price (non-three way) for natural gas was $2.45/MMBtu for 2020 and $2.38/MMBtu for 2021. The average sold put prices in 2020 were $45.70/bbl for crude and $2.15/MMBtu for gas.
Hedge coverage
Consistent with prior years, few companies disclosed the amount of their forecasted production that was hedged as of Dec. 31, 2019. Only four companies disclosed a percentage of forecasted production hedged. For companies that did disclose this information, the average hedge level for crude was 61% of forecasted 2020 production and, for natural gas, was 42% of forecasted 2020 production. Note that these hedge levels include coverage provided by three-way options.
In summary, fewer E&Ps had hedges in place at Dec. 31, 2019, than in prior years, and sold puts continue to exist in many hedge portfolios. Companies with strong hedge books have a better ability to try to weather the storm. Those companies that were not appropriately hedged are struggling.
The implementation of a hedging program can be a tool that helps a company ensure certainty of cash flow and perhaps avoid filing bankruptcy. Management teams are encouraged to consider the various alternatives and strategies that a hedging program can provide in meeting their ever-changing business plans.
Shane Randolph is a managing director at Opportune LLP and assists companies and financial institutions throughout North America, South America, Europe and Asia-Pacific in their understanding of what is possible as they deal with the challenges of implementing risk management programs and highly technical accounting pronouncements. Josh Schulte is a manager in Opportune LLP’s commodity risk management advisory group and assists companies with developing and executing complex risk management programs.
Recommended Reading

AI Highs: Corva Predictive Drilling Powers Oilfield Efficiency
2024-05-20 - The energy sector is buzzing with talk of artificial intelligence, and Corva is capitalizing on its ability to synthesize complex data to optimize drilling operations with predictive drilling software.

Kimmeridge’s Mark Viviano on Reshaping the Energy Sector, SilverBow-Crescent Deal
2024-05-16 - Kimmeridge Energy Engagement Partners’ Mark Viviano says the company is evaluating the Crescent Energy and SilverBow Acquisition and how Kimmeridge played a key role in transforming the shale sector in this Hart Energy Exclusive interview.

SUPER DUG: Shale 4.0 Era about Building Scale- Rystad
2024-05-16 - The Shale 3.0 era or capital discipline era will be followed by the Shale 4.0 era, which will see companies focused on building scale, according to Rystad Energy Senior Shale Analyst Matthew Bernstein.

Adkins: Attacks on Fossil Fuels, Overregulation Poised to Backfire
2024-05-17 - Raymond James’ J. Marshall Adkins tells Hart Energy’s SUPER DUG conference attendees demonizing oil and gas, strenuous regulations and continued inflation are bound to have unexpected consequences for E&P opponents.