(Source: Hart Energy)
[Editor's note: A version of this story appears in the January 2020 edition of Oil and Gas Investor. Subscribe to the magazine here.]
In the oil and gas industry, counting is everywhere—active rigs, barrels produced, dollars earned (or lost) and, of course, wells drilled.

principal analyst
Narmadha
Navaneethan said
her group carries
a net DUC count
consisting of
wells available for
completion today.
Counting wells is a fairly straightforward exercise until you reach the drilled but uncompleted, or DUC, phase.
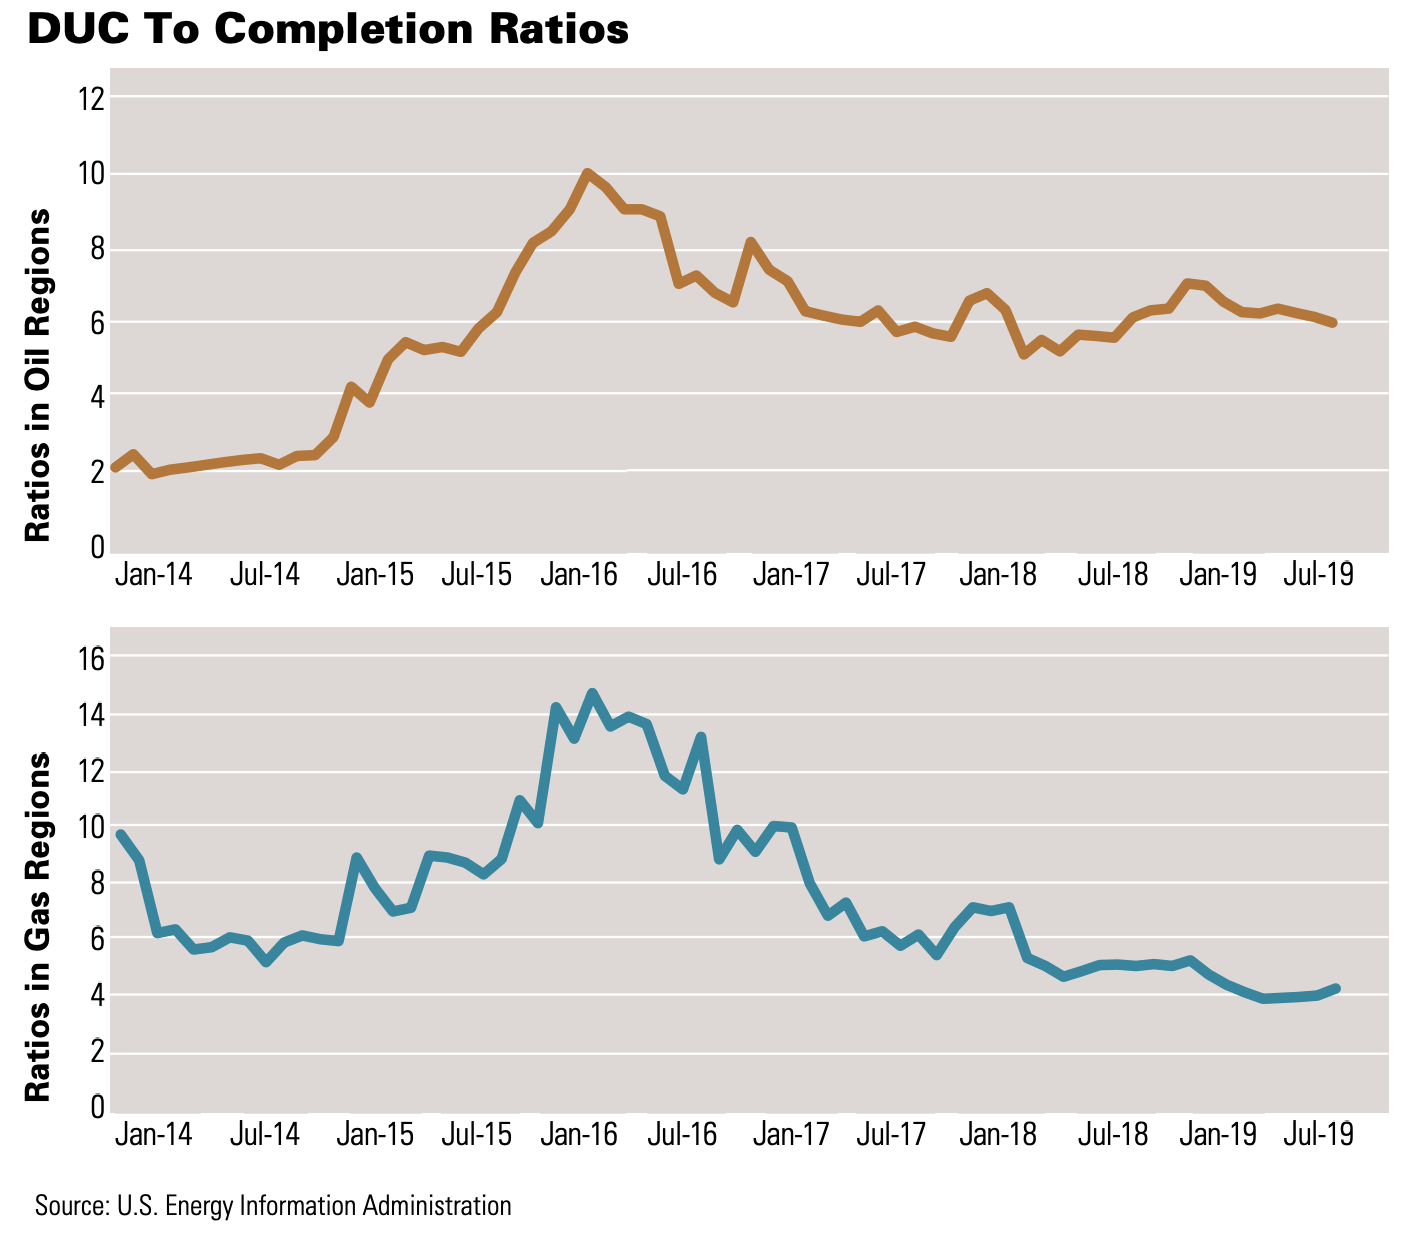
DUCs are counted for several reasons, the most prominent of which is to gauge size and timing of the domestic supply response to changes in oil prices, with or without significant changes in the number of active drilling rigs. The more DUCs there are, the faster reaction time the industry can have to increase production. Fewer DUCs mean less opportunities for swift supply additions.
What’s a DUC? ... and how to count them
In simplest terms, a DUC is a drilled but uncompleted well. That means that a rig was used to drill a bore to target depth, but no completion work—the prep needed to bring the well onstream—has been conducted: no production casing, no cement, nothing. This is basically how the U.S. Energy Information Adminstration (EIA), the federal agency that is the keeper of most statistics related to the nation’s energy production, including DUCs, defines them.
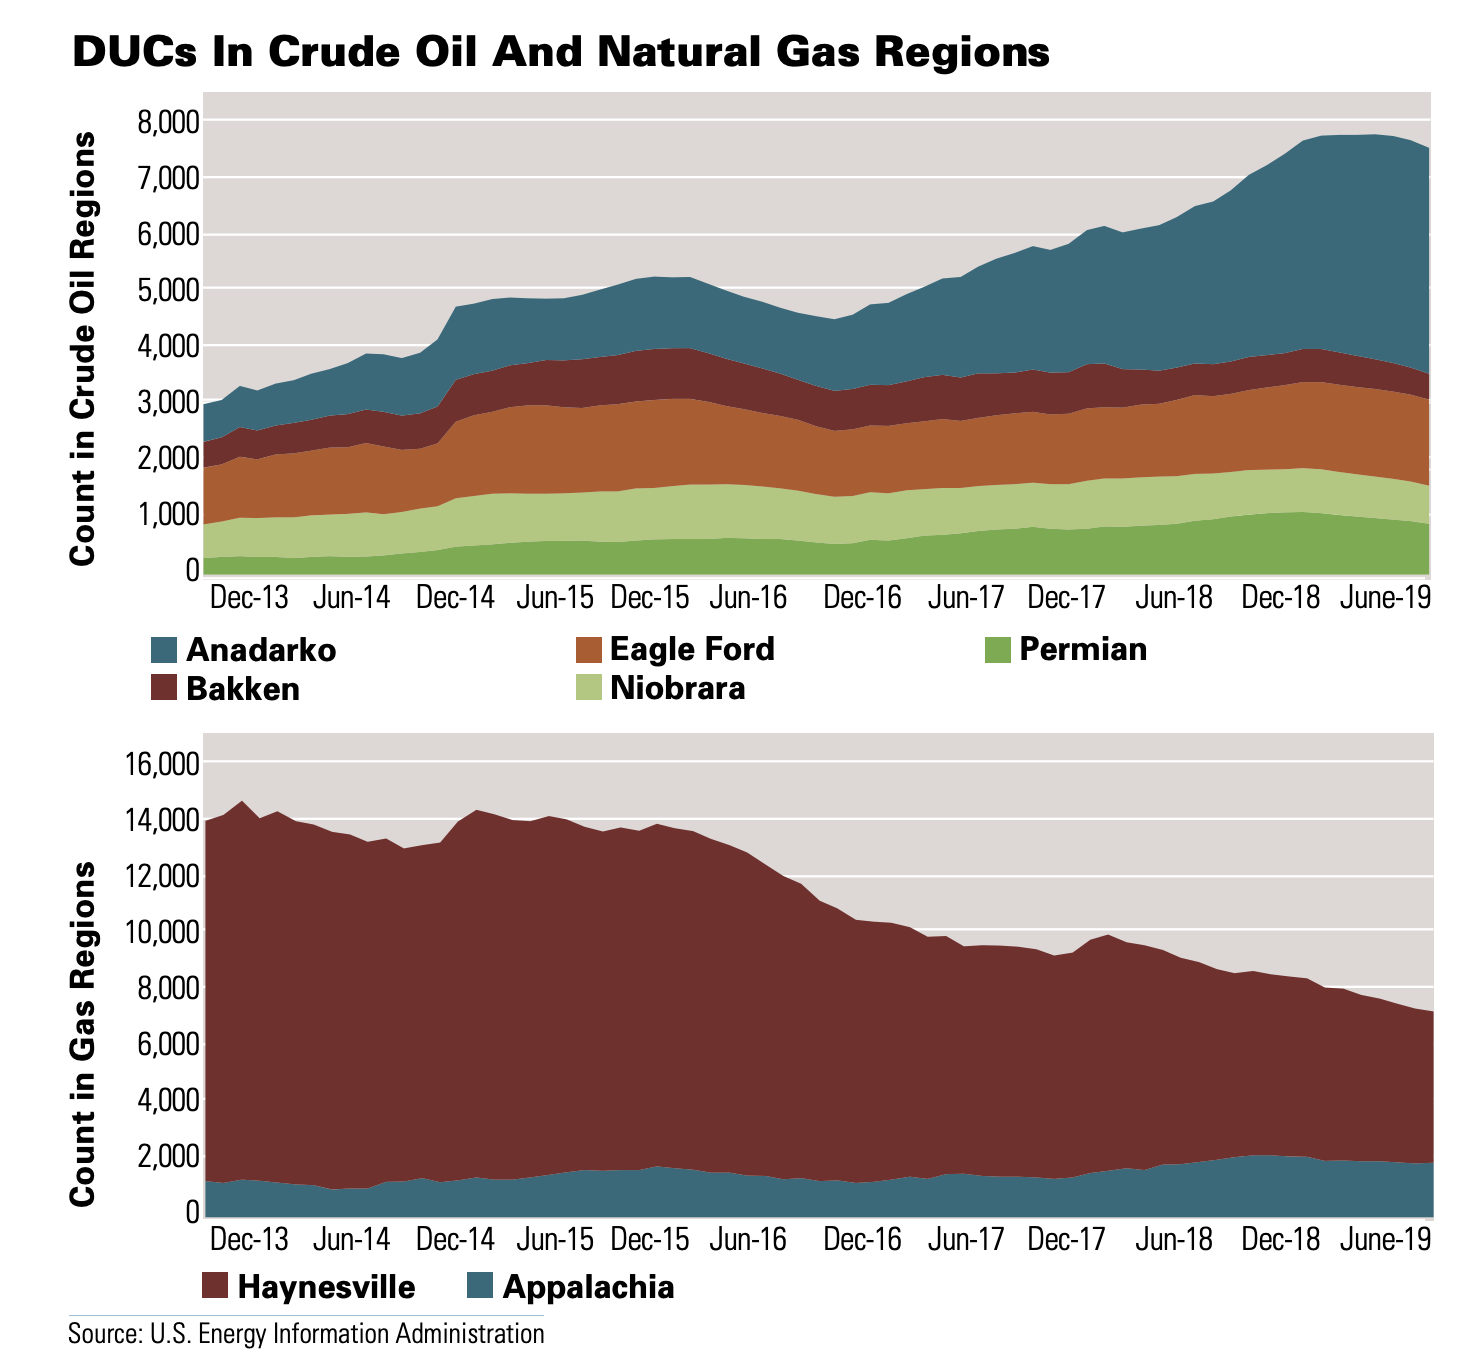
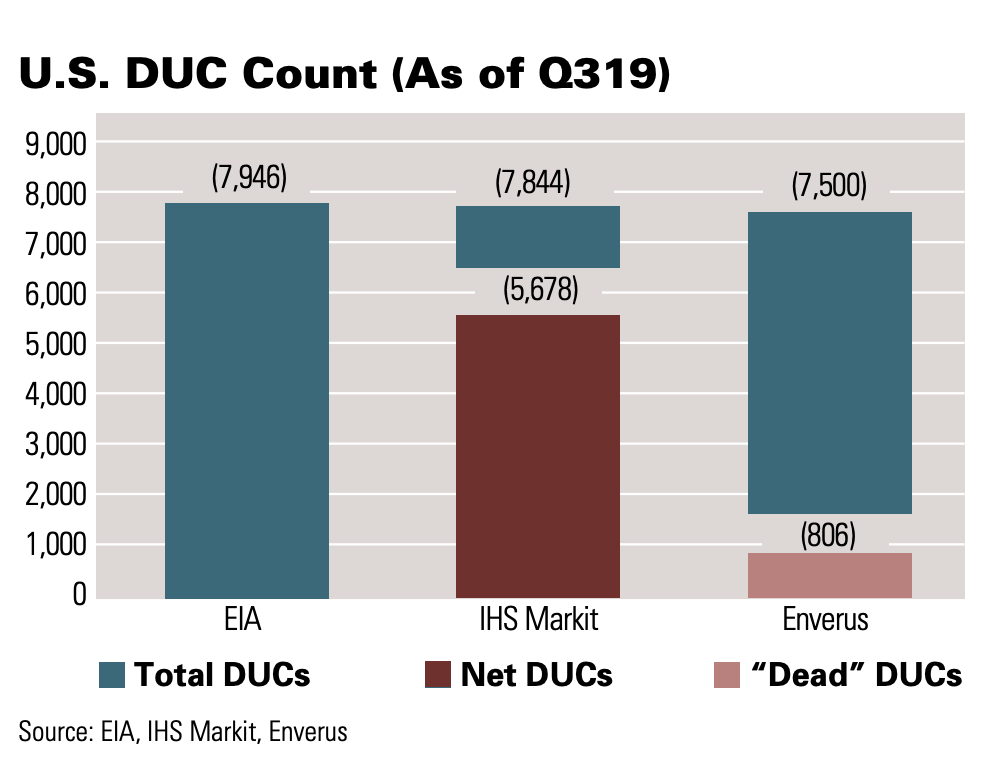
The group started releasing DUC counts by basin in the fall of 2016. As of the end of August 2019, the EIA estimated that almost 8,000 DUCs were spread across seven unconventional oil and gas plays in the U.S. A little less than half of those, around 3,800, were in the bustling Permian Basin of West Texas and southeastern New Mexico.
The EIA uses a range of sources to arrive at its DUC numbers, including various state agencies such as oilfield data specialists Enverus and FracFocus.org, the national hydraulic fracturing chemical registry managed by the Ground Water Protection Council and Interstate Oil and Gas Compact Commission. The FracFocus data are key to the EIA count. According to the agency, if a drilled well has not been reported to FracFocus, it’s a DUC.
The EIA begins counting from December 2013 under the assumption that all wells drilled before then have by now been completed and reported to FracFocus.org, explained Jozef Lieskovsky, senior analyst for the EIA. However, “from that point we add the estimated number of wells drilled and subtract the wells reported to FracFocus.org. Since there is a delay in FracFocus reporting, we estimate the completions in the most recent months.”
During the same period, researchers at IHS Markit, which does not use the EIA numbers and has its own DUC count, tallied a slightly lower 7,844 total DUCs, with 3,346 located across the Permian. These are what IHS refers to as gross DUCs. There is also a net DUC number, which ranges significantly lower. The total net DUCs across the U.S. is closer to 5,700, with just over 2,500 in the Permian.
“A drilled but uncompleted well can be defined as a well that has spud or spud and reached the target depth but has not undergone any of the well completion process like hydraulic fracturing, casing or cementing,” Narmadha Navaneethan, principal analyst with IHS, told Oil and Gas Investor. “In our database, we have an intermediate well category where there is indication of perforations or we have some well test or treatment records, but still no production records. We count these as DUCs for our supply estimate purpose because we don’t have any production record associated with it.”
For its recording and research purposes, IHS uses the net DUC number, which assumes a time lag between operators drilling a well and the completion of that well.
“Gross DUCs is any well that gets drilled but not completed,” said Navaneethan. “It takes at least two to nine months after drilling to get completed, with the majority of completions between three to six months. By counting all the gross DUCs, we are overestimating.”
Net DUCs are those generally available to the operator for completion. That discounts certain wells. For example, a well drilled yesterday would not be available for completion today. IHS considers a “natural lag” of at least two to three months before any well gets completed—a “steady-state inventory period.”
“You can’t move these to zero because there is always a natural lag between drilling and completions,” Navaneethan added. “What’s left is the net DUCs, and that is what we publish.”

either due to field
economics or
capital allocation,
may never be
completed,
according to
Bernadette
Johnson, vice
president of
strategic analytics
at Enverus.
Enverus (formerly Drillinginfo Inc.) also separates DUCs due to vintage, but most agree there is an invisible window of opportunity or a shelf-life to most DUCs. A six-month lag in completions is normal, according to the data gatherers. But once that span grows larger, it usually signals something out of the ordinary, such as a bottleneck awaiting new infrastructure or perhaps operators in specific regions waiting for seasonal shifts in pricing.
The recent dive in DUCs in the Permian Basin can be attributed to the combination of lower rig activity and the introduction of new takeaway capacity. In September 2019, when the Kinder Morgan-led $1.75 billion Gulf Coast Express Pipeline came online, operators completed gas wells in order to fill the 2-billion-cubic-feet-per-day conduit to Texas coastal refiners in a month’s time.
“If we have the data, we’re going to keep the data, but at a certain point DUCs do fall off,” said Bernadette Johnson, vice president of strategic analytics at Enverus.
An example of this is reflected in the northeastern Pennsylvania operations of Anadarko Petroleum Corp., which was drilling wells there during 2009 to 2010 when takeaway bottlenecks began hindering production.
“They had a bunch of drilled, uncompleted wells, but then they moved the budget dollars somewhere else, so those wells effectively became ‘dead’ DUCs,” said Johnson. “They were never going to be completed.”
A similar situation occurred in the Bakken, but it was more commodity price driven. Enverus estimates around 250 wells in the region that were drilled from 2014 to 2015 and may likely never be completed due to project economics. These wells, drilled during a robust commodities pricing cycle, have high breakeven thresholds. At $100 per barrel, they made economic sense and offered a good return.
However, once oil prices tanked, these wells’ economics also cratered. In today’s environment, completing these wells would not be good business, especially as a significant portion of the cost equation is on the completions side.
DUCs carried by the EIA have no expiration date. If a producer drills three wells on a pad, completes one and then realizes, for example, that the wells were not landed properly and moves locations to try again, those two uncompleted wells—like those older Pennsylvania and Bakken wells—would be counted as DUCs by the EIA indefinitely.
“We have no way to know which of the wells will not be completed,” said Lieskovsky. “There is also a possibility that the well was completed, but it is yet to be reported to FracFocus.org. We are evaluating various proposals on how to improve the methodology and our estimates.”
Then there are more radical methods of counting DUCs, like the one adopted by the petroleum consultancy Spears & Associates. In an August 2019 bulletin, the company proclaimed it doesn’t believe there are any DUCs. None. Zero.
While it does believe drilled wells are out there awaiting hydraulic fracturing jobs (which most define as DUCs), it does not see any sort of overhang that will lead to a completion boom.
“The very same economics that cause a new well to be drilled cause each of those wells to be completed as soon as possible,” the bulletin read. “In this era of capital discipline, what oil company management team would admit to shareholders that they took a bunch of capital, drilled holes in the ground at $3 million per and left them there without completing them?”
Spears also downplays the idea of the Permian Basin being a “big spigot” of DUCs that can be turned on when needed.
“This does not exist,” the consultancy said. “The oil markets price WTI at a modest $55 because traders think there is a lot more available on demand. Not without a massive incremental investment increase!”
A DUC discrepancy
With differing methodologies on first, what a DUC is and, second, how best to count them, you can imagine that it makes for a certain degree of difficulty in coming up with an accurate number for just how many exist.
Everyone agrees that the largest population of DUCs in the U.S. is in the Permian Basin, and most agree that new takeaway capacity in the area is driving the counts down.
However, petroleum analytics firm Kayrros sees that number on the rise.
Kayrros, founded in 2016 by former Schlumberger Ltd. executive Antoine Rostand and Antoine Halff, a former lead industry economist at the EIA and former chief oil analyst of the International Energy Agency, made waves over the summer of 2019. The firm released a report that stated that the EIA DUC numbers were skewed high and operators had been underreporting completions operations.
On any given month, Kayrros believes, the Permian DUC inventory runs just around 1,000 wells. In an October blog post, the group said it saw the Permian DUC backlog grow 5% to its highest level since March 2016, however, starting from a much lower base than the EIA numbers.
“The disparity between the two counts reflects a difference in methodologies: On [the] one hand, the old-fashioned way of compiling statistics from self-reporting by companies, and on the other hand, the cutting-edge approach based on direct measurements enabled by recent advances in technology, data storage and computing capacity,” the post read.
According to Kayrros, satellite-based measurements show that many light, tight oil producers fail to report their well completions to FracFocus and state commissions in a timely manner, if at all.
“This has led to significant undercounting of well completions in EIA data that are widely used and considered reliable by industry analysts,” the post continued. “In 2018 alone, in the Permian, more than 20% of wells went unreported to FracFocus or state commissions.”
Enverus, which also tracks rigs via satellite positioning, disputes the Kayrros numbers, saying that reporting lags—even at the operator level—are consistent with what they have seen historically in the data and that they were unable to verify any of the claims made in the Kayrros study.
Kayrros isn’t the only one that believes the EIA numbers are too high. A September 2019 survey polling 73 oil and gas executives, conducted by the Federal Reserve Bank in Dallas, found half of participants responding said that their estimate for the number of DUCs in the Permian Basin is lower than the EIA estimate, with 23% saying significantly lower and 27% saying slightly lower. Thirty-seven percent said their estimate is close to the EIA estimate, while the remaining 12% said it was higher.
DUCs as storage
Some view DUCs as a type of storage for the nation’s hydrocarbon resources that can simply be “turned on” via completions when supply is needed. It is one of the main reasons these uncompleted wells are counted in the first place: to gauge, at least partially, future production volume growth. While that historically has held some merit, it can depend on the region and, more so today, the operators’ development method.
“If you are in the Northeast, I think it is accurate to think about DUCs as storage,” said Enverus’ Johnson. “You are drilling them throughout the year and waiting on winter to complete them. That is a storage-like behavior.
“If you are anywhere else, I would say no. It is storage, but it is not acting the way that typical storage would, meaning you put it in the ground when it’s cheaper and pull it out when the price goes up. You can’t count on them to show up during periods of peak demand or price spikes.”
A recent report from energy analysts BTU Analytics has placed a new wrinkle on the DUCs-as-storage issue by calling into question not the quantity, but the quality of the current backlog. For example, the Permian Basin is estimated to have added around 1,100 DUCs over the past two years, a period when operators were experimenting with spacing. The activity nearly tripled the total count—from 600 at the end of 2016 to almost 1,800 by the end of 2018. Of those, more than 60% were added in 2018, a time when the average distance between wells was the tightest.

“This has raised concerns that the large backlog of DUCs may be primarily composed of potentially underperforming wells,” the report said.
Whether the DUC backlog is affected by well spacing issues remains to be seen; however, as cost-conscious operators move to complete well vs. drilling new ones to keep resources flowing into the system, we might not have to wait very long.
Recommended Reading

Interoil to Boost Production in Ecopetrol Fields
2024-09-03 - Interoil will reopen shut-in wells at three onshore fields, which are under contract by Ecopetrol.
Chevron Boosts Oil, NatGas Recovery in Gulf of Mexico
2024-09-03 - Chevron’s Jack/St. Malo and Tahiti facilities have produced 400 MMboe and 500 MMboe, respectively.

CNOOC Makes Ultra-deepwater Discovery in the Pearl River Mouth Basin
2024-09-11 - CNOOC drilled a natural gas well in the ultra-deepwater area of the Liwan 4-1 structure in the Pearl River Mouth Basin. The well marks the first major breakthrough in China’s ultra-deepwater carbonate exploration.

Seadrill to Adopt Oil States’ Offshore MPD Technology
2024-09-17 - As part of their collaboration, Seadrill will be adopting Oil States International’s managed pressure drilling integrated riser joints in its offshore drilling operations.
Permian Resources Closes $820MM Bolt-on of Oxy’s Delaware Assets
2024-09-17 - The Permian Resources acquisition includes about 29,500 net acres, 9,900 net royalty acres and average production of 15,000 boe/d from Occidental Petroleum’s assets in Reeves County, Texas.
Comments
Add new comment
This conversation is moderated according to Hart Energy community rules. Please read the rules before joining the discussion. If you’re experiencing any technical problems, please contact our customer care team.