Horizontal well designs have become progressively longer and more intense in terms of proppant usage. Virtually the entire industry has switched from high-permeability grade proppants like 30/50 to lower permeability grades such as 100 mesh. In fact, at the end of 2014, market surveys indicated demand was split evenly between coarse grades and fine grades in terms of proppant consumption. By the beginning of 2019, Covia estimated that fine grade material makes up more than 75% of demand with 100 mesh comprising more than half of total demand on its own.
Comparing designs
Base permeability of proppant grades can be plotted along a curve that declines as particle size decreases, meaning pore space between those particles becomes smaller. Comparing similar proppant substrates, on average, 40/70 has 60% less permeability than 30/50, and 100 mesh has 74% less than 30/50, or 40% less than 40/70. Proppant also crushes or degrades over time, further reducing permeability. That rate of decay is dependent on the physical characteristics of the proppant being used. Geological factors including deposit age, formation and chemical composition determine many of these characteristics. In-basin sands are relatively very young and were deposited by the wind with minimal natural processing making them angular, rough and polycrystalline in structure. Sands from the Jordan, St. Peter and Wonewoc sandstone formations (collectively referred to as Northern whites) were formed before dinosaurs roamed the earth in a massive ancient rock tumbler (read: ocean), which covered most of North America. That process made these grains mostly round, smooth and monocrystalline (each grain is a single quartz crystal), making them much more durable on an individual grain basis. Through testing of various substrate materials, it has been discovered that the permeability of lower-quality proppants degrades much faster than Northern whites when subjected to the same conditions. Third-party-validated laboratory experiments indicate that just two weeks under only 6,000 psi can materially change the particle size of West Texas 100 mesh proppants, thereby further cutting their permeability in half. In simplified terms, picture a milkshake as hydrocarbons and a straw as permeable fractures and the wellbore. It is difficult to draw up the viscous fluid if the straw as is too narrow, but then picture the straw further collapsing under the high external pressure of the milkshake and comparatively low internal pressure of the straw from the draw of liquid upward.


Using this analogy, it would be easier to breathe through the same undersized straw. Liquid permeability is always lower than gas permeability, and as fluid viscosity increases, permeability further decreases, implying gas is easier to liberate than liquids and oil. As permeability has been removed from the collective proppant pack, the ratio of oil to gas has changed coincidentally over the same time period.
A public data sample set of wells aggregated by Westwood Global Energy Group in the Wolfcamp Delaware using a pure 100 mesh design produced 32% gas while higher permeability 40/70 designs within the same set yielded less than 19% gas on a Btu conversion basis. This implies that switching from 100 mesh to 40/70 might yield 13% more oil, based on ratio alone, which can have a significant financial impact to a well’s performance. The common ratio for computing barrels of oil equivalent is 6:1, or 6 MMBtu of gas per barrel of oil. Assuming an operator is hedged at $50/bbl West Texas Intermediate (WTI), natural gas realized prices would need to be $8.33/Mcf on an economic basis to represent an accurate conversion. With most realized natural gas prices down to $2/Mcf and many below that, the gas-oil economic ratio should be more like 25:1. This can cause a well to appear to be far more profitable than it actually is, and it represents a potential disconnect between productivity and profitability as production mixes become further weighted toward natural gas.
Proppant efficiency
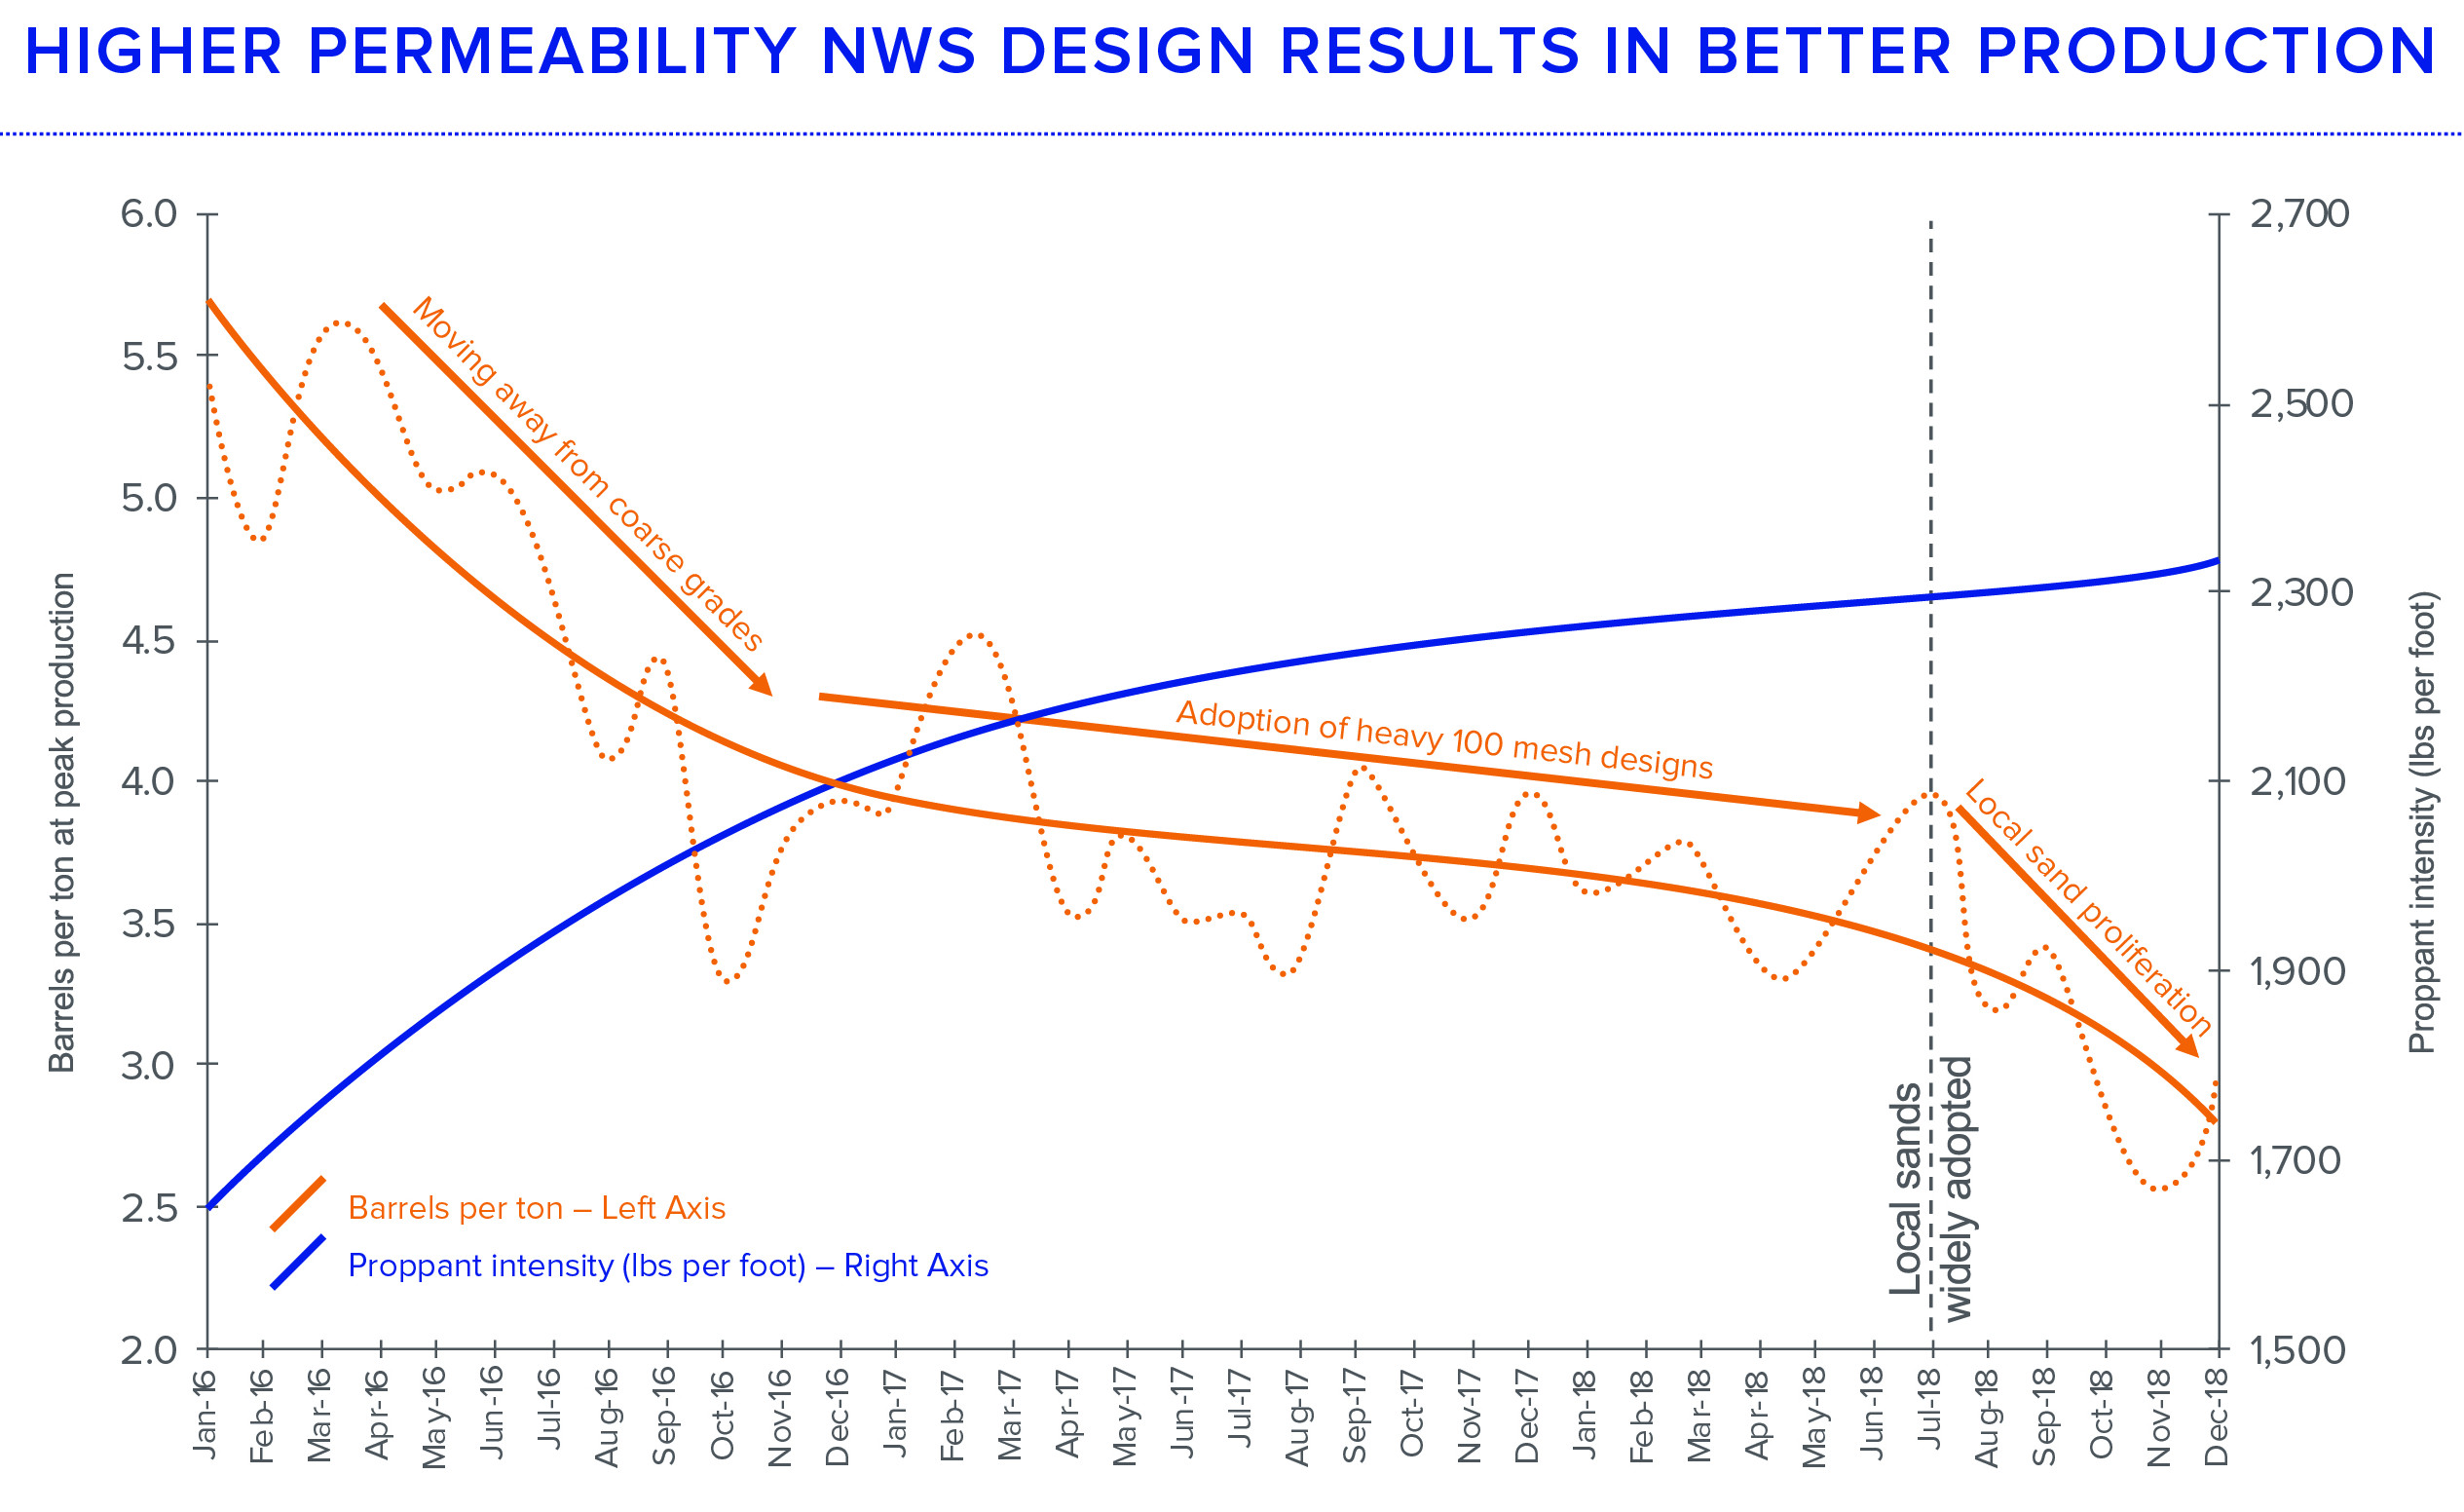
Overall, proppant efficiency has declined significantly as well. Westwood Global Energy Group’s aggregated public data indicate that proppant efficiency through time in the Texas portion of the Delaware Basin was as high as 5.5 cumulative barrels of oil recovered per ton of sand at peak in 2016. As designs shifted to lower permeability mesh sizes, the industry now sees roughly 3 bbl/ton of sand at peak production, or a 45% decline. To ensure this was not the effect of sample bias, this trend also was present when using RS Energy Group as a second data aggregation source. In economic terms, at a realized price of $50/bbl WTI, each ton of sand would have generated $275 revenue in 2016. Using current designs, each ton generates $150. Even with applying the $50 in-basin savings differential on the currently used in-basin tons, they are still behind $75 in oil revenue per ton generated at peak production, or basically as soon as the well comes online. This is also before any decline curve is applied to the well, which may be substantial given the rate of degradation.
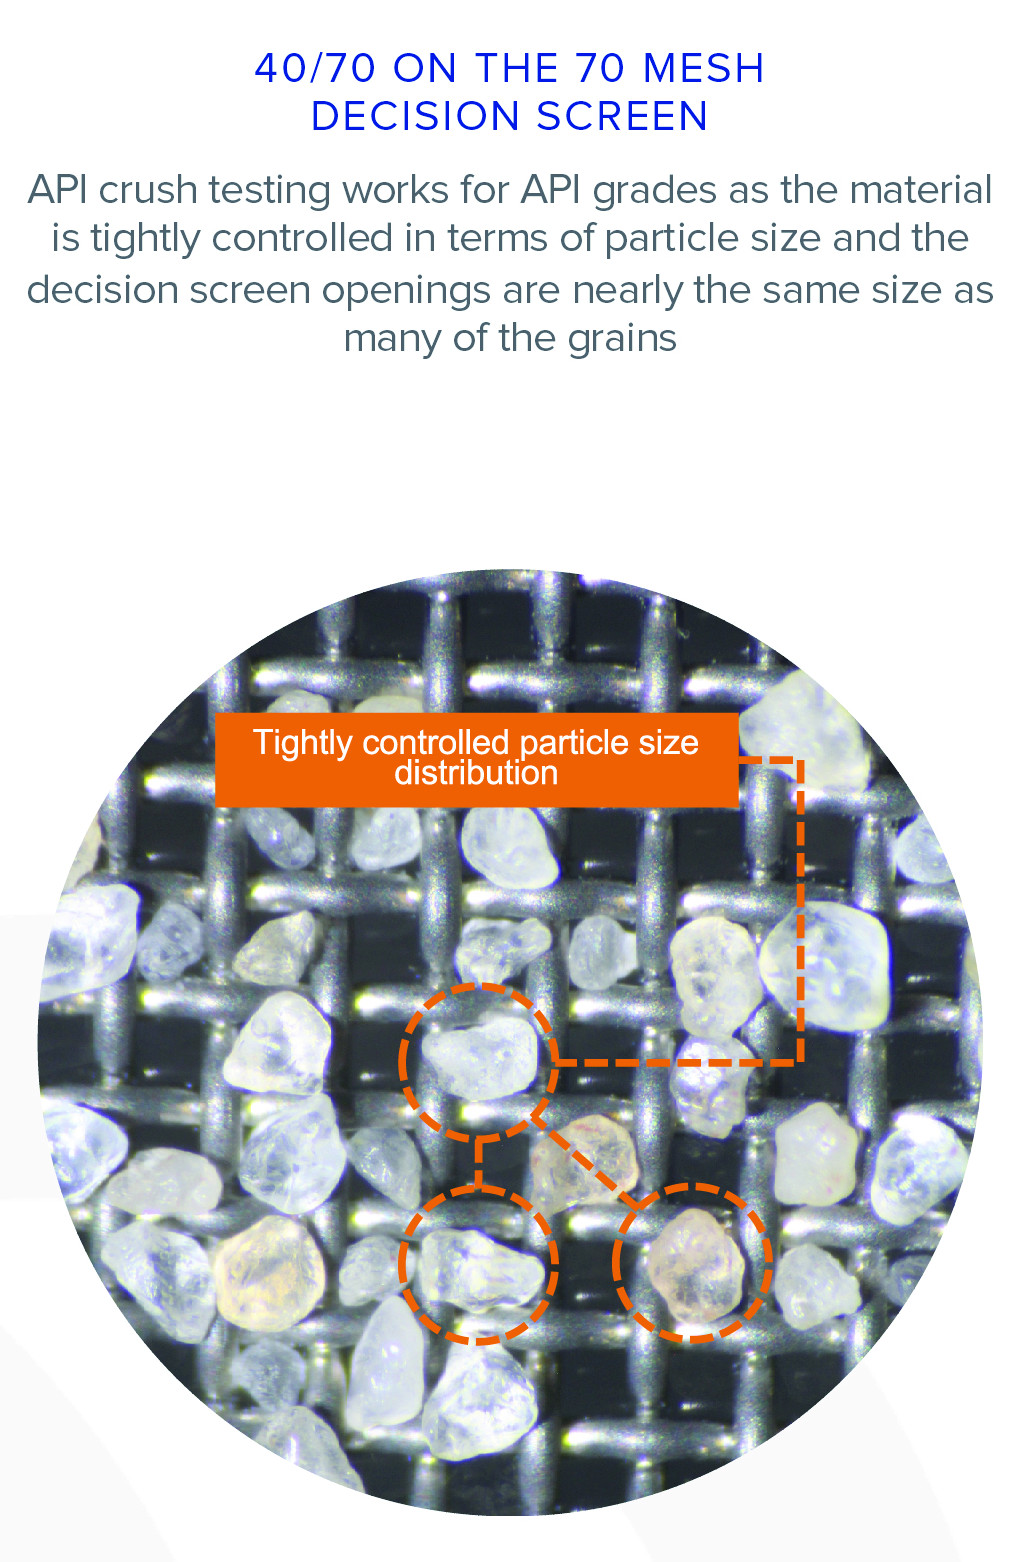
Marketed technical data may not tell the whole story about the selected proppant. Applying American Petroleum Institute (API) standard testing to non-API grades like 100 mesh can present a false view of that sand’s capabilities. For example, a five-minute crush test only indicates the amount of pressure required to sieve 10% of the material by weight through the decision screen (often called a “fine”). In 100 mesh, this is typically the 140 mesh screen, meaning there are 140 holes per square inch, which equate to roughly 100 micron openings. If 100 mesh is a coarse cut product, or closer to a 40/70, as many West Texas proppants are, it will take a lot of force to sift those coarse grains (roughly 400 microns) small enough to fall through a 140 mesh (100 micron) opening. Those grains have to grind and crush multiple times in one five-minute test to generate fines that are 300 microns smaller than their initial grain size. Given this dynamic, a strong correlation exists between a 100 mesh’s coarseness and “tested” crush value. While crush may be an interesting number, it has almost no bearing when indicating the performance or endurance of 100 mesh.
API grades, on the other hand, have tightly controlled particle size distributions, and the decision screens are very near the size of the individual grains making the crush test far more applicable. A 40/70’s tested crush value will be a much better representation of a sand’s base strength. If a substrate’s 40/70 isn’t strong enough for an application, then the 100 mesh won’t be either, no matter what the data sheet says.

Conclusion
Engineering is a continuum. The right solution must be applied to the right application for maximum effect. While a ceramic proppant represents overengineering, for a lot of applications, in-basin sand represents underengineering. Traditional Northern white proppants represent an adequate solution that will provide reliable performance across the widest spectrum of conditions.
Recommended Reading
Lake Charles LNG Selects Technip Energies, KBR for Export Terminal
2024-09-20 - Lake Charles LNG has selected KTJV, the joint venture between Technip Energies and KBR, for the engineering, procurement, fabrication and construction of an LNG export terminal project on the Gulf Coast.
Macquarie Sees Potential for Large Crude Draw Next Week
2024-09-19 - Macquarie analysts estimate an 8.2 MMbbl draw down in U.S. crude stocks and exports rebound.
EIA Reports Natural Gas Storage Jumped 58 Bcf
2024-09-19 - The weekly storage report, released Sept. 19, showed a 58 Bcf increase from the week before, missing consensus market expectations of 53 Bcf, according to East Daley Analytics.
Electrification Lights Up Need for Gas, LNG
2024-09-20 - As global power demand rises, much of the world is unable to grasp the need for gas or the connection to LNG, experts said.
Woodside to Maintain at Least 50% Interest in Driftwood LNG
2024-09-18 - Australia’s Woodside Energy plans to maintain at least a 50% interest in the 27.6 mtpa Driftwood LNG project that it's buying from Tellurian, CEO Meg O’Neill said during a media briefing at Gastech in Houston.
Comments
Add new comment
This conversation is moderated according to Hart Energy community rules. Please read the rules before joining the discussion. If you’re experiencing any technical problems, please contact our customer care team.


