Presented by:
![]()
Editor's note: This article appears in the E&P newsletter. Subscribe here.
Norway is Western Europe’s biggest oil-producing nation. The country is strengthening its power grid and expanding its green energy industry while planning for a sustainable approach to the energy mix by continuing to exploit its oil and gas resources. The oil produced there is among the lowest in carbon footprint.
Among other reasons, some fields reinject their CO2 into the subsurface for storage, nearby fields infrastructure is clustered, and there has been a massive electrification of offshore facilities (especially in 2020). Moreover, the parliament just agreed that the industry’s emissions must be cut by 50% by 2030. So, in the framework of the Norwegian climate policy, the energy industry in the Norwegian Continental Shelf (NCS) must continue to deliver production by finding new oil that is extracted with ever lower emissions.
The NCS has been extensively explored for about 60 years. Hydrocarbon production started in 1971, when the giant Ekofisk started trial production. A long list of discoveries followed, and many large fields were brought online increasing overall production until 2001, when according to the Norwegian Petroleum Directorate, peak oil production was reached.
Exploration in the area has continued and wells are drilled, but economic discoveries and their associated sizes keep declining—with the exemption of Johan Sverdrup in 2010. The spare capacity of the existing infrastructure starts to increase and begins to become a liability; operating it and maintaining it becomes less cost-effective as the production of their associated fields decay. Some infrastructures’ life cycles have been extended with lifetime extension engineering processes. The rest is marked for decommissioning (a standard practice with important downsides: lengthy, expensive and hinders the goal of maintaining production).
Discovering new fields that can be tied back to existing infrastructure delays decommissioning and offers the possibility of very low-cost production with an extremely low carbon footprint.
To maintain production while lowering emissions, there is a need to find the hidden reservoirs in mature, prolific areas. That necessity calls for:
- New data;
- New processing/analysis of existing data;
- New insights from historical data;
- New toolbox; or
- All the above.
In the area between the Utsira High and the South Viking Graben, we are working with Option 5.
New seismic data, via the Utsira ocean-bottom node (OBN) survey, were acquired by TGS and AGS in 2018-2019. It was the first large-scale (more than 1,500 sq km), densely sampled OBN survey ever acquired for exploration purposes. The regional volume was processed with state-of-the-art technology.
To take the processing one step further, new model building work has been done by TGS with a target-oriented approach (focusing in 200 sq km in the northern area), using dynamic-matching full waveform inversion (DM-FWI) with ultralong-offset (17-km split-spread) diving wave energy and a second pass of reflection DM-FWI, enhanced by tomography and anisotropy updates, using miss-ties to wells, surfaces and interpreter’s geological input.
Historical data can be leveraged by modern artificial intelligence (AI) and machine learning (ML) technology, like Earth Science Analytics (ESA) has done in its EarthNET platform. Thus, ESA and TGS decided to combine the power of ML and historical data with the modern Utsira OBN.
When talking about AI and ML, the concept of Big Data comes to mind. The 60-year history of seismic, wells, interpretations and experience in the NCS, combined with government-driven releases, reduction of storage costs and cloud computing provides an accumulation of geo-data that has the characteristics of Big Data. In other words, it has quantity, demonstrated value, diversity, accessibility and timeliness.
The introduction of Big Data and AI technology has provided more diverse data processing methods and the possibility for mining the geological rules hidden in the massive geoscientific data.
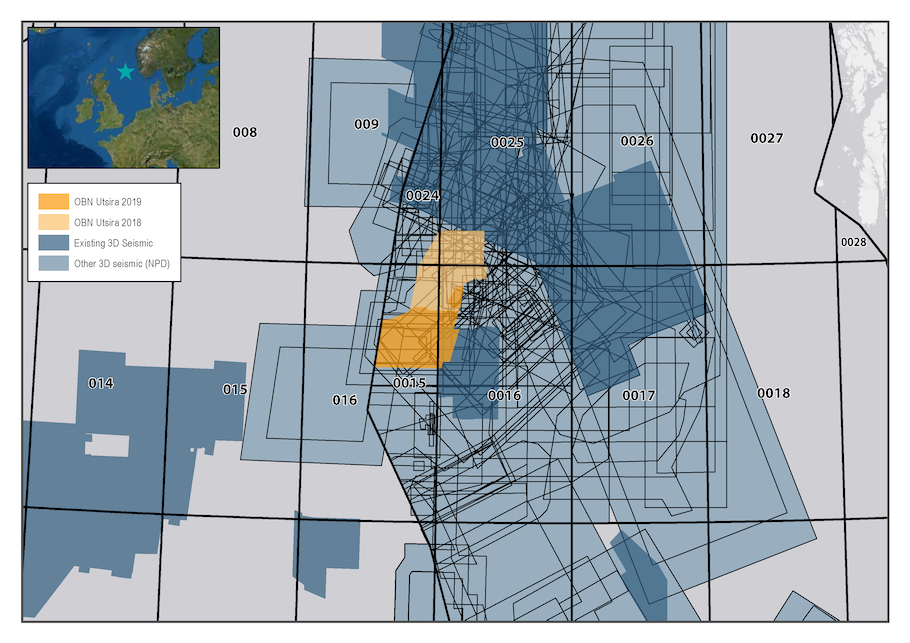
To give a sense of the amount of data that exist in this area, Figure 1 shows a map of the Northern North Sea highlighting the Utsira OBN survey area in orange, overlain by the area of other existing 3D seismic surveys (each survey polygon is outlined in black and colored in blue; dark blue indicates TGS’ surveys). There are 106 released wells (98 from NCS, 8 from the U.K. Continental Shelf) within or nearby Utsira OBN and 70 surveys intersect its polygon—a total area of 21,513 sq km of surveys.
AI/ML was used to predict missing well logs, rock and fluid property curves from all the released well data in the Greater Utsira High area with robust schemes for cross validation and blind testing to reduce and control uncertainties. These property curves were then aligned and integrated with the angle-stack data from Utsira OBN.
ML models were trained to quantify the relationships between the seismic data and target properties: lithology, porosity, density, Vp and Vs velocities. Additionally, AI-driven structural seismic interpretation was performed to interpret faults and injected sands. The latter are commonly velocity and density anomalies that can be prospective in the Greater Utsira High area. They are sand-rich sediments with permeabilities prone to fluidization, and the sizes vary from a few hundred meters to a kilometer and have irregular shapes from v-brights to horizontal sills. The 3D mapping of the injected sandstones can be used for further improvements in data quality via processing and for identifying prospective rock volumes.
In an initial study, predicted Vp and extracted injectites were compared against the modern DM-FWI and anisotropy updated model to provide a more detailed picture of the subsurface. ESA and TGS argue that the toolboxes, processing versus AI/ML, do not exclude or replace each other; a combined analysis can extract added value and reduce uncertainties.
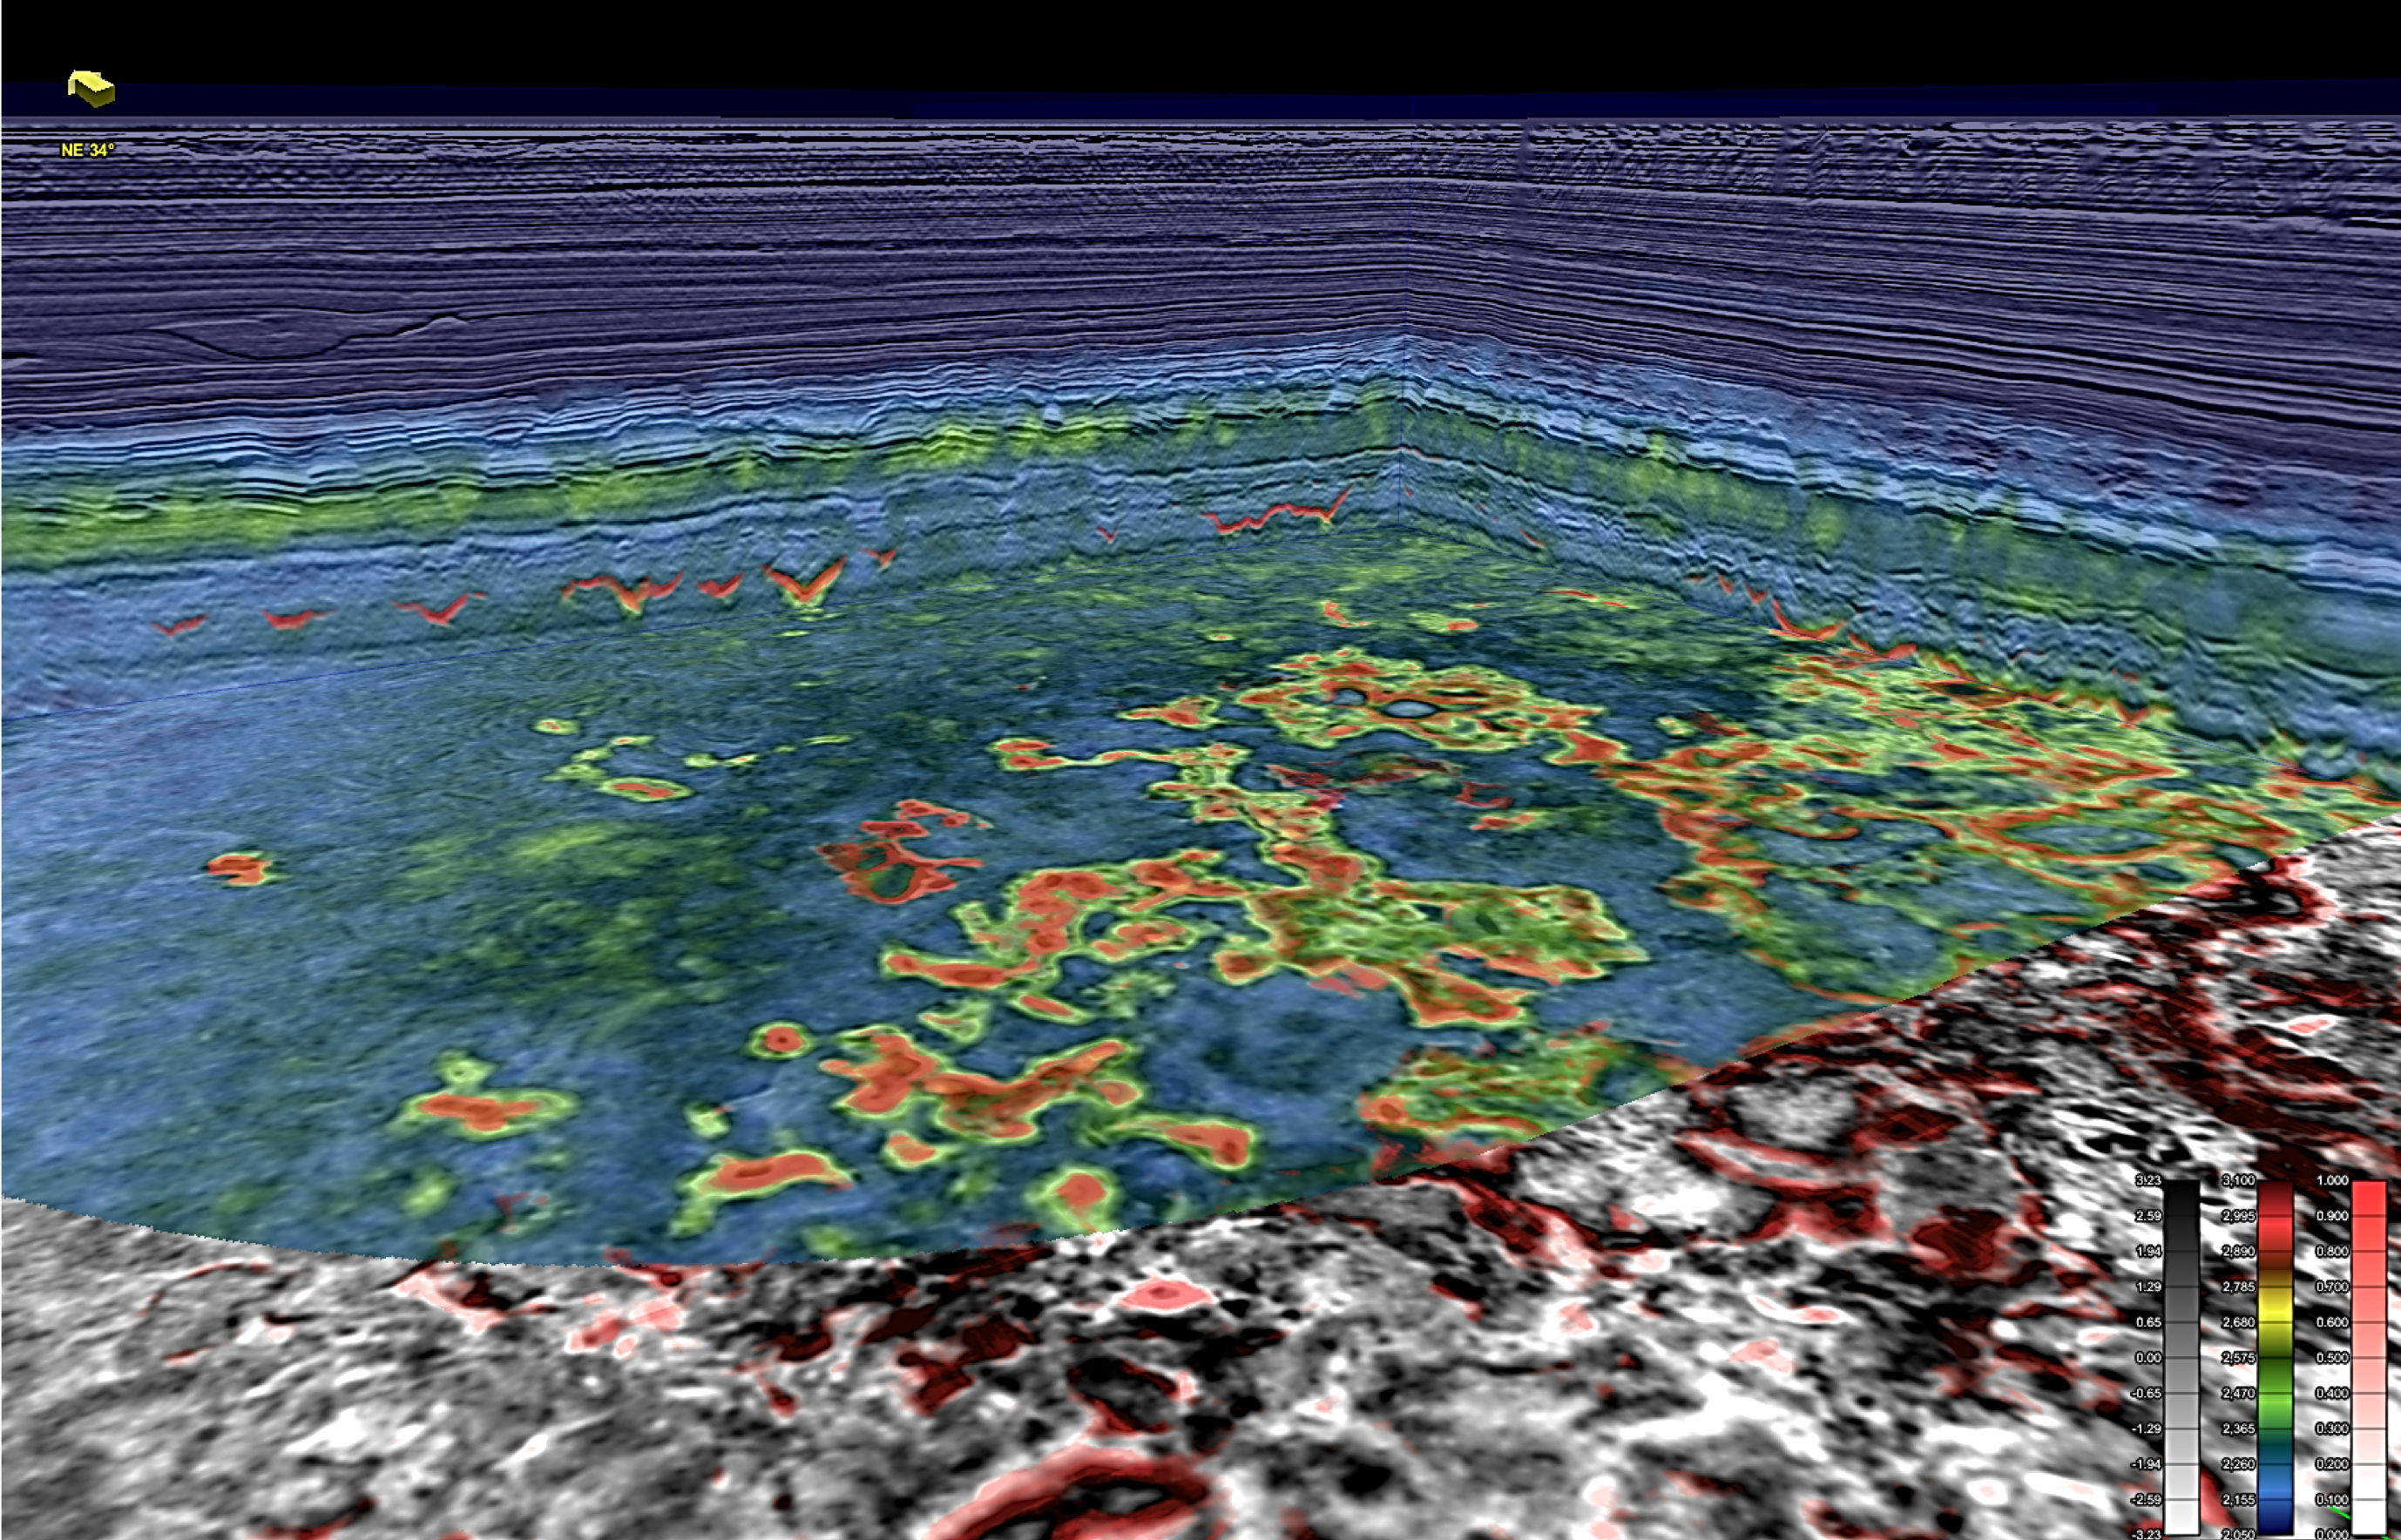
Figure 2, for example, shows that the DM-FWI-based velocity captures the anomalies due to injectites as a velocity increase. The red AI-modeled injectites are overlain in red, confirming their presence and refining their size.
Several wells in the area have encountered unprospective brine-filled injectites, whereas the prospective injectites still remain underexplored with few discoveries and producing fields.
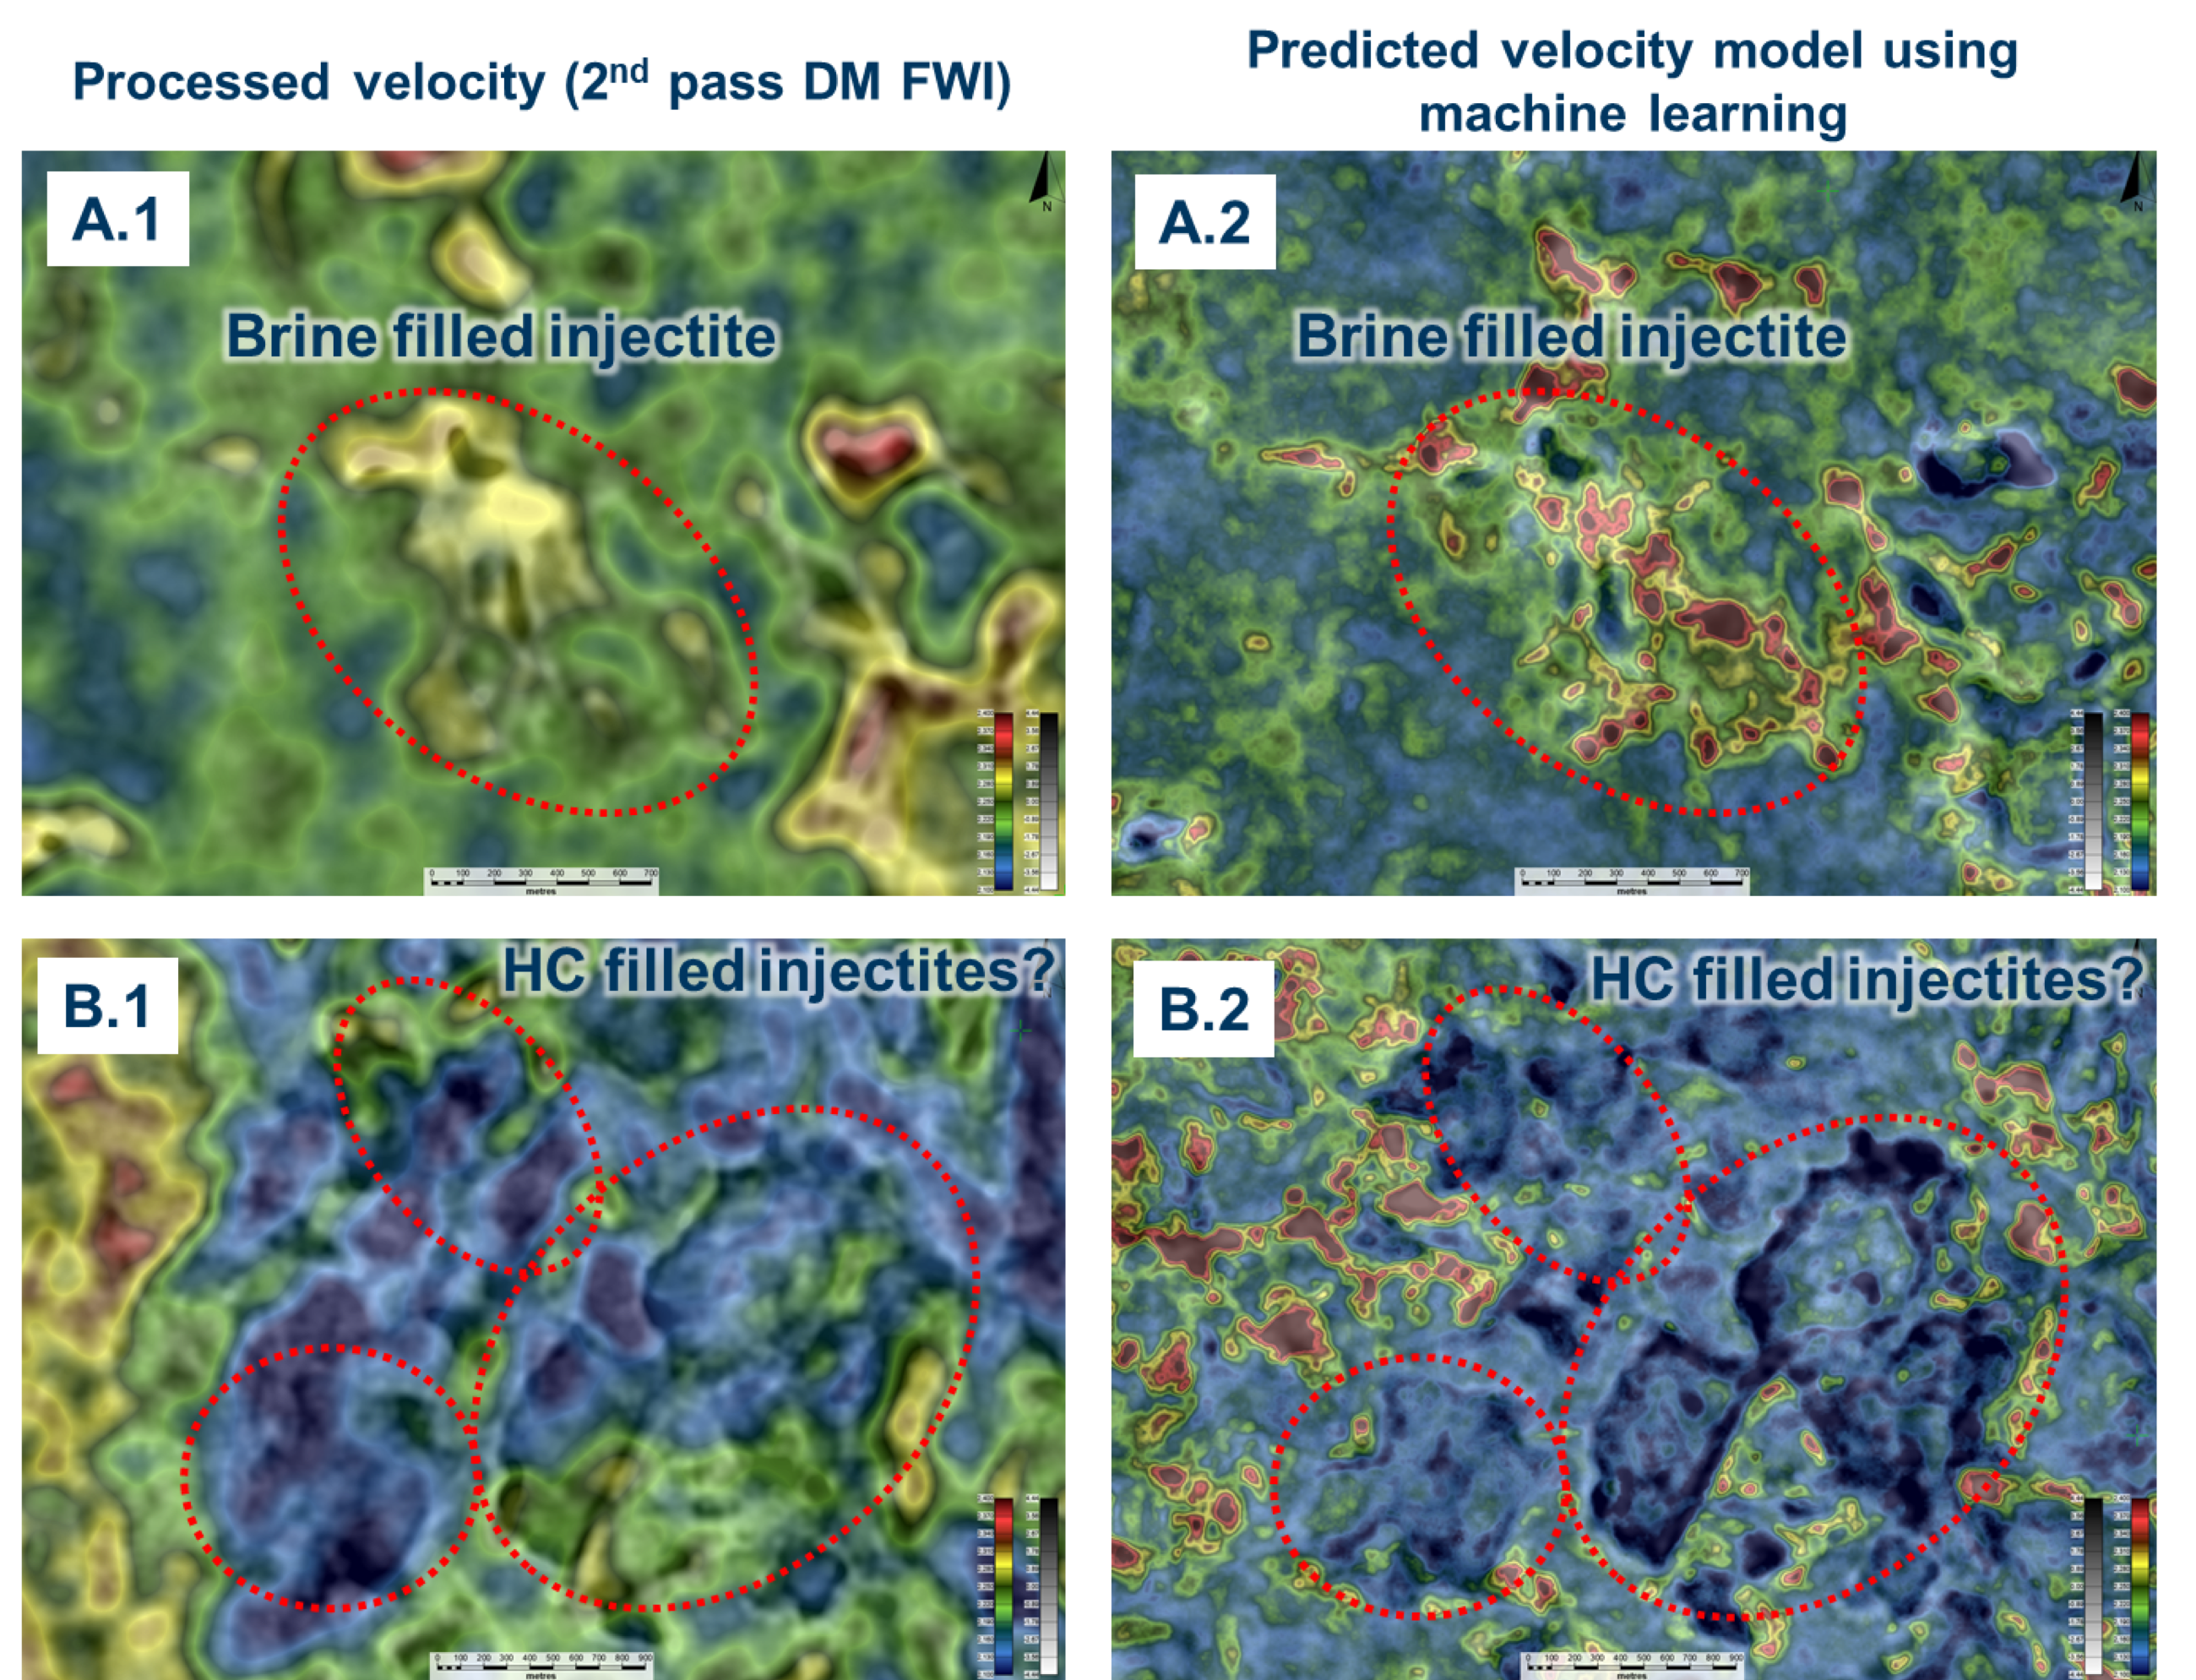
Figure 3 compares the DM-FWI to the AI/ML predicted Vp. The depth slices intersect a drilled brine-filled injectite (A.1 and A.2) and lower velocity injectites (B.2 and B2) in an area of drilled HC-filled injectites. Both DM-FWI and predicted velocity models support observations indicating higher velocity associated with unprospective injectites. These models have distinctly different resolution due to the nature of the algorithms used to derive them; however, the geological insights that they provide confirm each other. The DM-FWI provides increased imaged detail and better placement of the geobodies and the complex geology, and the AI/ML prediction leverages this information, the ground truth from the wells, and the historic knowledge to deliver a much detailed, resolved model.
The study of Utsira OBN, combining DM-FWI and advanced processing with structure, petrophysical information at the wells and high-resolution spatially predicted properties is ongoing. A newly migrated volume with the final DM-FWI model will be soon available.
In addition, feasibility P-S imaging and high-resolution migration tests are underway. All these results will be analyzed in combination with the predicted properties and extracted structure using EarthNET. This is the subject of future publications.
Remarks
The North Sea is reaching its full maturity. Despite modern technology, new economic discoveries have become scarce. A significant portion of the oil and gas fields in this area will reach the end of their economic life cycle within a decade. There is not much expectation in discovering huge fields in such a mature area, but sustainability of the expensive existing investments depends on marginal discoveries, which offer opportunities for clustering and aggregating new volumes.
When the goal is to identify highly valuable barrels nearby existing infrastructure, new technologies provide the ability to use historical data to extract insights that could not have previously been gained without investing large resources (e.g., time, personnel and compute). The output from the well-based property prediction study, the 3D-property prediction models and the automatic seismic interpretation provide invaluable new insights that can fuel further exploration of this prolific area, especially when this new information is analyzed side by side with modern processed data and high-end velocity models derived with ultralong-offset diving wave and reflection DM-FWI.
Recommended Reading

Dividends Declared Week of Nov. 4
2024-11-08 - Here is a compilation of dividends declared from select upstream and midstream companies in the week of Nov. 4.

TC Energy Appoints Two Independent Directors to Board
2024-11-07 - TC Energy Corp. appointed Independent Directors Scott Bonham and Dawn Madahbee Leach to its board, the company announced Nov. 7 in a press release.

OMS Energy Files for IPO, Reports Revenue Growth
2024-11-06 - Singapore-based OMS Energy, a wellhead system manufacturer, has not yet determined its price range and number of shares.

Record NGL Volumes Earn Targa $1.07B in Profits in 3Q
2024-11-06 - Targa Resources reported record NGL transportation and fractionation volumes in the Permian Basin, where associated natural gas production continues to rise.

Twenty Years Ago, Range Jumpstarted the Marcellus Boom
2024-11-06 - Range Resources launched the Appalachia shale rush, and rising domestic power and LNG demand can trigger it to boom again.
Comments
Add new comment
This conversation is moderated according to Hart Energy community rules. Please read the rules before joining the discussion. If you’re experiencing any technical problems, please contact our customer care team.