Since 2011, net-metered wind electricity generating capacity in the Northeast has grown faster than in the rest of the U.S., according to an April 26 report by the Energy Information Administration (EIA).
Like small-scale solar photovoltaic systems, many of which are net-metered, net-metered wind systems are much smaller than their utility-scale counterparts. Although the amount of net-metered wind in the United States is small—just 0.2% of all U.S. wind capacity in 2017—much of it has come online in the past few years because of state policies that encourage new small-scale wind turbines.
Net metering is a billing practice that allows customers with onsite generation capacity to be credited for electricity they supply to the utility grid. EIA collects information on installations of net-metered wind, solar, and other technologies through the Annual Electric Power Industry Report (Form EIA-861) and the Monthly Electric Power Industry Report (Form 861-M).
U.S. net-metered wind capacity reached 204 megawatts (MW) across nearly 7,000 installations in 2017. By comparison, 15,800 MW of net-metered solar photovoltaic systems were available across 1.7 million installations in 2017.
Net metering involves installing a bidirectional electric meter to measure both the electricity that a customer uses from the grid and any excess onsite electricity generated from the wind or solar installation that goes back to the electric grid. EIA collects the total capacity of these installations and classifies them as net-metered when their generation is netted (i.e., subtracted from the customer’s usage) on the customer’s utility bill.
Many states have policies that enable and encourage net metering. Some states provide additional economic benefits to owners of net-metered wind installations to further encourage participation. Net metering can also benefit utilities by avoiding the use of relatively inefficient utility-scale power plants during peak periods of electricity demand.
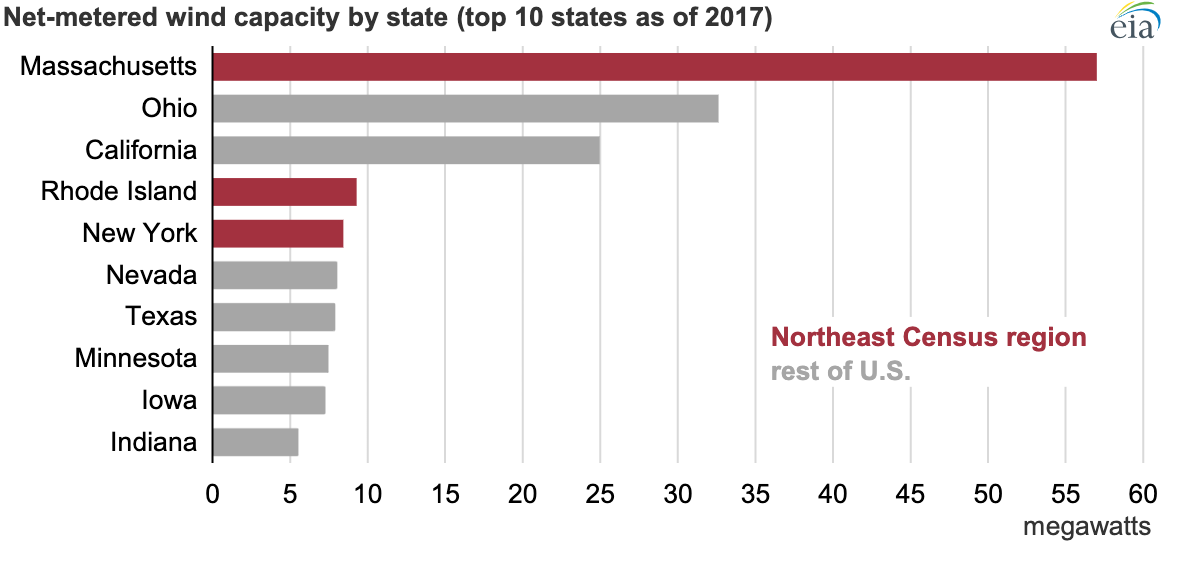
In 2017, Massachusetts had 57 MW of net-metered wind capacity, the most of any state. Net-metered wind installations in Massachusetts tend to be larger than others in the region. Although Massachusetts had 69% of the Northeast region’s net-metered wind capacity, the state had only 156 (11%) of the region’s 1,414 installations in 2017, for an average system size of more than 360 kilowatts (kW) per installation.
The Northeast has also experienced the largest growth in average capacity per installation. Between 2011 and 2017, the average capacity of net-metered wind installations in the Northeast increased from 23 kW to 59 kW. By comparison, the average capacity of installations in the rest of the country only increased from 14 kW to 23 kW.
The Northeast will likely continue to lead the nation in net-metered wind capacity and average system size when final 2018 data are available. Based on data from the Monthly Electric Power Industry Report, which collects data from a sample of electric industry participants, net-metered Northeast wind capacity showed an increase of 14% from January 2018 to December 2018. Complete 2018 data will be released in EIA’s Electric Power Annual in the fall of 2019.
Since 2011, net-metered wind electricity generating capacity in the Northeast has grown faster than in the rest of the United States.
Like small-scale solar photovoltaic systems, many of which are net-metered, net-metered wind systems are much smaller than their utility-scale counterparts. Although the amount of net-metered wind in the United States is small—just 0.2% of all U.S. wind capacity in 2017—much of it has come online in the past few years because of state policies that encourage new small-scale wind turbines.
Net metering is a billing practice that allows customers with onsite generation capacity to be credited for electricity they supply to the utility grid. EIA collects information on installations of net-metered wind, solar, and other technologies through the Annual Electric Power Industry Report (Form EIA-861) and the Monthly Electric Power Industry Report (Form 861-M).
U.S. net-metered wind capacity reached 204 megawatts (MW) across nearly 7,000 installations in 2017. By comparison, 15,800 MW of net-metered solar photovoltaic systems were available across 1.7 million installations in 2017.
Net metering involves installing a bidirectional electric meter to measure both the electricity that a customer uses from the grid and any excess onsite electricity generated from the wind or solar installation that goes back to the electric grid. EIA collects the total capacity of these installations and classifies them as net-metered when their generation is netted (i.e., subtracted from the customer’s usage) on the customer’s utility bill.
Many states have policies that enable and encourage net metering. Some states provide additional economic benefits to owners of net-metered wind installations to further encourage participation. Net metering can also benefit utilities by avoiding the use of relatively inefficient utility-scale power plants during peak periods of electricity demand.
In 2017, Massachusetts had 57 MW of net-metered wind capacity, the most of any state. Net-metered wind installations in Massachusetts tend to be larger than others in the region. Although Massachusetts had 69% of the Northeast region’s net-metered wind capacity, the state had only 156 (11%) of the region’s 1,414 installations in 2017, for an average system size of more than 360 kilowatts (kW) per installation.
The Northeast has also experienced the largest growth in average capacity per installation. Between 2011 and 2017, the average capacity of net-metered wind installations in the Northeast increased from 23 kW to 59 kW. By comparison, the average capacity of installations in the rest of the country only increased from 14 kW to 23 kW.
The Northeast will likely continue to lead the nation in net-metered wind capacity and average system size when final 2018 data are available. Based on data from the Monthly Electric Power Industry Report, which collects data from a sample of electric industry participants, net-metered Northeast wind capacity showed an increase of 14% from January 2018 to December 2018. Complete 2018 data will be released in EIA’s Electric Power Annual in the fall of 2019.
Recommended Reading

Drilling Tech Rides a Wave
2024-01-30 - Can new designs, automation and aerospace inspiration boost drilling results?

Tech Trends: Autonomous Drone Aims to Disrupt Subsea Inspection
2024-01-30 - The partners in the project are working to usher in a new era of inspection efficiencies.

TGS, SLB to Conduct Engagement Phase 5 in GoM
2024-02-05 - TGS and SLB’s seventh program within the joint venture involves the acquisition of 157 Outer Continental Shelf blocks.
2023-2025 Subsea Tieback Round-Up
2024-02-06 - Here's a look at subsea tieback projects across the globe. The first in a two-part series, this report highlights some of the subsea tiebacks scheduled to be online by 2025.

StimStixx, Hunting Titan Partner on Well Perforation, Acidizing
2024-02-07 - The strategic partnership between StimStixx Technologies and Hunting Titan will increase well treatments and reduce costs, the companies said.