
The E&P industry’s focus on returning capital to shareholders is being reflected in compensation structures for executives, Cowen equity research analysts write in a July 9 report. (Source: Hart Energy/Shutterstock.com)
The relative underperformance of E&P stocks against the S&P 500 has brought renewed focus to executive compensation, according to a recent report by the equity research team at Cowen & Co.
In the July 9 report, Cowen analysts noted that “E&P management compensation is under the magnifying glass more than ever.” However, overall E&P general and administrative expenses (G&A) and executive compensation are not out of line when compared with other industries, contrary to what investors might think, the analysts said.
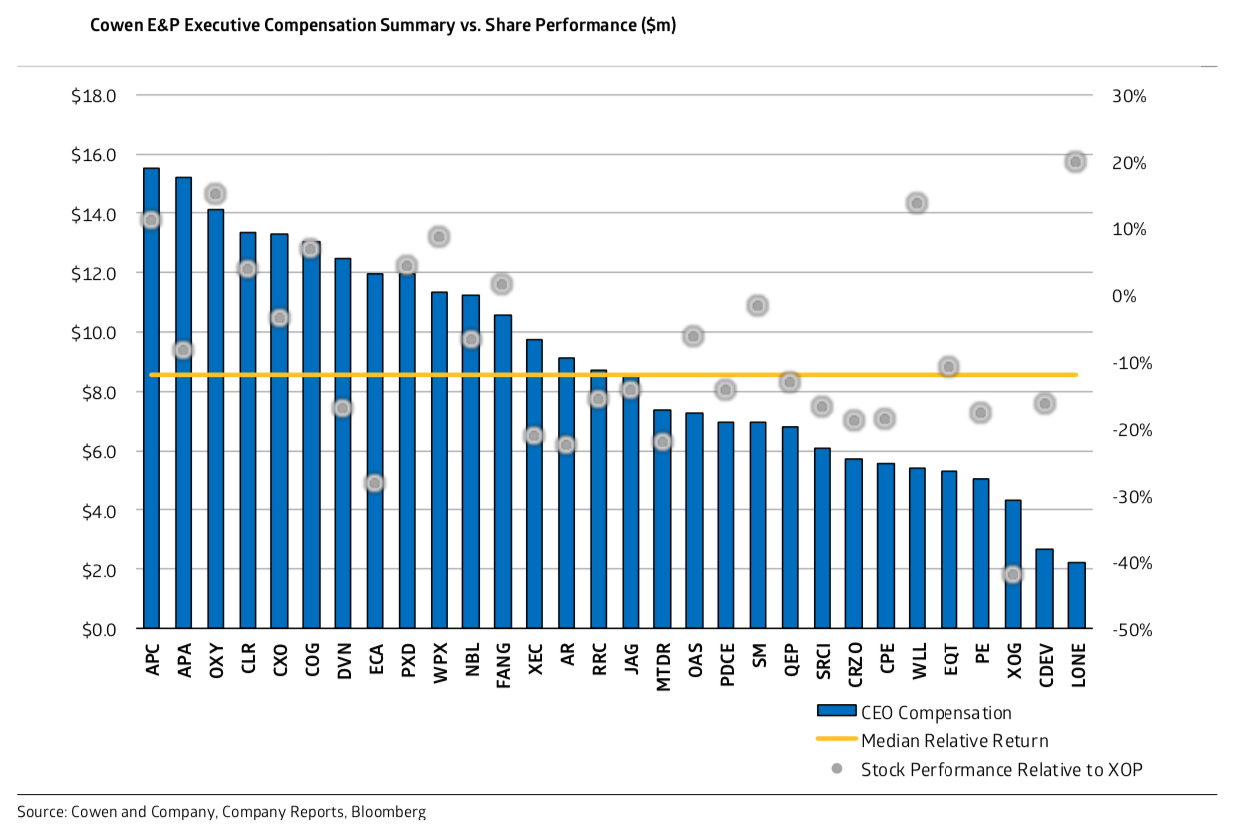
Cowen research found that on average the CEOs of E&Ps the firm covers were compensated $8.6 million for a median stock return of -40%, or -12% vs. the SPDR S&P Oil & Gas Exploration & Production ETF (XOP). For instance, Encana Corp. screens poorly “given a -28% relative return to the XOP in ’18 vs. CEO compensation that screens more than 40% higher vs. the median E&P in our coverage,” the Cowen analysts wrote in the report.
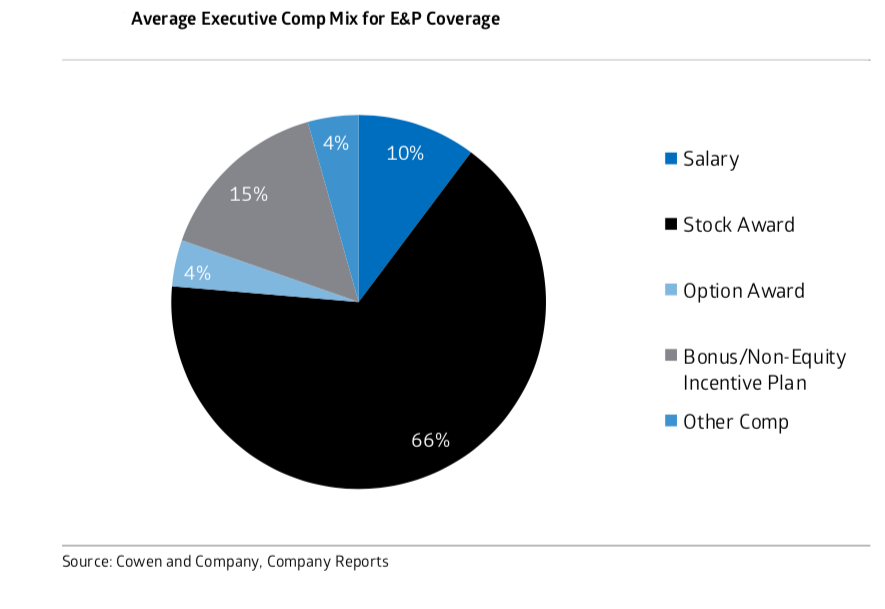
The firm’s look at total executive compensation included base salary, bonus, stock and option awards and other compensation. The analysts also noted that the fall in oil prices took a toll and that the firm’s totals weren’t compared to the stock performance of other sectors.
Among the operators scoring best on this data were Lonestar Resources US Inc. and Whiting Petroleum Corp., where CEO compensation was less than the median for E&Ps. Occidental Petroleum Corp. and Anadarko Petroleum Corp. outperformed the XOP with CEO compensation that was more than 64% and 80% vs. the median E&P, the analysts found.
They also highlighted Diamondback Energy Inc. as “among the top three efficient operators, or the most efficient operator on every [operating] metric.”
“Within our coverage alone, G&A per barrel of oil equivalent (boe) is projected to be just under $3/boe [inclusive of capitalized items], down 20% since 2017 and likely to continue to decline as companies look to bring the investing public closer to wellhead returns that are widely advertised as being 50% to 100%-plus in company presentations,” the Cowen analysts wrote.
Total G&A reviews of the E&Ps indicate that many operators plan to increase spending per rig this year.
“Against a capital disciplined/[free cash flow] orientated backdrop that’s driven a reduction in activity, G&A per rig looks set to increase in ’19 vs. ’18 for 22 of 30 operators under coverage, which could signal additional headcount rationalization ahead,” the Cowen analysts said.
As for compensation, Cowen found that as a percent of market cap, “energy executive pay is less than 0.08% on average, relatively in line with industrials, consumer discretionary stocks and utilities, and just above the average of 0.07% for several observed sectors.” Further, when compared as a percent of cash flows, executives at energy companies are lower than the average of 0.9%, at less than 0.6% of cash flows.
E&Ps tend to reward their management with equity and restricted shares rather than cash more than other sectors, according to Cowen.
“One of the more salient arguments we find is that energy executives do not own enough shares of their company, which is a fair criticism that seems to be getting addressed by compensation award weightings toward equity and other non-cash vehicles,” the Cowen analysts wrote.
Cowen research shows that energy CEOs on average own only about 0.2% of their company’s stock. At consumer discretionary companies, average stock ownership by CEOs is about 1.2%.
Led by David Deckelbaum, a managing director and senior analyst at Cowen covering the oil and gas exploration and production sector, the report comprised the analysts’ research on the compensation structures of E&Ps that Cowen covers with an emphasis on how bonus metrics could motivate strategies.

Recommended Reading
2023-2025 Subsea Tieback Round-Up
2024-02-06 - Here's a look at subsea tieback projects across the globe. The first in a two-part series, this report highlights some of the subsea tiebacks scheduled to be online by 2025.
Subsea Tieback Round-Up, 2026 and Beyond
2024-02-13 - The second in a two-part series, this report on subsea tiebacks looks at some of the projects around the world scheduled to come online in 2026 or later.
Tech Trends: Autonomous Drone Aims to Disrupt Subsea Inspection
2024-01-30 - The partners in the project are working to usher in a new era of inspection efficiencies.

Haynesville’s Harsh Drilling Conditions Forge Tougher Tech
2024-04-10 - The Haynesville Shale’s high temperatures and tough rock have caused drillers to evolve, advancing technology that benefits the rest of the industry, experts said.
Betting on the Future: Chevron Technology Ventures’ Investment Strategy
2024-04-09 - After a quarter century, Chevron Technology Ventures seeks both incremental and breakthrough technologies with its early-stage investment program.