Today’s LNG industry faces extreme price volatility and uncertainty of supply and demand. The recent oil price bust, continued growth of LNG spot trades over the last decade, and an increase in the number of LNG exporters and importers across the globe have added more complexity to the process of identifying the right market—for maximum profit—in which to trade LNG.
As a result, firms that are interested in remaining competitive and protecting profits have begun to critically evaluate their business processes and the technology that enables them. Many are exploring ways to become more efficient, cut unnecessary costs and identify incremental revenue opportunities. We examine here how LNG organizations can integrate cargo intelligence with trading insights in order to make more informed buying and selling decisions—and strengthen their competitive advantage.
The world LNG markets are seeing an unprecedented shift in the evolution and expansion of LNG exporting and importing countries. Countries such as Australia, Indonesia and Malaysia are investing to catch up with Qatar, the current market leader in LNG exports.
New demand
In addition to the Asia-Pacific region, demand is also on the rise in Egypt, Jordan, Pakistan, the Philippines, Poland and Uruguay, where investment in building regasification plants to cater to large import LNG cargoes has been on the rise.
Factors such as low crude oil prices and the upcoming increases in LNG supply from Australia, combined with Japan moving to restart some of its nuclear reactors, are causing a slump in LNG prices. This has further increased the pressure on LNG traders to stay profitable.
In fact, gas price spreads between Asia and Europe have remained volatile due to the fluctuating demand from Asian consumers, such as Japan, South Korea, China and India.
Weather’s impact
Historically, weather events, such as hurricanes and tsunamis, can have a big impact on LNG prices. For example, in March 2011, the tsunami on the eastern coastline of Japan led to the Fukushima power plant nuclear disaster, which ultimately resulted in shutting down approximately 50 Japanese nuclear reactors. This accelerated the LNG price in the Asian market and created a sharp increase in the gas spread price between Japan and Europe—making Asia a more favorable destination to trade LNG post-March 2011.
Similar market events, such as the addition of a new LNG supply plant in Papua New Guinea, which started shipping LNG to Asia in May 2014, and a dip in crude oil prices per barrel from $100 to $60 by the end of December 2014 created a slump in the LNG price.
In recent years, the number of LNG tanker fleets has been growing. There are roughly 450 LNG tankers in service and many more under construction. However, earnings for LNG shipowners have been cut in half to $70,000 per day as compared to 2011. Since shipowners receive a thin margin, the market has grown increasingly competitive and more pressure has been put on charterers and shipowners to maximize margins.
With commercial analysts, traders and charterers monitoring the LNG market, it is critical that they have a comprehensive view of global LNG cargo movement and receive timely alerts in case there are LNG cargo diversions, port closures and weather alerts. Often, this work is done manually, such as in fixture data collection from various brokers, and in silos by regional analysts, resulting in inefficiencies, delayed data availability and error-prone results.
Energy intelligence
Given the high volatility of LNG prices tied to such market and weather events, LNG traders are using advanced simulation algorithms, or energy intelligence platforms, in order to build forward-looking views listing the expected LNG imports and exports by destinations or cargo ownership. This, in turn, will enable them to make real-time decisions to divert, buy or sell an LNG cargo as a result of these events.
Such unique digital platforms integrate available trading insights with cargo intelligence information. They help firms gain a competitive advantage and increase profit margins by using advanced data visualization and analytical capabilities that allow them to make informed commercial decisions.
In order to build an energy intelligence platform, the following tasks should be considered:
• Gather cargo information (from the current day to 90 days out) from multiple market data providers. This cargo information includes volume of product, vessel International Maritime Organization number/name, source and destination terminal information, estimated load and discharge dates and counterparty information;
• Collect the annual product import/export plans of company-owned LNG liquefaction and regasification plants, or refineries in the case of products, and overlay that with cargo information;
• Allow traders to enter proprietary market intelligence information, such as knowledge around cargoes that are in transit or anticipated LNG plant shutdowns;
• Integrate with the Automatic Identification System data feed to plot the real-time location of the vessels as well as identify diversions and where cargo is heading;
• Indicate whether the vessel is loaded via algorithms that can use the draft percentage; and
• Integrate with weather alerts or port closure alerts prompting businesses to take the required action.
Then, offer these various analytical views to different user segments:
Traders—The views show the real-time location of ships and how much cargo is on the water, along with their estimated time of arrival.
Analysts—The forward, 90-day view and historical data can be used to forecast supply and demand imbalance.
Charterers—The data can be used to assess traffic around terminals to understand seasonality patterns and assess the inbound vs. outbound traffic at LNG terminals. Higher inbound traffic at a terminal presents the opportunity to negotiate a better shipping rate with the shipowner.
Schedulers—Real-time weather alerts and port closure alerts can help schedulers make better decisions, and track if cargo is on board and whether a vessel has reached its destination on time.
Risk Professionals—The data can help ensure that price risk is hedged properly and is in line with the physical delivery of the cargo. For example, in case of cargo delays, hedging may need corrections.
Note that an energy intelligence platform is not restricted to LNG. It can also be applied to various other commodities, since the steps will remain the same but just the underlying data will change.
Why now?
Traditionally, the LNG market was dominated by long-term, offtake contracts. Without these, it would not have been possible to make significant capital investments in extraction, transportation, storage and regasification that are all necessary to build the LNG supply chain.
But over the years, the short-term/spot LNG market has been growing and reached the 30% mark (30% of the total LNG traded or 70 million metric tons in 2014). Factors, such as high volatility of LNG prices due to sudden market and weather events, seasonal gas consumption peaks and delays or disruption of gas domestic production, in conjunction with growing demand for cleaner and safer energy fuel, are essentially driving the LNG spot market. They have created the need for an LNG energy intelligence tool that can help businesses make faster and better commercial decisions.
Critical success factors
In order to establish an energy intelligence platform, companies need to ensure core capabilities in data quality, analytics and visualization and business change management. Underlying data quality is critical for the platform to be successfully implemented and adopted. Since data may be collected from different sources, identifying the right data feed provider is important.
If a company uses multiple market data providers, the same data may enter the system twice, requiring an intelligent solution that can discard duplicates. It is also possible that two brokers will provide different cargo destination information for the same vessel. In that case, a data feed priority mechanism can be used, or the user can be prompted to override the destination.
Today’s enterprise users are demanding more from their workplace software applications than ever before. With advances in front-end technologies, and touchscreen uses and gestures constantly being defined, more organizations are leveraging user-centered design professionals in order to carefully architect and design their software applications. This approach provides a greater emphasis on system intelligence and drives insight not previously possible.
With good visualization, it is critical that data is well correlated to provide meaningful business insight that drives faster analysis and better decision-making.
Change management
Change management is critical for solution adoption. If not handled properly, a new platform or solution can cause confusion, lost opportunity, wasted resources and poor morale. Typically, business users are resistant to change if not engaged in the right way. The adoption of an energy intelligence platform that drives commercial decisions can become even more challenging due to its complexity.
Therefore, the key to success is to engage business users from day one—involve them in iterative checkpoints to ensure data quality and usability issues are tacked upfront, and use actual data to drive day-to-day decisions (i.e., stay in parallel mode for a while before moving to production) as part of testing to gain business user confidence.
As the LNG market continues to fluctuate, trading organizations that come out ahead will need to re-envision how they make decisions—and the tools they use to gain intelligence. An energy intelligence platform can give them the technology solution they need to integrate cargo intelligence with trading insights in order to make more informed buying and selling decisions. But to be successful, they will need to focus on data quality and management, explore new approaches, such as visualization, and ensure adoption by establishing well-planned business change management.
The authors are with Sapient Global Markets. Ritesh Sehgal is a senior manager in the trading and risk management practice, Parry Ruparelia leads the user experience and visualization practice, and Sidhartha Bhandari is a director, advising on establishing and managing commodity trading and risk management and IT transformation programs.
Recommended Reading
Rhino Taps Halliburton for Namibia Well Work
2024-04-24 - Halliburton’s deepwater integrated multi-well construction contract for a block in the Orange Basin starts later this year.

Halliburton’s Low-key M&A Strategy Remains Unchanged
2024-04-23 - Halliburton CEO Jeff Miller says expected organic growth generates more shareholder value than following consolidation trends, such as chief rival SLB’s plans to buy ChampionX.
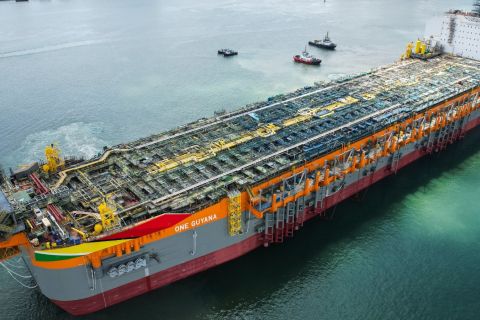
Deepwater Roundup 2024: Americas
2024-04-23 - The final part of Hart Energy E&P’s Deepwater Roundup focuses on projects coming online in the Americas from 2023 until the end of the decade.
Ohio Utica’s Ascent Resources Credit Rep Rises on Production, Cash Flow
2024-04-23 - Ascent Resources received a positive outlook from Fitch Ratings as the company has grown into Ohio’s No. 1 gas and No. 2 Utica oil producer, according to state data.

E&P Highlights: April 22, 2024
2024-04-22 - Here’s a roundup of the latest E&P headlines, including a standardization MoU and new contract awards.