
Overall, 93% of the companies Opportune surveyed hedged some level of commodity price risk, with swaps, collar and three-way options the most popular instruments. (Source: Hart Energy)
Hedging has long been a way for U.S. oil and gas producers to protect against the volatility of commodity prices.
A recent survey from Opportune LLP notes that while natural gas prices were relatively flat in 2018, crude prices rose from $60 per barrel (/bbl) to nearly $75/bbl during the first three quarters. Then, in the fourth quarter, natural gas spiked briefly while crude fell to $45 from $75.
The fourth-quarter drop was the most severe decline in crude prices since 2014, according to Opportune’s derivative valuation and commodity risk management advisory group.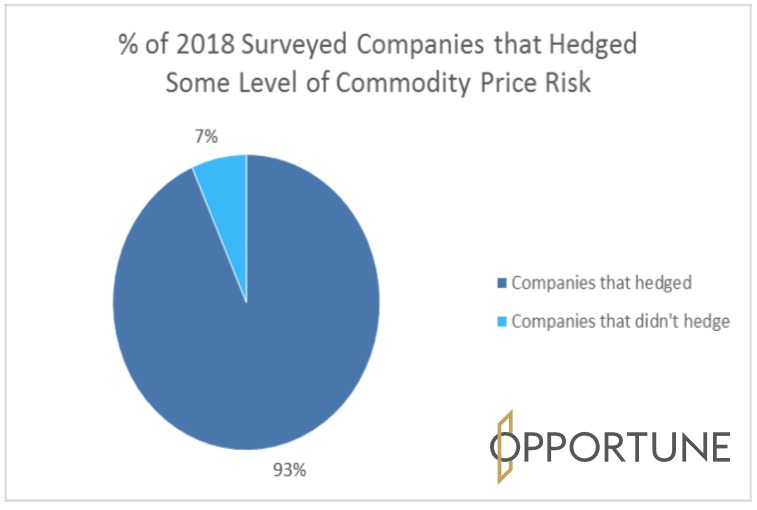
The Houston-based firm surveyed the hedging positions of 30 of the largest public oil and gas producers as disclosed in their Dec. 31, 2018, 10-K filings. The results show that swaps continue to be the preferred instrument for both natural gas and crude oil; however, the use of swaps decreased from the prior year while purchased puts were on the rise for public companies.
“For a producer, swaps provide the highest amount of downside protection,” noted the survey’s authors Shane Randolph, managing director, and Josh Schulte, manager.
The authors noted that swaps, however, limit upside price protection.
“This leads producers to utilize purchased puts, which can be costly, or costless collars, which allow the producer to participate within a range of price movements,” they said.
A challenge for producers is how far out to hedge production because if prices increase, they may be giving up upside.
“Based on the survey results, it is common for companies to hedge some level of the prompt 12-month period representing 2019,” the authors said. “A higher percentage of companies hedged crude than natural gas in 2020. However, it is interesting to note that more companies have hedged natural gas in 2021 to 2023 than crude.”
The authors believe this may reflect a more conservative view of natural gas price potential.
The Opportune managers also noted that “as a hedging program is intended to increase cash flow predictability, the price level at which companies execute hedges is often heavily influenced by operating budgets and debt compliance.”
 So, what price levels did companies hedge at as reported in their 10-Ks?
For the 27 companies that disclosed hedged price levels, the average swap price for crude was $57.85/bbl for 2019 and $61.30/bbl for 2020, according to the survey results. Natural gas averaged $3.05 per million British thermal unit (/MMBtu) for 2019 and $2.82/MMBtu for 2020.
Meanwhile, the average put price—non-three-way—for crude was $57.96/bbl for 2019 and $58.21/bbl for 2020. Natural gas was $2.93/MMBtu for 2019 and $2.74/MMBtu for 2020.
Opportune noted that few companies disclosed the amount of their forecasted production that was hedged as of year-end 2018. Only seven companies made this disclosure. For those producers, the average hedge level for crude was 47% of forecasted 2019 production and 62% of forecasted natural gas production. (These hedge levels include coverage provided by three-way options.)
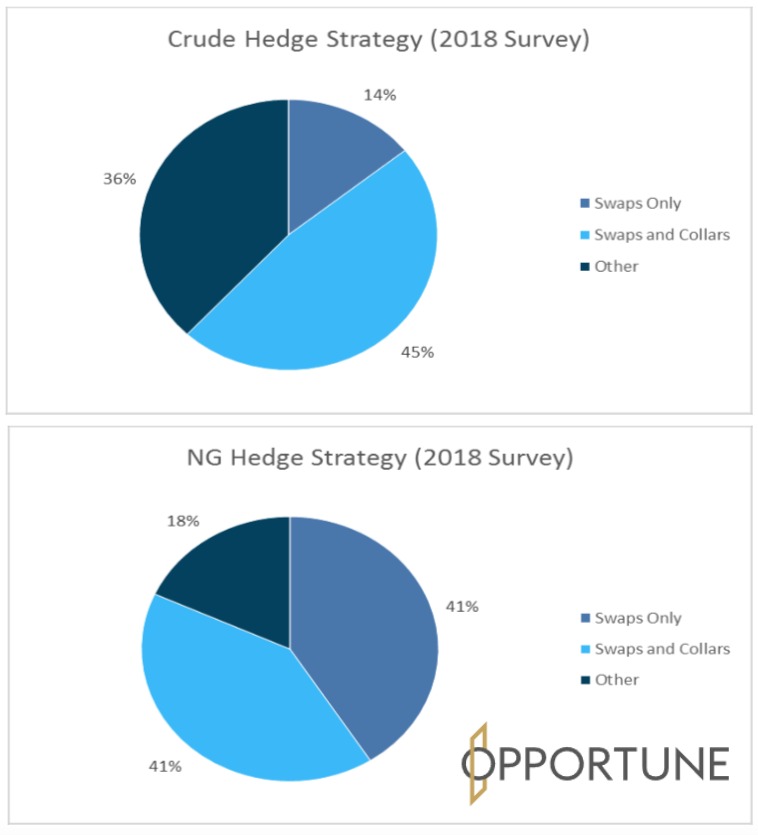
Overall, 93% of the companies surveyed hedged some level of commodity price risk, with swaps, collar and three-way options the most popular instruments. For 2018, 45% of companies surveyed use swaps and collars, 30% used other, and 14% used swaps only for crude. For natural gas, 41% used swaps and collars, 41% used swaps only, and 18% used other.
As for hedge length, 79% of companies were 12 months out on crude, 57% were 24 months out and 4%were 36 months out. For gas, 79% were 12 months out, 39% were 24 months out, 14% were 36 months out and 11% were 48 months and 60 months out, for each period.

Recommended Reading
US Raises Crude Production Growth Forecast for 2024
2024-03-12 - U.S. crude oil production will rise by 260,000 bbl/d to 13.19 MMbbl/d this year, the EIA said in its Short-Term Energy Outlook.
Iraq to Seek Bids for Oil, Gas Contracts April 27
2024-04-18 - Iraq will auction 30 new oil and gas projects in two licensing rounds distributed across the country.

Oceaneering Won $200MM in Manufactured Products Contracts in Q4 2023
2024-02-05 - The revenues from Oceaneering International’s manufactured products contracts range in value from less than $10 million to greater than $100 million.
E&P Highlights: Feb. 5, 2024
2024-02-05 - Here’s a roundup of the latest E&P headlines, including an update on Enauta’s Atlanta Phase 1 project.
CNOOC’s Suizhong 36-1/Luda 5-2 Starts Production Offshore China
2024-02-05 - CNOOC plans 118 development wells in the shallow water project in the Bohai Sea — the largest secondary development and adjustment project offshore China.