
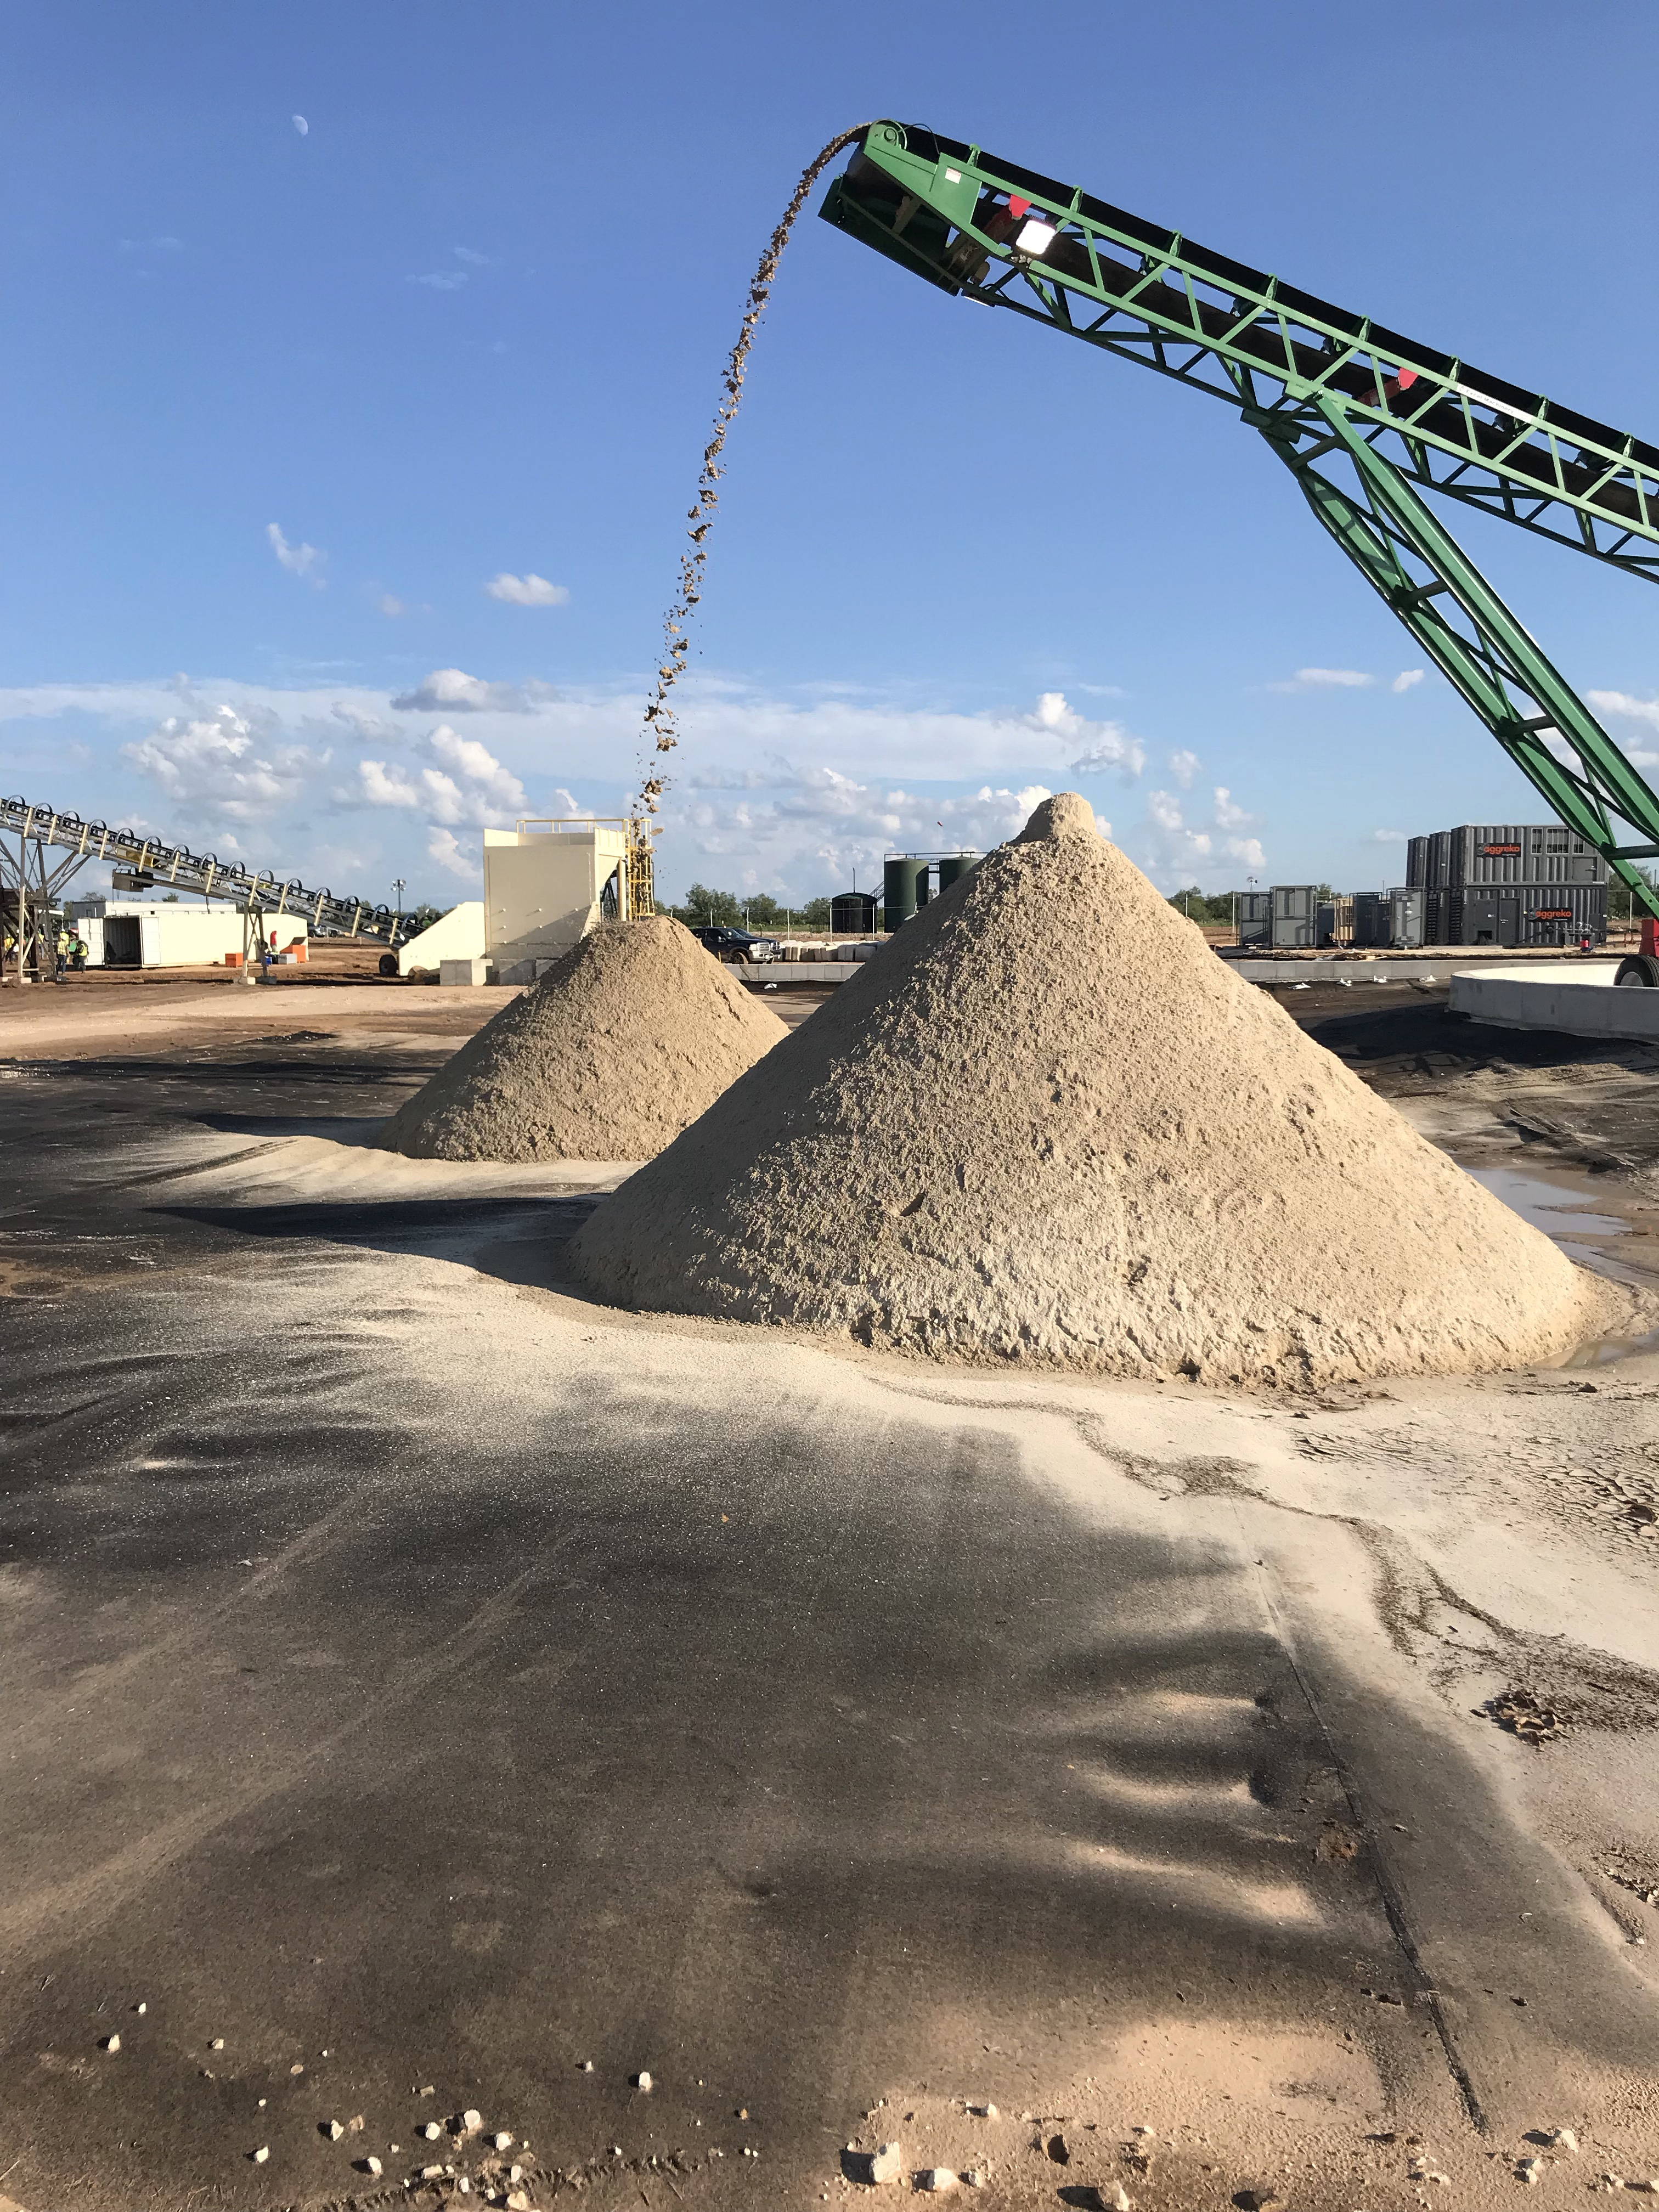
Raw sand is screened of debris, washed of clays and decanted to begin the drying process for Black Mountain Sand’s Winkler White sand product. (Source: Black Mountain Sand)
Disruptive technologies overturn traditional business models. Examples of such disruption abound. Social networking, smartphones and even low-tech frac sand have all significantly disrupted the status quo in their unique way.
With the advent of modern-day directional drilling and hydraulic fracturing techniques, oil and gas players in the shale space have spent millions of hours and dollars dialing in the optimal approach to developing their acreage efficiently and effectively.
That cycle of improvement did not end with the plunge of oil prices in the summer of 2014. Adjustments were made, costs were cut and a new era of capital discipline began. New trends emerged from this cycle, furthering the debate between short-term cost savings and long-term well productivity and upsetting traditional business models in the process.
Take proppants, for example. The decision to reduce or even eliminate the use of coated or ceramic proppant in favor of cheaper, more abundant sand is one example of the type of “cost-saving efforts that drove innovation that has now become the preferred completion method,” according to Brandon Savisky, a senior market research analyst at IHS Markit.
“Frac sand is the lowest cost proppant available, even at the fine mesh sizes demanded today,” he stated in an August 2018 IHS Markit report. “The move toward larger volumes of finer-mesh sands enabled many producers to maintain production levels.”
Sand demand for just the Lower 48 will reach 105 MMtons in 2019 and 116 MMtons in 2020, according to an Energent Westwood Global Energy Group presentation at a recent Petroleum Connection’s Frac Sand Industry Update held in Houston.
A January 2019 IHS Markit report forecasts that U.S. and Canadian proppant demand is estimated to reach 247 billion pounds (123 MMtons) by 2023, representing nearly triple the demand since 2013.
The growth in sand demand is due to increased proppant intensity per lateral foot, longer lateral lengths, increased stage counts and finer sand sizes, according to IHS Markit.
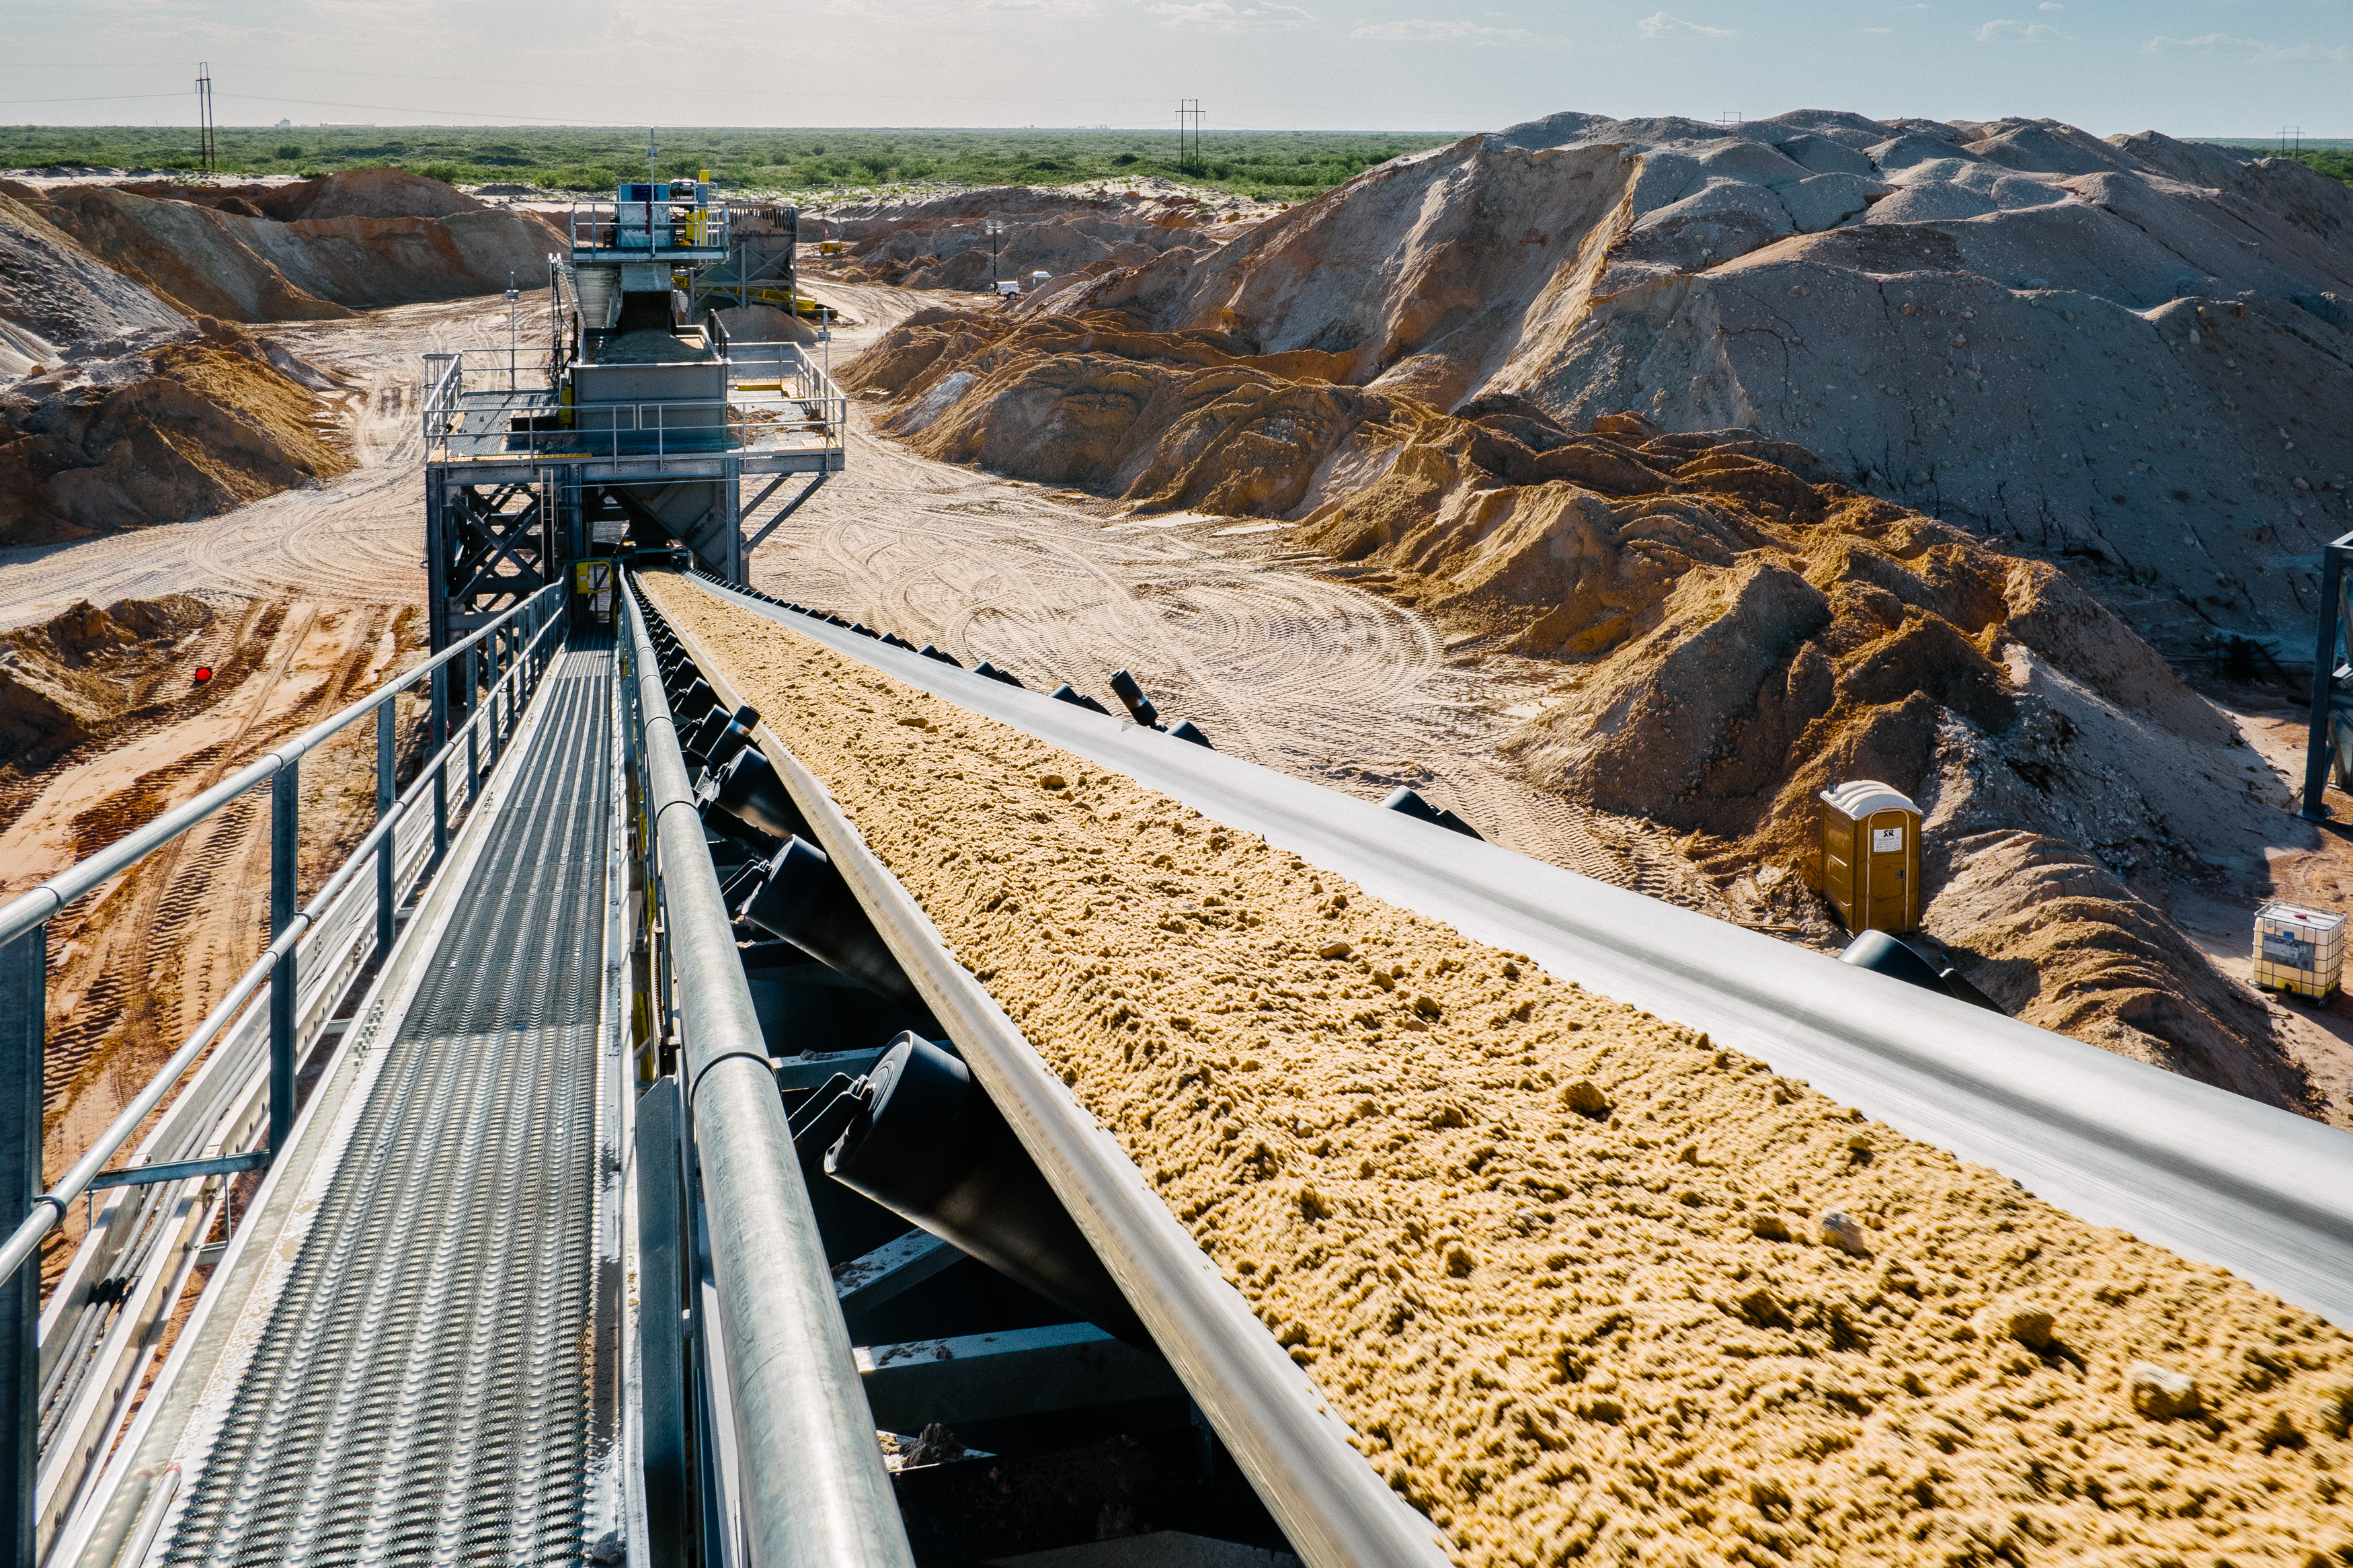
In pursuit of the lowest cost and most efficient option, there’s been a gradual shift by operators away from the preferred Northern white sand from mines in Wisconsin and other northern states to regional, or in-basin, sand from mines closer to home. These mines can now be found in the Permian Basin and Eagle Ford plays of Texas, the Scoop/Stack play of Oklahoma, the Haynesville of Louisiana and more.
“Northern white sand supply has evolved over time,” Ryan Carbrey, senior vice president of shale research for Rystad Energy, told attendees at the Petroleum Connection conference, adding that 75% of the frac sand market in 2014 was Northern white sand, with that number diminishing to 34% of the market by the end of 2020.
Nowhere has this been more evident than in the bustling Permian Basin. As the nation’s largest producing area, oil production in the region reached nearly 4 MMbbl/d in March, an increase of 43,000 bbl/d over February production and a 33% jump since the same period in 2018, according to the U.S. Energy Information Administration’s (EIA) monthly Drilling Activity Report.
To cut completion costs and reduce the logistical headaches of shipping Northern white sand some 2,100 km (1,300 miles) by rail at about $50/ton, Permian producers found a suitable and plentiful alternative in the desert sands surrounding their operations.
“We see a continuous shift, with every single change between the products being in favor of the most cost-efficient option,” said Hayden Gillespie, COO for Black Mountain Sand. “If you look at the transformation going from ceramic proppants to where we are today, which is 40/70 and 100 mesh and in-basin sand, every single step along the way has been in favor of cost reductions.”
In the span of two short years, the number of frac sand mines in the Permian Basin jumped from zero to more than 20. For 2019, 80 MMtons of frac sand supply from 23 mines are anticipated for the region, according to the Energent Westwood Global Energy Group presentation.
The adoption of local sand brought with it increased focus by operators on ensuring ready access to sand while technology innovations helped improve transporting sand from the mine to the wellhead.
“Sand is the ultimate bulk logistic commodity,” said Taylor Robinson, president of PLG Consulting. With more than 18 years of experience working with clients on their bulk logistics needs, the firm has been witness to the shifting trends in frac sand logistics.
“Eight years ago, it was all about assurance of supply. Companies wanted to make sure they had their entire supply chain locked in,” Robinson shared with attendees at the Petroleum Connection conference. “Since then, we’ve had more than 60 projects of all sort and varieties.”
According to Robinson, current trends in the frac sand space are the adoption of in-basin sand and improvements in last-mile logistics. On the surface, both appear to be standalone challenges, but in reality they are tightly interconnected, with discussion about one eventually involving the other.
Shifting to local
The quality of in-basin sand versus Northern white sand has been a point of contention between sand miners. In-basin sand, particularly from the Permian Basin, was long ignored in favor of Northern white sand, which is regarded as the “gold standard” due to its higher crush loads and conductivities. However, the widespread adoption of in-basin sand demonstrates the industry’s acceptance of its use.
“We have found that in-basin sand is of sufficient quality for the basins that we’re servicing. If you look at the Permian, initially there was a six-month period where operators worked to understand the data needed to understand how it would work in their applications,” said Black Mountain Sand’s Gillespie. “As they did, many trialed it and drew their own empirical data from actual results. Every public datapoint has concluded that these operators have validated their initial suspicions, which are that the product is of sufficient quality to function as a pure substitute.”
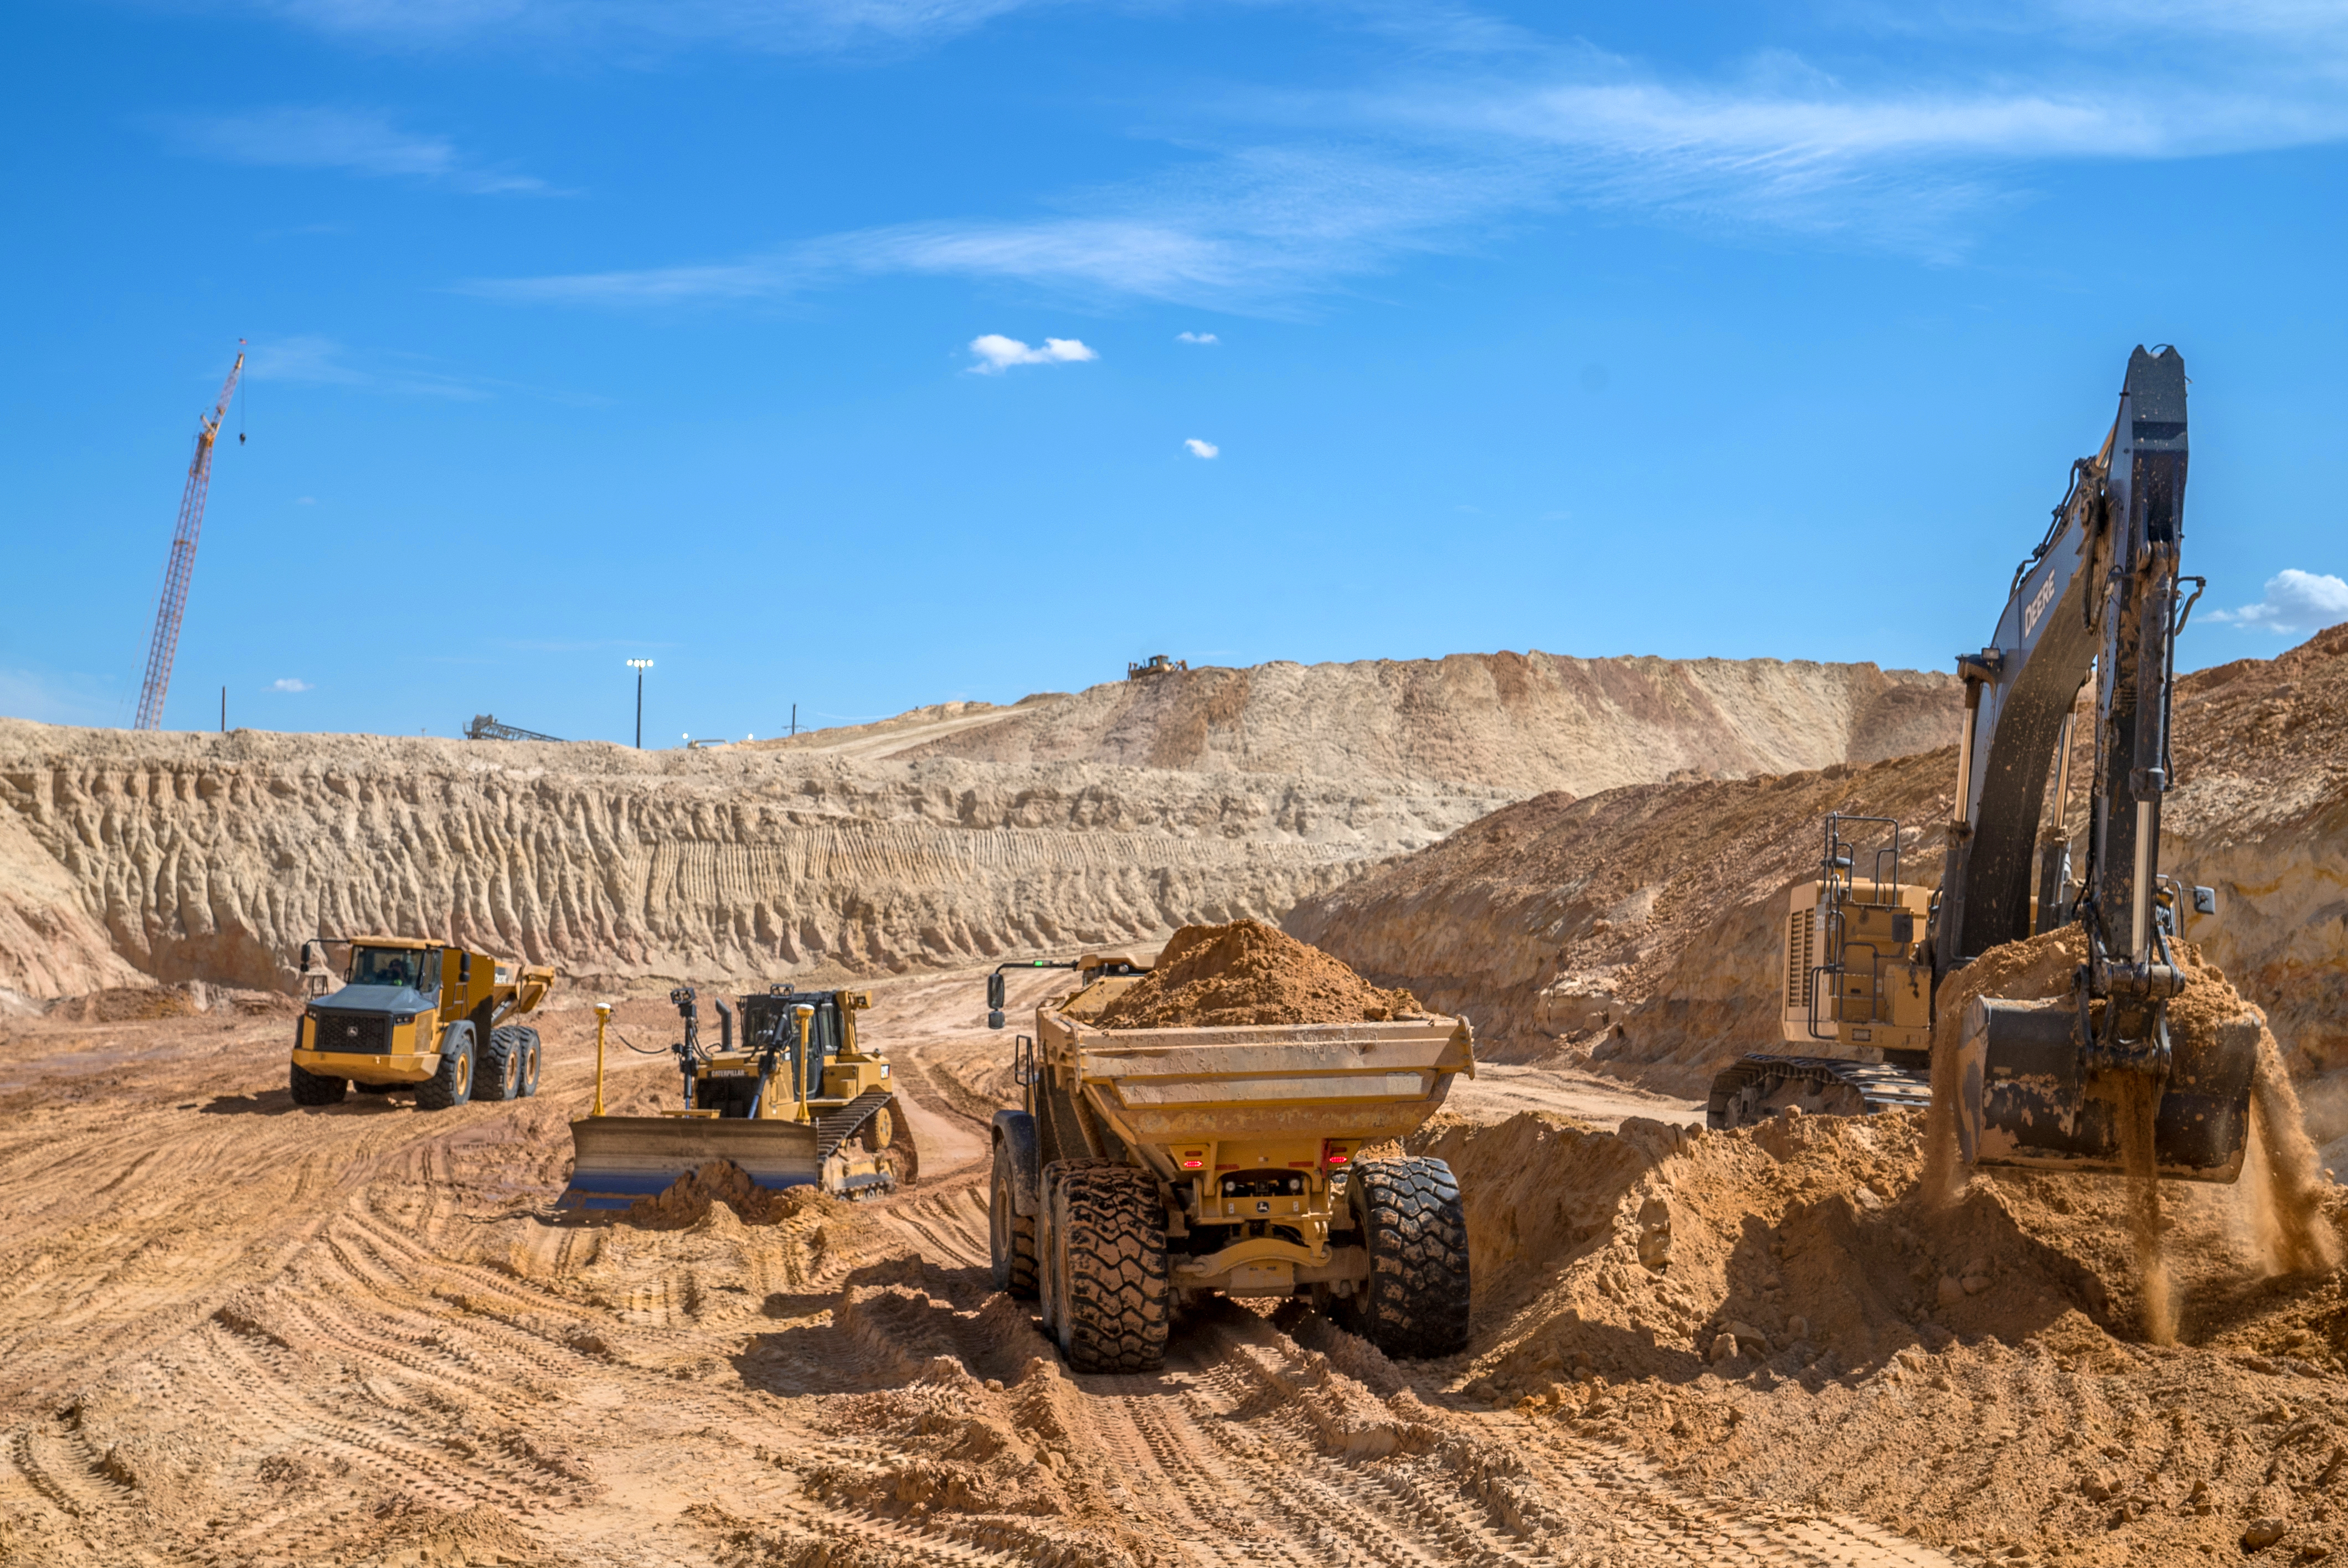
With three sand mines located in Winkler County, Texas, Black Mountain Sand’s capacity is 13 MMtons/year, or about 565,000 truckloads worth of sand per year, according to the company.
“In-basin sand offers a more simplified supply chain, where now it is about moving sand from the mine to the silos, from the silos to the truck and from the truck on to the well site,” he said. “Many discussions over in-basin sand have been centered on the cost savings as a value proposition, but I would say equally, if not more important, is the value proposition of a simplified supply chain.”
For Black Mountain Sand, turning those trucks from silo to well site is done with a total gate-to-gate time averaging under 10 minutes, with just 2.5 of those minutes spent filling the truck, according to the company.
“In our minds there is no debate. The operators have voted, and they voted with their wallets; they are all in on in-basin sand,” said Hunter Wallace, COO for Atlas Sand Co. “There are always going to be slower adopters—for example, the move from man-made proppant to natural sand did not happen overnight; however, I believe this shift to in-basin sand has moved much quicker than that shift did. Bottom line is that the in-basin sand is not going to negatively affect the well performance whatsoever.”

Atlas Sand operates two open dune sand mines located on both ends of the Winkler Sand Trend that stretches across Winkler and Ward counties. According to Wallace, the locations allow the company to ship sand from the northern and southern portions of the trend, giving them a unique logistical advantage. The company’s sand capacity is 8 MMtons/year, split evenly between its mines located in Kermit and Monahans.
“With two plants, we have an increased level of redundancy and backup,” Wallace said. “When one plant has an issue, having that other plant there increases the reliability of delivery to our customers substantially.”
Billy Ray Smith, senior vice president and president, Oil & Gas Proppants for U.S. Silica, brings a different perspective to the conversation in that the company offers both Northern white and in-basin sand options.
“From a sand quality perspective, not all in-basin sands are created equal,” Smith said. “We have two mines in the Permian. If I take a blended average, the crush values for those are between 9 and 10K on 100 mesh and 7 to 8K on 40/70; compare to a traditional Northern white material, it’s pretty close. There’s only about a 10% reduction over what the industry would call a Northern white 100 mesh or 40/70.”
However, there is still a need for the higher crush strengths offered by Northern white sand, according to Smith.
“Most of our customers tell us, for the middle of the Permian Basin, that those values are good enough for their wells, and they don’t expect to see a big production differential. However, others are telling us, more toward the deeper Delaware Basin, that they still need a higher crush strength; they need more of a 10K 40/70, so to get that we have to source our Northern white material that would come from Wisconsin and Illinois.”
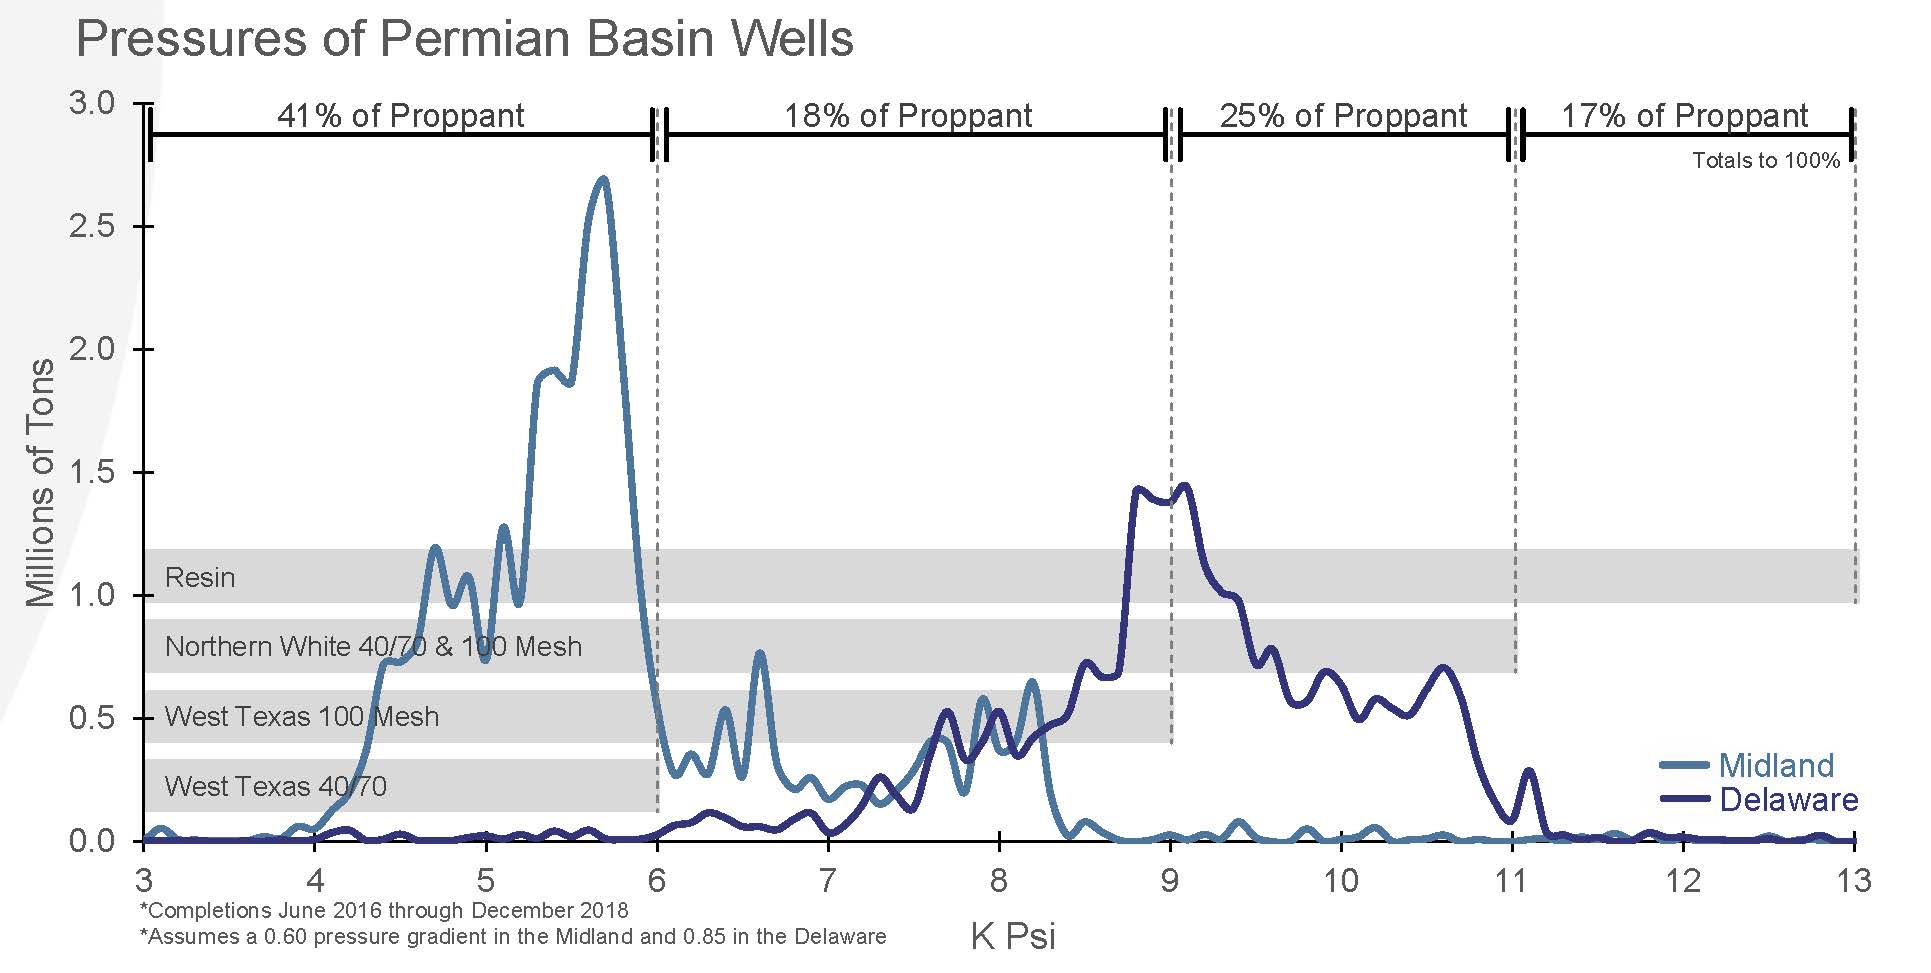
This observation about the Delaware Basin is one that Erik Nystrom, vice president of strategic marketing for Covia, discussed in his presentation at the Petroleum Connection conference. Nystrom presented the results of a study the company conducted that looked at the closure stress at which the proppant was being consumed, and how that compared with technical limitations of various products on the market.
According to Nystrom, proppant consumption and proppant crush strengths (K-values) were graphed out to try to understand technical viability of each sand type by play. Well data available as of January 2019 for the period between June 2016 through December 2018 were aggregated including proppant consumption totals. On-staff petroleum engineers were consulted to apply a pressure gradient to convert true vertical depth into closure stress. Well data were grouped by closure stress every 100 psi and graphed to come up with a curve showing proppant consumption by pressure, with the K-values of various proppants then underlaid. The proppant percentage was then calculated based on K-values to indicate how much of a play’s demand for a given proppant type would be “fit” for use.
What the graph showed was that a majority of Delaware Basin wells appeared to present closure stress in excess of in-basin sand capabilities.
To confirm if the proppant usage graphs matched with actual performance, Covia researchers tested the endurance of the various proppant substrates by conducting a long-term conductivity study according to American Petroleum Institute’s 19D standards.
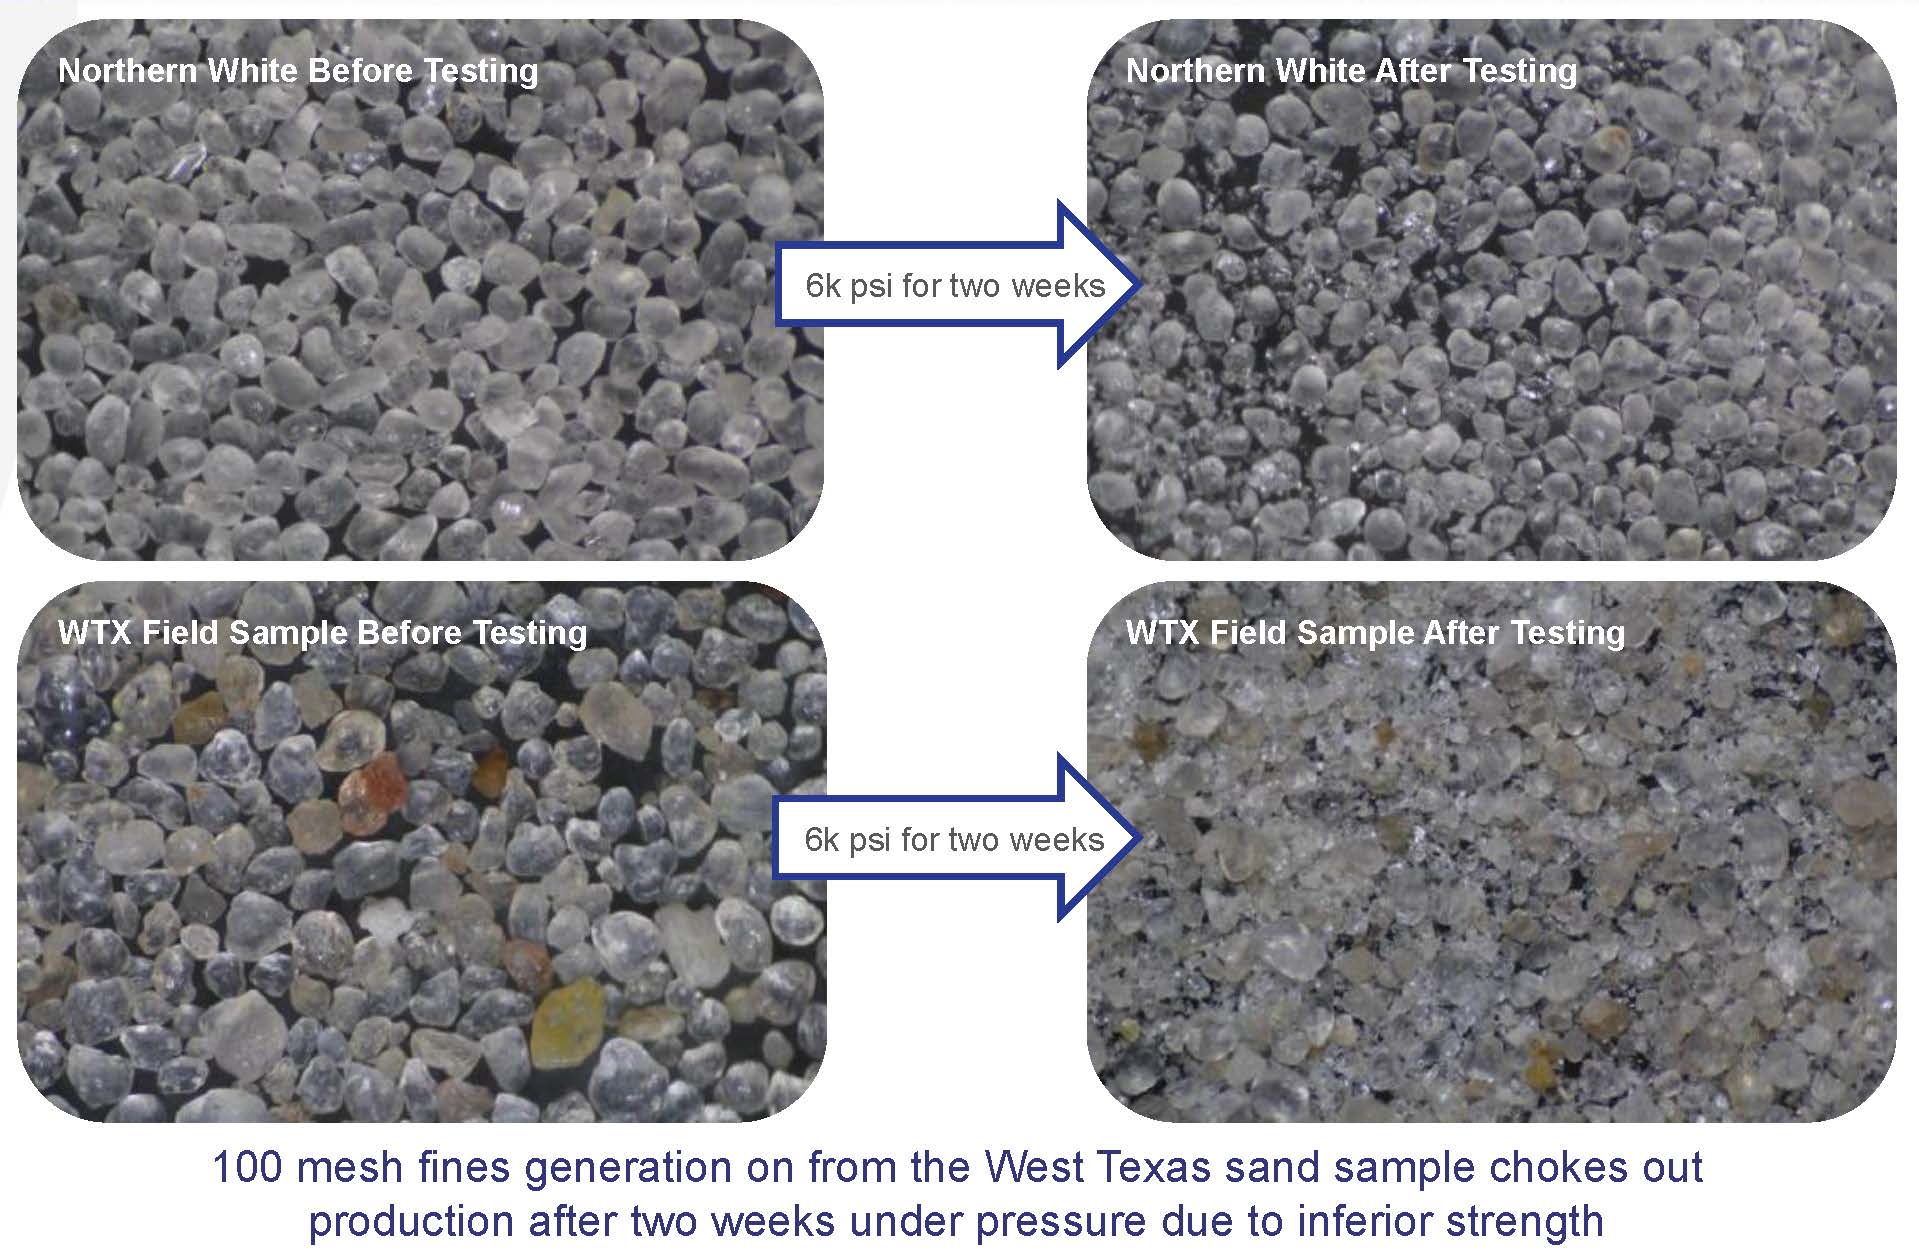
The study held the sample at a continuous 6,000 psi for 14 days. The samples used in testing were sieved both before and after the test to understand how particle size distribution changed over the course of the test. Images were taken before and after testing using a stereo microscope to visually show the physical changes in material. Samples sent to Stim-Lab for third-party validation confirmed similar trends seen in Covia’s in-house testing.
Testing showed that the performance advantage for 100 mesh went to Northern white sand, Nystrom said. The in-basin sample generated 24% fines, causing a 60% decline in conductivity despite acceptable K-values, he noted. The Northern white sample experienced a 16% decline in conductivity and generated 4% fines.
“The next question we asked was from a net present value [NPV] standpoint,” Nystrom said. “At what point does the NPV become essentially neutral to pay more for the Northern white sand versus the cost savings?”
“What we found, once we did all the math, is a reduction in production. If the well under performs by anywhere between 2% and 5%, it is essentially cost neutral between the in-basin sand and Northern white,” he added. “Any more than that, within one year, it very much favors the Northern white sand. We see that significant IP decline in the Delaware Basin, specifically 8% on the whole, but for local sand adopters about a 20% reduction.”
The study examined proppants currently in use in all of the major shale basins and further analysis continues, according to Nystrom.
Going the distance
On the surface, getting the sand from the mine to the well site appears to be a simple process of fill up the truck, drive to the site, drop off sand and repeat. Advances in silo and storage containers have provided producers with options for meeting their last- mile logistical needs. However, the immense scale of the operations brings with it layers of complexity that producers and miners alike are turning to digital technologies to ensure all the components in the process flow smoothly.
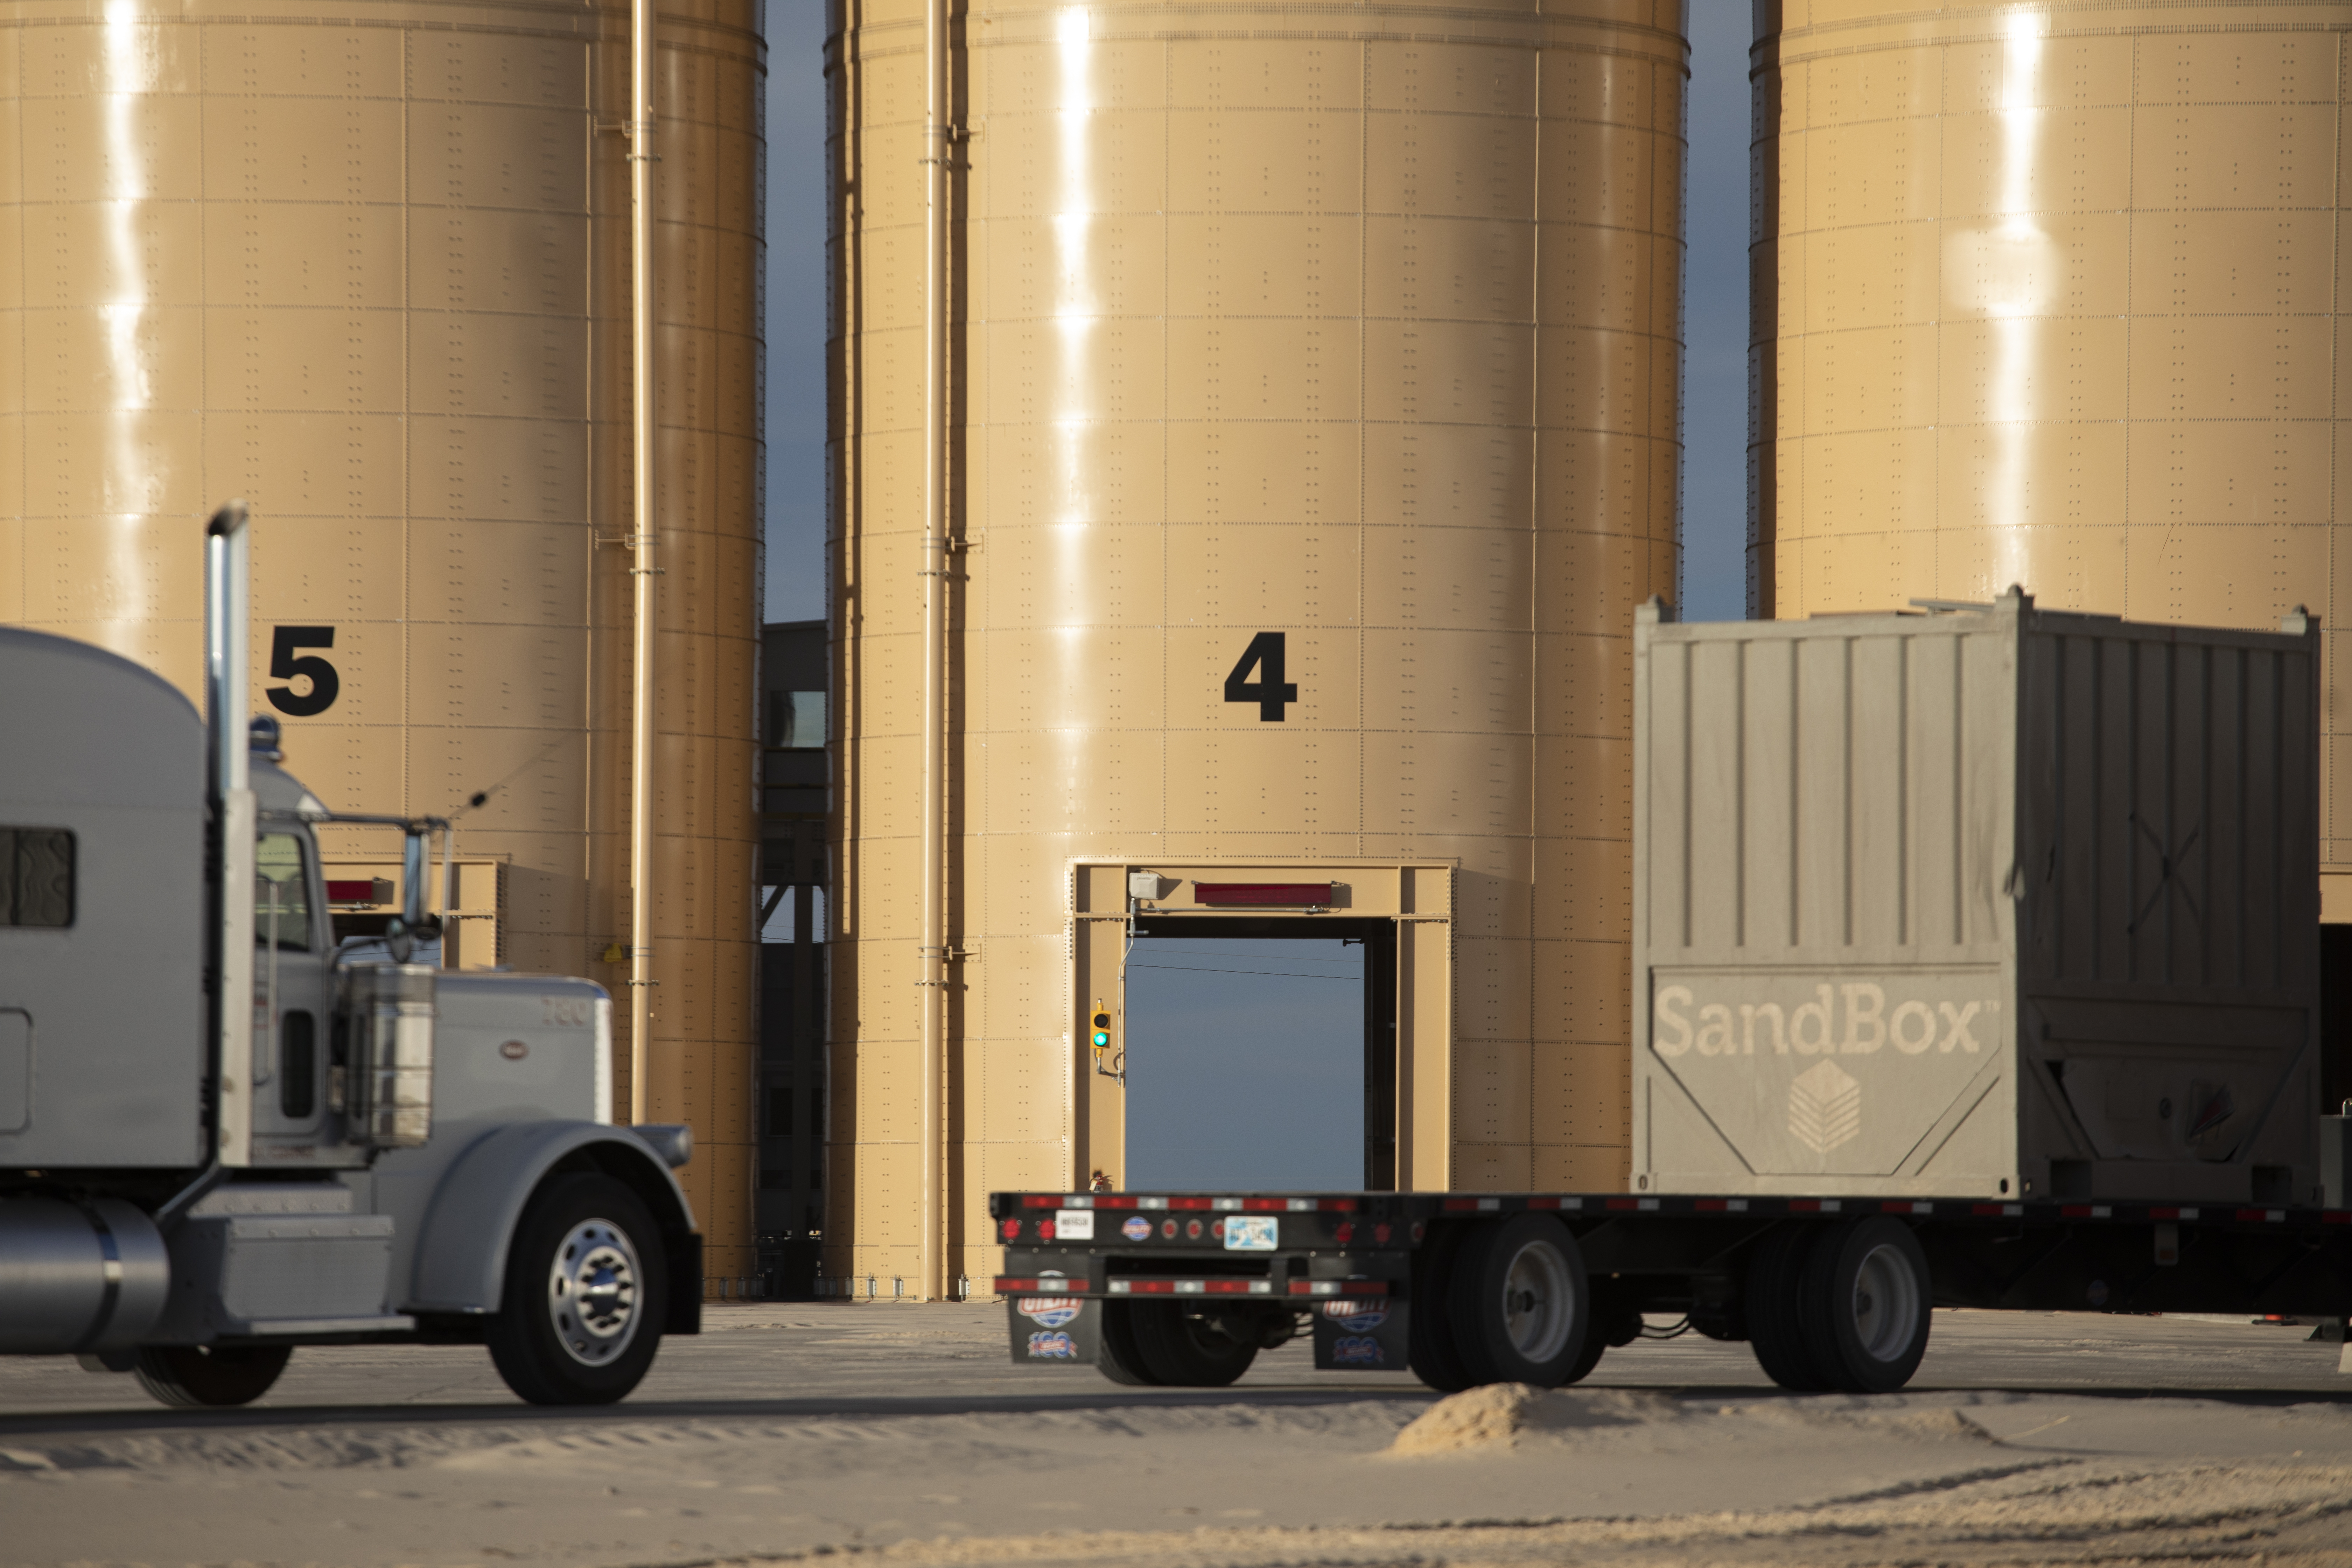
Sandbox Logistics, a U.S. Silica company, provides mobile containerized solutions that, depending on the grade of sand, can hold up to 25 tons.
“The boxes are loaded onto our trailers, and the sand is put directly in the box at the mine or the transload facility, depending on where we’re at. Then we haul the boxes to the well site,” said Daniel Miers, president of Sandbox. “Once there, we set up the supply on our ‘dance floor,’ or rigmats, with the supply consisting of anywhere from 50 to 100 boxes depending on the size of the well. That supply we keep filled, so there are more boxes constantly dropped off and empty boxes collected to ensure that our customer always has a constant sand supply to reduce nonproductive time on location at all times.”
In one way or another, every task completed by a logistics provider is tied to technology.
“All of our facilities provide visibility to onsite inventory and real-time shipment tracking, which is critical to running a wellhead efficiently. Additionally, many of our terminals are rail-served with unit-train capability, lowering the customers supply chain costs and increasing efficiency,” said Justin Renfro, president of OmniTRAX Energy Solutions.
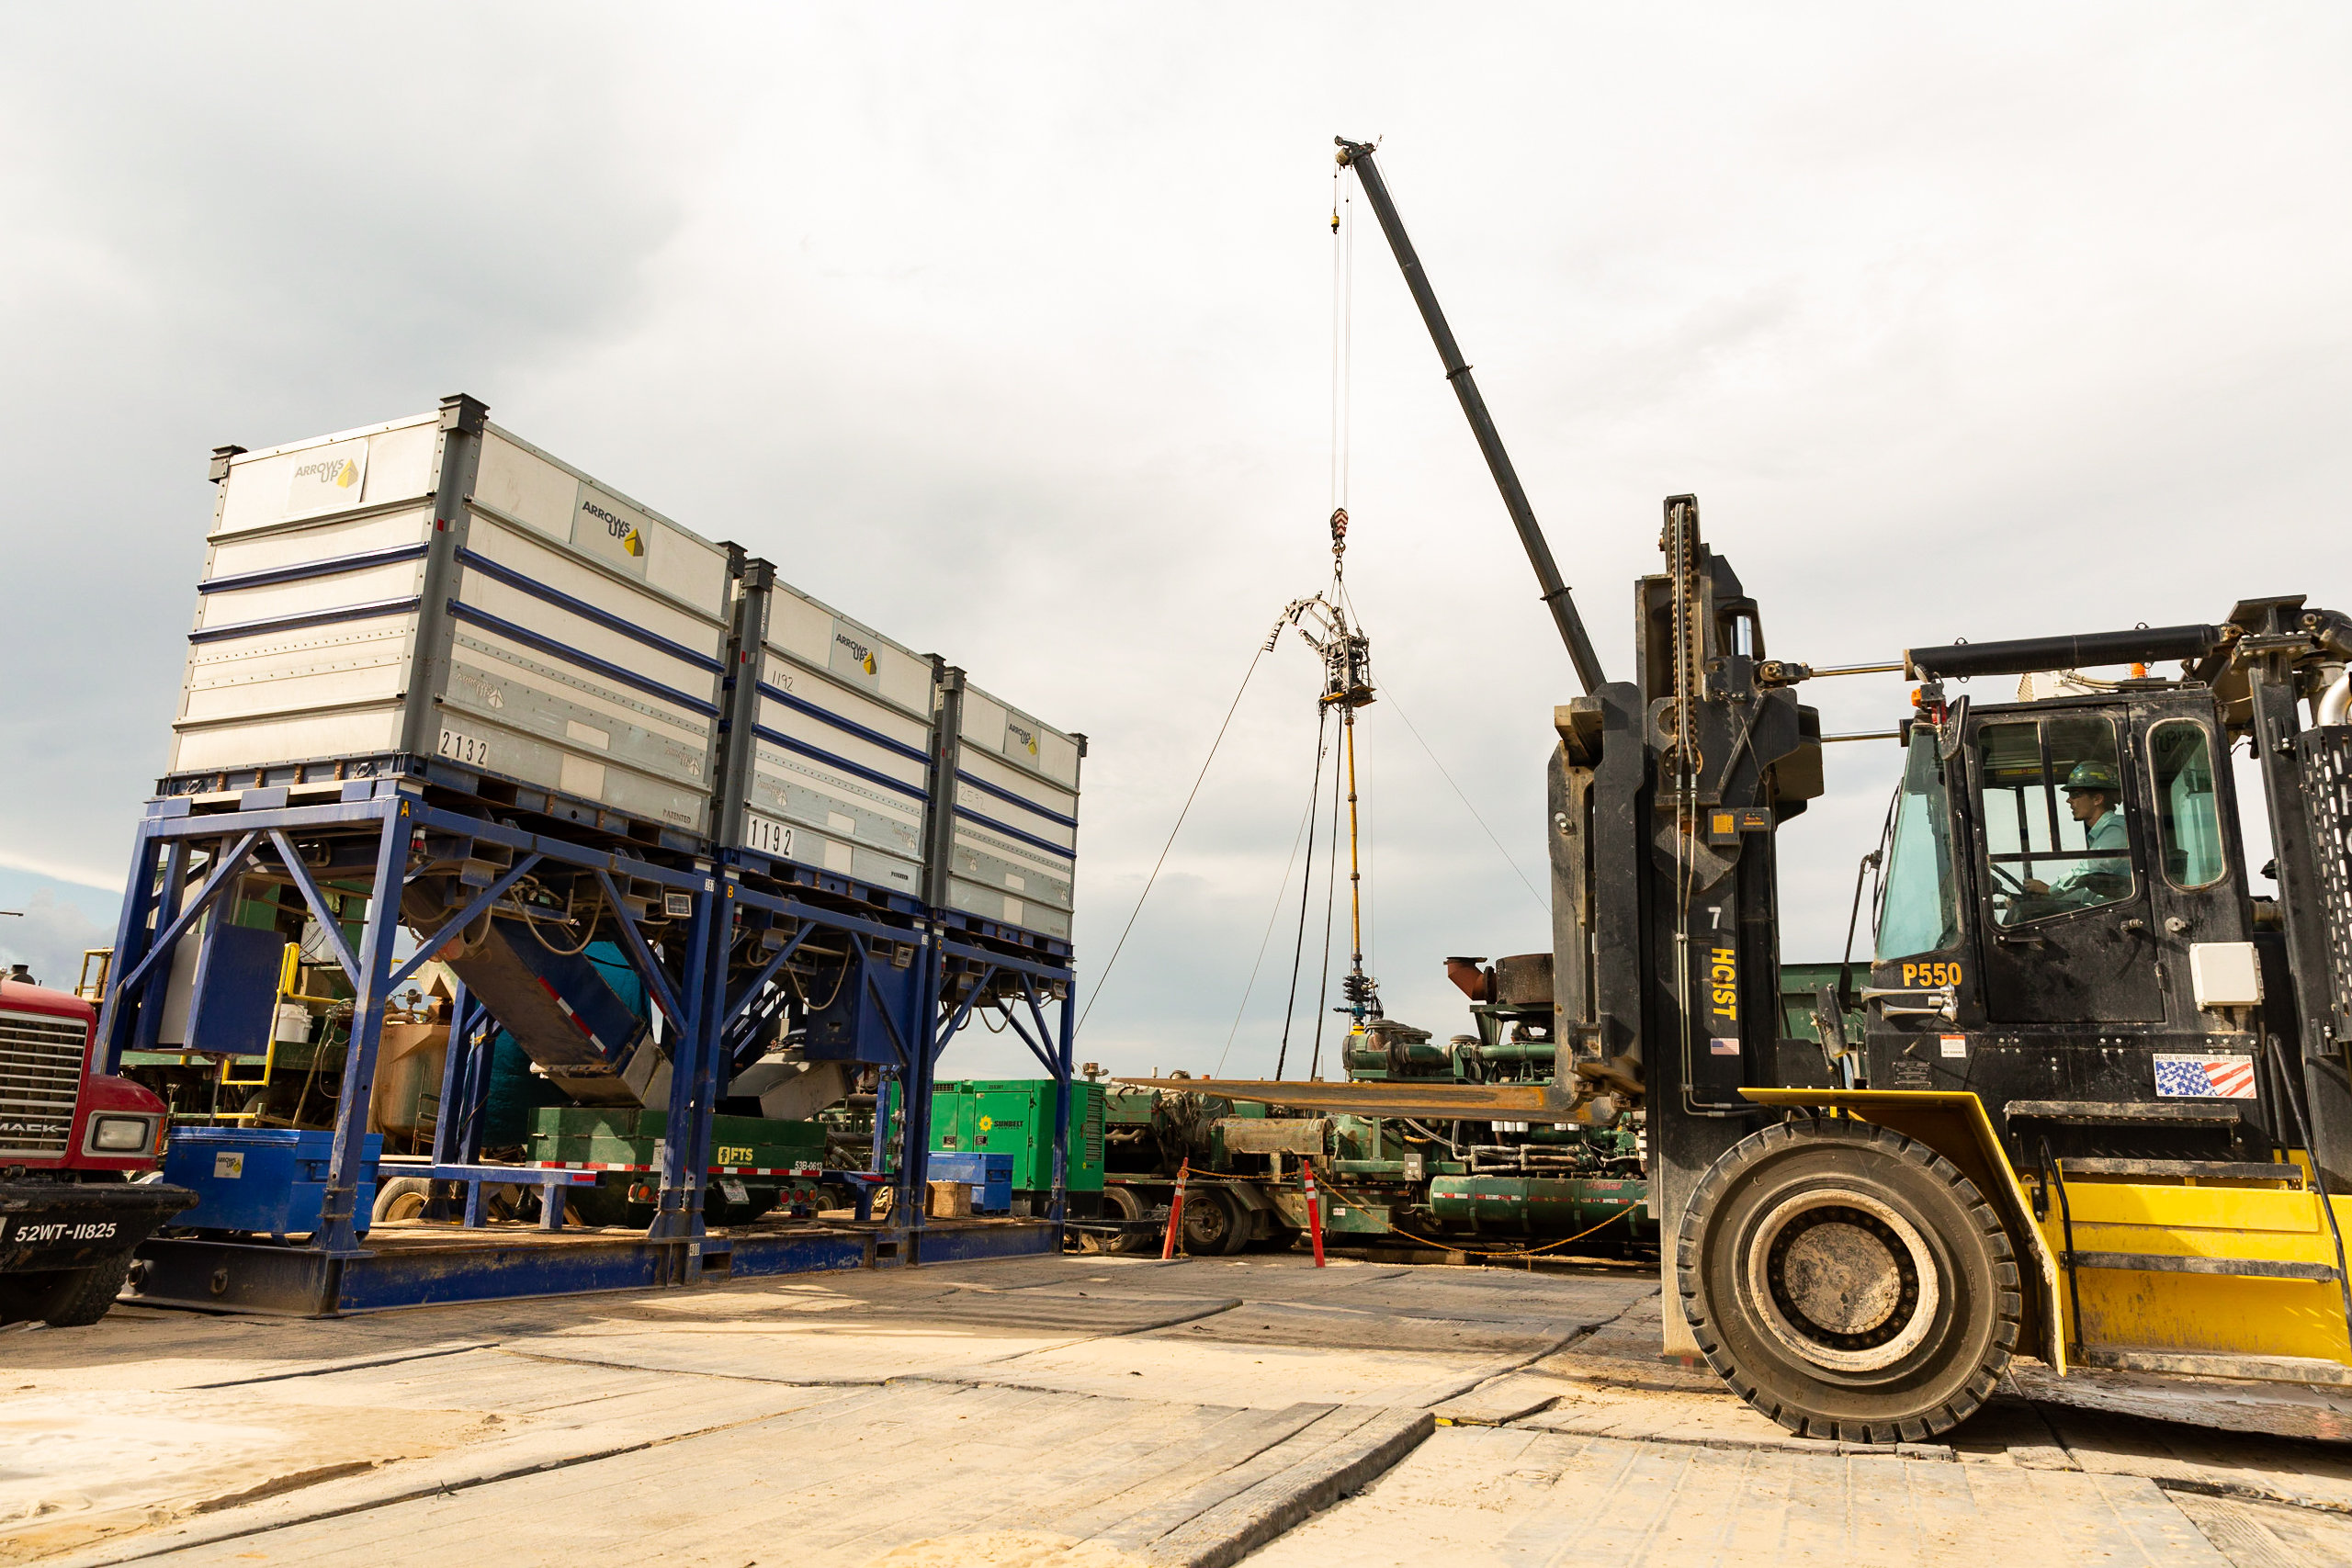
OmniTRAX Inc. is one of the largest privately held transportation service companies in North America and an affiliate of The Broe Group. OmniTRAX Energy Solutions provides proppant supply chain solutions, including terminals in several basins, transload operations and its containerized proppant delivery and storage solution Arrows UP. This containerized system provides many capabilities, including the lowest industry tare weight per bin at the same or greater capacity as the competition and a gravity fed riser system that delivers proppant directly into the hopper, he noted.
“We offer faster offloading in the last-mile space with 5- to 8-minute averages, the reduction of wellsite traffic congestion for sand deliveries and higher truck/driver and asset utility,” he said. “In addition to our highly efficient rail-served terminals, we are continuing to develop mid-mile storage solutions that provide value even closer to the wellhead, demurrage minimization and guarantee inventory both on the pad and in the yard. This alternative model cuts dwell time at the wellhead for trucks and staged material into single digit cost per ton staged.”
There are a lot of moving pieces, and digital technologies have become key in managing them all to ensure the overall process moves as it should.
“The use of silos and boxes provides a more efficient process of moving sand from the mine to the well site. It helps minimize the costs associated with demurrage for trucks waiting around to unload,” said Jacob Lundberg, senior analyst for equity research at Credit Suisse. “The digital component to managing today’s last-mile logistics is on the software side. Solaris Oilfield Infrastructure, for example, has an integrated software solution that provides operators with a real-time look at the sand supply chain.”
Producers can preemptively take action to ensure there are no supply disruptions in the flow of sand from the mine to the blender, he said.
“The ultimate goal is to minimize any kind of downtime caused by a shortage of sand,” Lundberg said.
“Total Sand Solutions (TSS) is a sand distributor and we look at companies like Walmart, Amazon and Netflix as inspiration in terms of what we do,” said Anish Jain, CEO for TSS. “Ultimately, we buy sand from a large network of mines, and with our large fleet of trucks and warehouses, we move the sand through the supply. We’re not just brokering sand; we are actually moving it.”
The distributor in 2018 purchased sand from more than 20 mining companies that it then sold to a large network of consumers, including operators and service companies, he added.
“TSS is a distribution company that has a massive logistics organization, does not own any mines, but essentially operates as a synthetic mine because we have a contract portfolio and a purchasing group that allows us to buy from every constituent in the marketplace,” he said.
TSS uses its SandDrive web-based platform to monitor and track all of the assets in the supply chain.
It provides a traceable system of record, real-time network visibility and enterprise resource planning integration. Using artificial intelligence, the system creates communication channels for instant coordination within the system of dispatchers, drivers and coordinators.
“With our SandDrive platform, we have a digital tool that first lets us see where everything is in our ecosystem. It answers the question of where are all of the assets, both facilities and trucks, as well as my inventory levels. It keeps a digital record of everything,” Jain said. “It also provides intelligence, enabling us to make smarter and better decisions. From awareness and intelligence we get to the third step, automation.
“Digital will continue to be a major part of the transformation of sand logistics processes. It takes what has been more of a brute force method with pen, paper and clipboards and turns it into a digital process that is more efficient,” he said. “From where we sit, we think about the efficiency that comes with standardization in a supply chain and how it all comes together to the benefit of a full ecosystem. We are evolving from a customized process of experimentation to a standardized manufacturing production process.”