
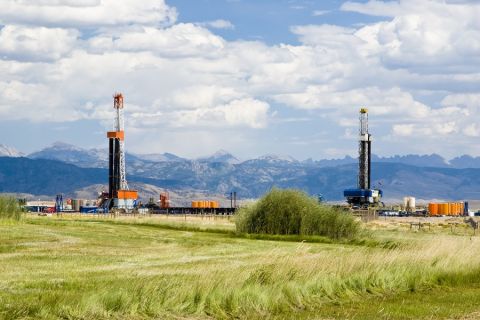
While technological improvements have combined to lower costs, they “have not significantly increased the ultimate recoverable resource,” J. David Hughes wrote in a report for the Post-Carbon Institute. (Source: Hart Energy/Shutterstock.com)
With U.S. oil and gas production at record highs thanks to the development of shale, their potential plays a dominant role in any discussion of where energy will come from in the future.
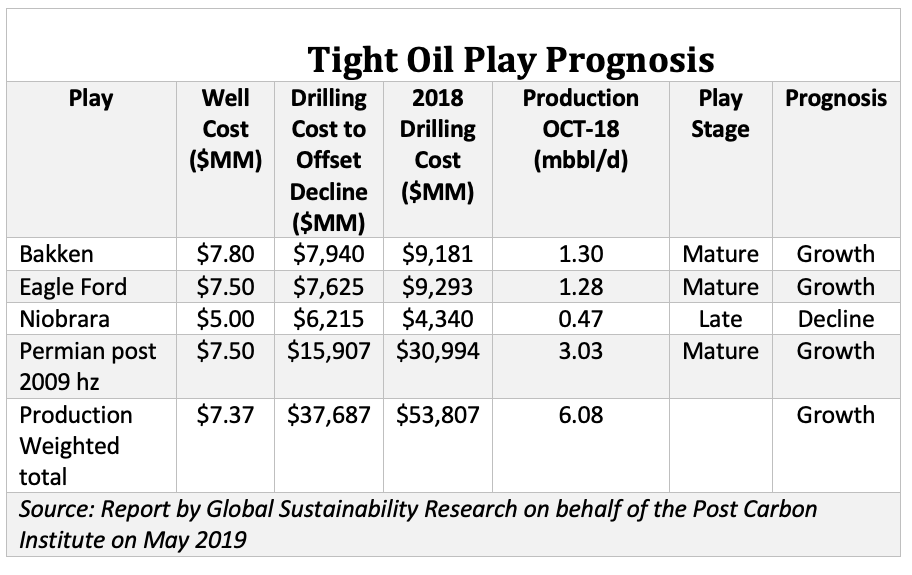
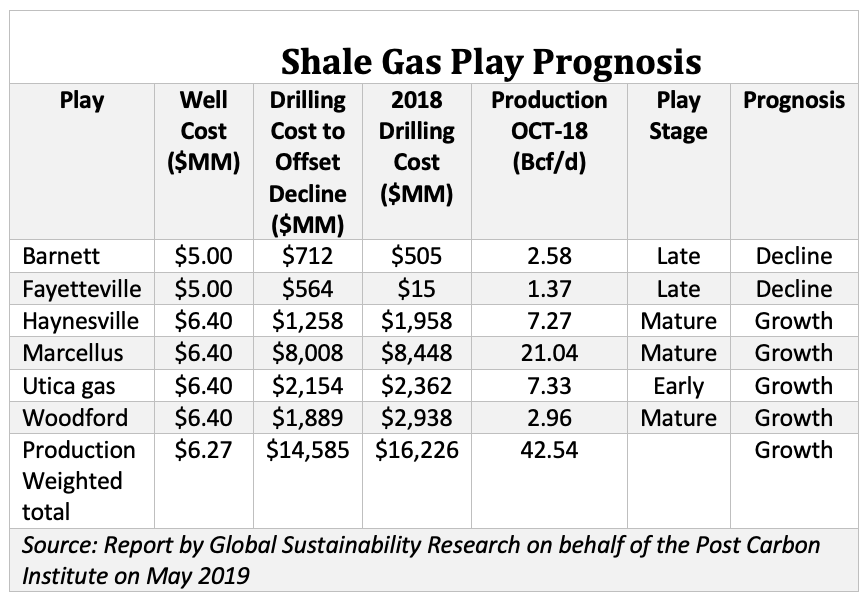
Wildly successful shale drilling upended expectations of the past that peak oil was imminent. Yet, the high decline rates of shale plays has left many wondering how long technological improvements will overcome geological limitations, wrote J. David Hughes, president of consultancy Global Sustainability Research, in a recent report on behalf of the Post Carbon Institute.
In the report assessing the 10 major tight oil and shale gas plays in the U.S., Hughes noted that while technological improvements have combined to lower costs and allow oil and gas to be extracted with fewer wells, they “have not significantly increased the ultimate recoverable resource.”
The research found that since 2012, lateral lengths have risen by 44% on average to 7,404 ft. The shortest average lateral length was 5,548 ft in the Barnett Shale. The highest was 9,864 feet in the Bakken.
Water volumes injected per well has also increased 25% on average across the 10 plays studied, with a more than six-fold rise in the Permian Basin for total water volume per well. “Injection per horizontal lateral foot has risen by 145% on average since 2012 to 1,645 gallons of water and 1,645 pounds of proppant,” Hughes said noting that individual wells have blown through these numbers at times.
“The increase in horizontal lateral length and water and proppant injection volumes mean that a 2018 well can access 2.6 times as much reservoir rock, on average, as a 2012 well,” according to the report. In particular, wells in the Permian Basin can access more than four times the rock.
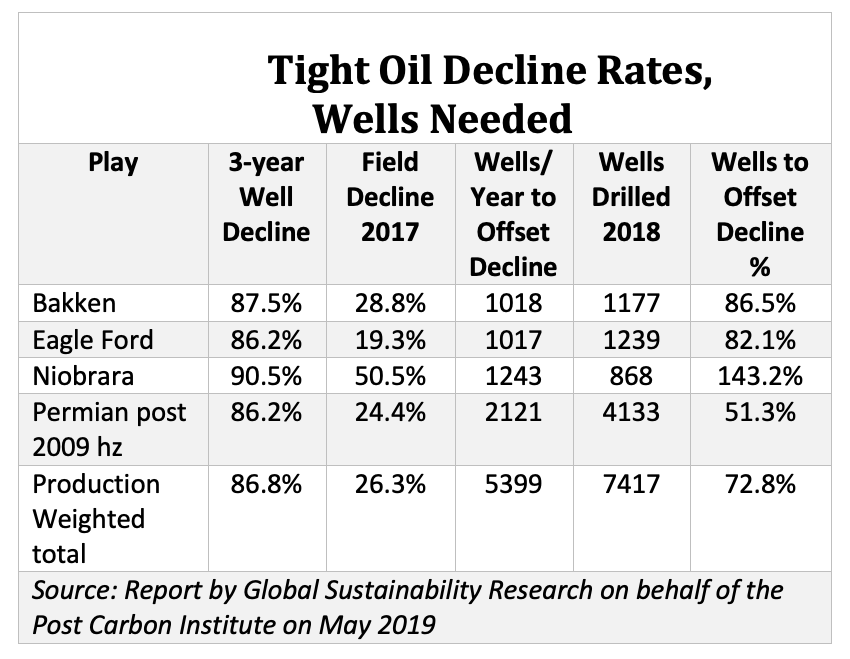
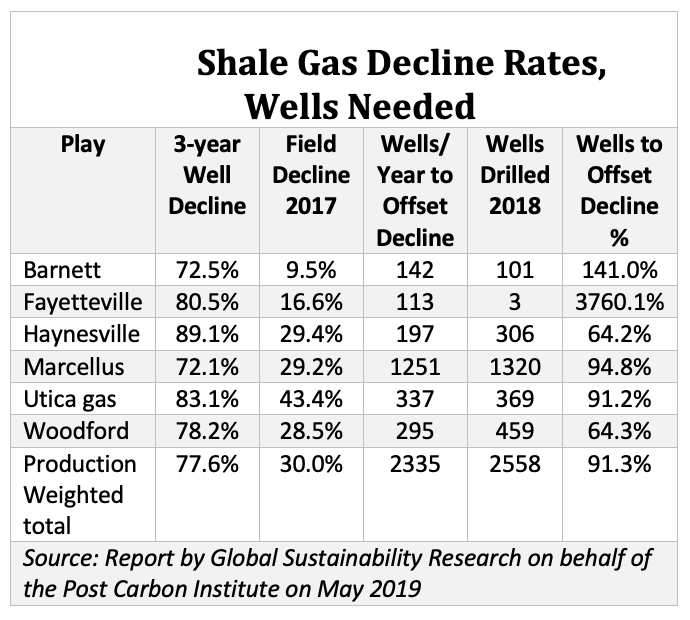
These resources’ thirst for drilling and capital to maintain production is significant. The report found that the production-weighted three-year decline rates was 87% for tight oil and 78% for shale gas wells. With new drilling, 26% annually for tight oil and 30% per year for shale gas, for instance.
Hughes estimated that to keep production flat at late-2018 production rates, 5,399 new wells per year are required for tight oil and 2,335 wells for shale gas, amounting to expenditures of $52.3 billion per year to offset field declines, with nearly three-quarters of that amount for tight oil (drilling costs only).
For 2018, drilling costs were estimated to reach $70 billion for 9,975 wells—77% of that for tight oil and 23% for shale gas. Of the $54 billion spent on tight oil in 2018, 70% was directed to offset field declines and 30% to boost production. For shale gas, 90% was earmarked to offset declines.
Hughes’ conclusion is that eventually, in all plays, despite better technology’s efforts, production will fall as costs rise.
“Assuming shale production can grow forever based on ever-improving technology is a mistake—geology will ultimately dictate the costs and quantity of resources that can be recovered,” he said. “Future energy policy must be based on this reality.”
Hughes is an earth scientist who has studied the energy resources of Canada for four decades, including 32 years with the Geological Survey of Canada as a scientist and research manager, according to the Post Carbon Institute website. He currently leads Global Sustainability Research, a consultancy dedicated to research on energy and sustainability issues, plus is a board member of Physicians, Scientists & Engineers for Healthy Energy and is a fellow of Post Carbon Institute.
His report, published in May, focused on the 10 major tight oil and shale gas plays in the U.S. in terms of their production, injection volumes per foot of horizontal lateral, lateral lengths, production trends, drilling rates and remaining locations, as well as other metrics. It also looked at geological variability and environmental impacts. Drillinginfo was the main source for production data for oil, gas and water by play, and Fracfocus was the source for injected volumes of water and proppant. The data is current to late-2018, according to the report.

Recommended Reading
E&P Earnings Season Proves Up Stronger Efficiencies, Profits
2024-04-04 - The 2024 outlook for E&Ps largely surprises to the upside with conservative budgets and steady volumes.

Petrie Partners: A Small Wonder
2024-02-01 - Petrie Partners may not be the biggest or flashiest investment bank on the block, but after over two decades, its executives have been around the block more than most.
CEO: Coterra ‘Deeply Curious’ on M&A Amid E&P Consolidation Wave
2024-02-26 - Coterra Energy has yet to get in on the large-scale M&A wave sweeping across the Lower 48—but CEO Tom Jorden said Coterra is keeping an eye on acquisition opportunities.

Endeavor Integration Brings Capital Efficiency, Durability to Diamondback
2024-02-22 - The combined Diamondback-Endeavor deal is expected to realize $3 billion in synergies and have 12 years of sub-$40/bbl breakeven inventory.
Exxon, Chevron Tapping Permian for Output Growth in ‘24
2024-02-02 - Exxon Mobil and Chevron plan to tap West Texas and New Mexico for oil and gas production growth in 2024, the U.S. majors reported in their latest earnings.