The production decline for shale wells is steep, with 60% to 70 % of the IP lost in the first year. A large part of this steep decline is caused because a significant portion of the hydraulically created fracture area is unsupported by proppant. For the proppant to enter a fracture, the fracture width must be three times the mean particle size of the proppant.
Using this metric as a guide, the hydraulic fracture width needs to be wider than 1.5 mm to accept 40/70 mesh sand and .5 mm to accept 100 mesh sand. A field-proven proppant for very small fractures is Deeprop 1000, which is an order of magnitude smaller than conventional proppants. This microproppant opens the potential for tapping into the production fluids trapped within the vast secondary fracture network of many shale wells.
Specifications
Deeprop 1000 is a small, very strong microproppant with a D50 of 25 μ and a D95 of 115 μ. It has a density of 2.4 gm/cc, a compressive strength of 60,000 psi and is temperature stable up to 2,200 F. Manufactured as a dry solid, the microproppant has been pumped in hundreds of wells in the U.S. across many basins, exclusively in a slurry form. The slurry composition is an aqueous solution of a viscosifying agent, and the microproppant is added through the suction side of the blender.
Case studies
There are four mechanisms that are improving the performance of the wells: improved effective propped area, scouring of the near wellbore area resulting in reduced treating pressure, far-field diversion and a reduction of convergent flow effects.
Figure 1 shows a treating plot from one stage in a 44-stage, six-cluster fracture that was performed in the Delaware Basin of West Texas. The red line is the surface treating pressure, and the green line is the pump rate. Because the treating string is loaded with the same proppant concentration and the pump rate is constant, the surface treating pressure is a fair representation of the downhole pressure behavior. The point that the Deeprop 1000 arrives at the perforations and the point where it is fully displaced is noted on the plot.
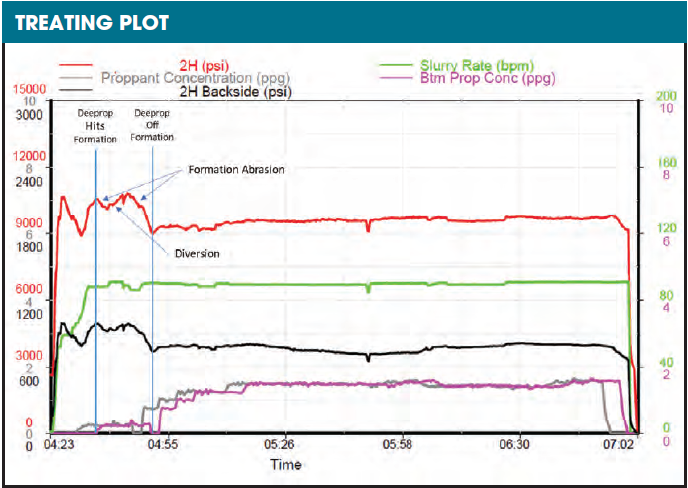
Note when it hits the formation, there is a drop in the treating pressure followed by an increase then a sharp drop. The initial drop in pressure is due to near wellbore rock abrasion. The increase in pressure is due to bridging and diversion into one or several of the clusters or secondary fractures, and then the sharp drop is due to additional rock abrasion in the new clusters or fractures that were opened by the increase in pressure. Because of the low microproppant concentration and the Bernoulli Effect, which concentrates it in the center of the flow stream, it is not believed that the pressure drop is due to perforation erosion. The pressure drop spike noted in the middle of the MP stage looks to be a change in pump rate rather than a reservoir response. Only one of the 44 stages is represented in Figure 1, but most of the stages showed this behavior. This
behavior has been noted in all the reservoirs treated except the Utica.
To date, Deeprop 1000 has been pumped in the Barnett, Woodford/SCOOP, Utica, Marcellus and Wolfcamp A and B (both the Delaware and Midland basins) shales. Production data have been published for all these reservoirs.
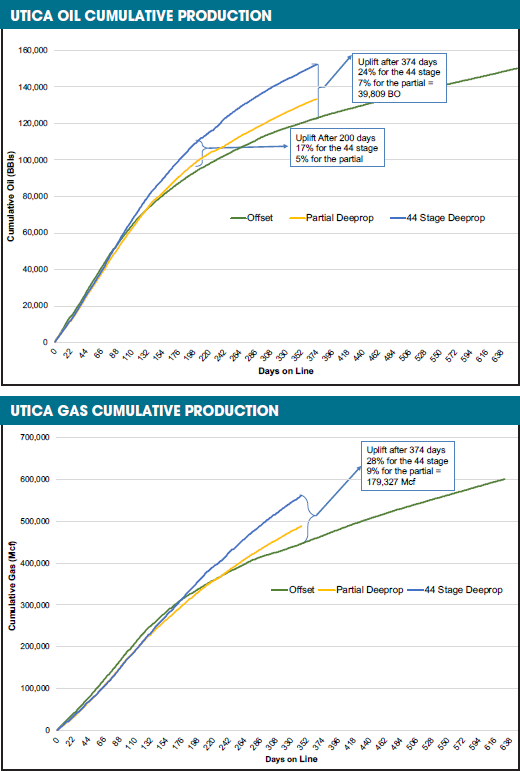
Figure 2 shows a Utica case study that consisted of two Deeprop 1000 wells and 1 offset. The wells are in eastern Ohio where the Utica is located at about 7,500 ft true vertical depth. The offset well had a lateral length of 7,845 ft and was fractured using 45 stages spaced 180 ft apart. Each stage had five clusters spaced 36 ft apart. The first Deeprop 1000 well had a lateral length of 5,742 ft and was designed to have 45 stages spaced 150 ft apart. Each stage had five clusters spaced 30 ft apart. This well had several pressure issues so only 39 of the planned 44 stages were fractured. The second MP well had a lateral length of 7,341 ft and was fractured using 48 stages spaced 150 ft apart. Each stage had five clusters spaced 30 ft apart. Stage 7 was skipped so that only 47 of the planned 48 stages was fractured. The offset well had some downtime, so the data are formatted to eliminate this downtime effect. After a year under production, the oil uplift was 39,809 bbl and the gas uplift was 197.3 MMcf.
A number of research and field studies have demonstrated the microproppant’s ability to enhance the permeability of microfractures and vastly improve production in field applications in ongoing field operations in major shale plays across the U.S., including the Barnett, Woodford/SCOOP, Utica and Permian Basin. Average uplift after 25 months is 40%, and test wells over 36 months have uplift ranging from 10% to as high as 81%. Operators are recovering their return on investment in four months or less.
References available. Contact Jennifer Presley at jpresley@hartenergy.com for more information.
Recommended Reading
Paisie: Crude Prices Rising Faster Than Expected
2024-04-19 - Supply cuts by OPEC+, tensions in Ukraine and Gaza drive the increases.

Report: Freeport LNG Hits Sixth Day of Dwindling Gas Consumption
2024-04-17 - With Freeport LNG operating at a fraction of its full capacity, natural gas futures have fallen following a short rally the week before.
Permian NatGas Hits 15-month Low as Negative Prices Linger
2024-04-16 - Prices at the Waha Hub in West Texas closed at negative $2.99/MMBtu on April 15, its lowest since December 2022.
BP Starts Oil Production at New Offshore Platform in Azerbaijan
2024-04-16 - Azeri Central East offshore platform is the seventh oil platform installed in the Azeri-Chirag-Gunashli field in the Caspian Sea.
US Could Release More SPR Oil to Keep Gas Prices Low, Senior White House Adviser Says
2024-04-16 - White House senior adviser John Podesta stopped short of saying there would be a release from the Strategic Petroleum Reserve any time soon at an industry conference on April 16.