Learn more about Hart Energy Conferences
Get our latest conference schedules, updates and insights straight to your inbox.
Because asset quality, or “the rock,” is one of the most important factors, if not the most important factor, for E&P companies and E&P investing, Robert W. Baird & Co. wanted to develop a systemic approach to determine, on an ongoing basis, the relative asset quality and productivity of E&P companies’ drilling programs.
The application of big data analytics draws from a database that includes eight years of production and more than 100,000 wells. The system, “Baird Energy Big Data Analytics,” includes three types of analyses: ranking, trend and acreage.
Since upstream operators must submit, on a monthly basis, their production data to the states in which they operate (mainly for severance tax purposes), and the states make this available to the public, E&P investors and analysts have access to a great deal of operator production information. The data quality, frequency and methodology vary state by state, but the details generally are useful and representative of operator drilling programs. These state data are the source for the analytics, and Baird uses IHS Markit as well, which aggregates the different state data into one database and screens and fixes the data for quality problems.

Of course, E&P companies provide well data in their disclosures, including press releases and corporate presentations, but these data are few and selective. Company-disclosed well results usually accentuate the positive, often not representing the variability of well results or characterizing average well results.
Further, E&P disclosures often emphasize early-time results. Historically, companies disclosed 24-hour IP rates but, more recently, 30-day rates are more typical. These initial results can be representative of a well’s ultimate performance; however, too often they are not.
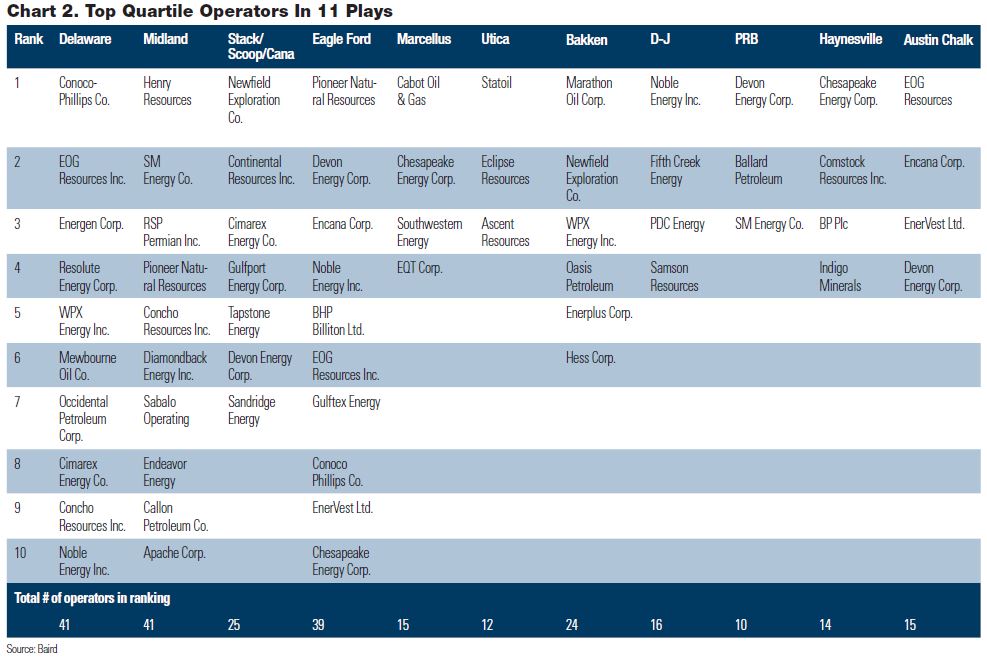
Baird analyzed company drilling programs and individual well results. This ranking is based on first three full months of average gross revenues (Nov. 2016 to Oct. 2017)
Baird’s analysis of production history indicates what one would expect: 30 days is better than 24 hours, three months is better than 30 days, and six months and 12 months are better than three months. Though longer production history is more representative of a well’s ultimate performance, too much production history lacks timeliness. Investors want to know about operator well productivity as soon as possible, and they want to be able to identify any substantive changes in as real-time as practicable.
In Baird’s analysis, it looks at a range of months of production history, including the first full month, the first three full months, the first six full months and the first 12 full months. Emphasis is on the first three full months, since this production history tends to be representative of a well’s ultimate performance, is relatively timely and allows for operator deployment of the latest technology and techniques included in the well results.
Baird wants to analyze company drilling programs and not just select individual well results, so the study period for new wells is one year. In other words, these studies include the latest year’s worth of wells for which Baird has at least three full months of production for each well, and, for comparison purposes, it includes only the first three months of production data for each well.
Baird’s Energy Big Data Analytics analyzed 11 key basins and plays: Delaware Basin, Midland Basin, Bakken, Eagle Ford, Stack/Scoop/Cana, Denver-Julesburg (D-J) Basin, Marcellus, Utica, Haynesville, Powder River Basin and Austin Chalk. It views these plays as the most active and the most interesting to investors.
Since Baird is interested in aggregate or program data for each operator and not just select individual well datapoints, it focuses on average productivity per well. However, to include the impact of commodity mix in an operator’s wells, it calculates a gross revenue per well value, using “normalized” oil and gas prices of $50 per barrel and $3 per thousand cubic feet for all wells and all time periods.
Baird thinks it helps to use a financial measure to represent the productivity data. In part, it wanted to respond to what it perceived as a misunderstanding about the role of natural gas in wells. For example, it found an overemphasis on oil cut in Delaware Basin wells, resulting in judgement of wells based on oil production rather than on wells’ overall productivity and revenue generation.
In Delaware Basin, one can see that Cimarex Energy Co.’s average well has 55% oil, a lower percentage than the median operator’s 71%. However, on an absolute basis, Cimarex’s average well produces 19% more oil and 119% more gas than its peers’ wells. Cimarex sells this gas and that greater gas production, even at a discounted price, adds a meaningful economic boost to its wells, evidenced by its relatively high ranking based on gross revenues per well.
Operator ranking
Of the three types of analysis that comprise the Baird Energy Big Data Analytics, it considers its “go to” analysis the Operator Ranking Analytics (ORA). In one glance, the ORA shows which operators have the most productive drilling programs and which ones do not. This report provides ranking tables for public and private operators in the 11 key basins and plays, with each play having a minimum well cutoff. In other words, during the latest 12-month study period, it includes any operator that has started production on at least five wells. In the less-active Utica and D-J Basin, the threshold is four wells. In the Powder River Basin and Haynesville, the threshold is three wells; in the Austin Chalk, two wells.
Baird’s most recent ORA includes any wells that started production between November 2016 and October 2017. The data only include the first three full months of production, excluding any initial partial months. For the Delaware in this study period, the most productive operator is ConocoPhillips Co., but it brought online only five wells during the study period.
The most productive operator with a significant number of wells (176) is EOG Resources Inc. In the first three full months, EOG’s average well produced 106,052 barrels of oil equivalent (boe), including 76,355 bbl of oil (72%) and 178,184 Mcf of gas. Since state data only include wellhead production, the data include only oil and gas volumes and no NGL.
Rock, technology, technique
Using $50 oil and $3 gas, Baird calculates an average gross revenue per well value for each operator and ranks the companies based on this. It also shows the rankings on a gross revenue per lateral-foot basis, which, if all else were equal, would highlight which companies have the best rock.
However, even though rock quality is the key factor for productivity, it is not the only factor. Technology and technique are important as well. The goal is not to determine which companies have the most productive rock on a per-cubic-inch basis; instead, it is to see which operators have the most productive wells, on average.
This is more about what it calls RTT (rock, technology and technique). Some have suggested that Baird add a “T” for “transportation,” and that argument holds merit. The analysis focuses on wellhead productivity, however, and leaves the infrastructure and takeaway factors and related price differentials and economics for separate analyses.
In the Delaware, operators were ranked by the highest average gross revenues per well. ConocoPhillips was first with a cumulative $5.4 million for the first three full months, 17% above second-place EOG. However, since EOG has 176 wells in the dataset versus ConocoPhillips with five, Baird considers EOG the most productive operator in the Delaware.
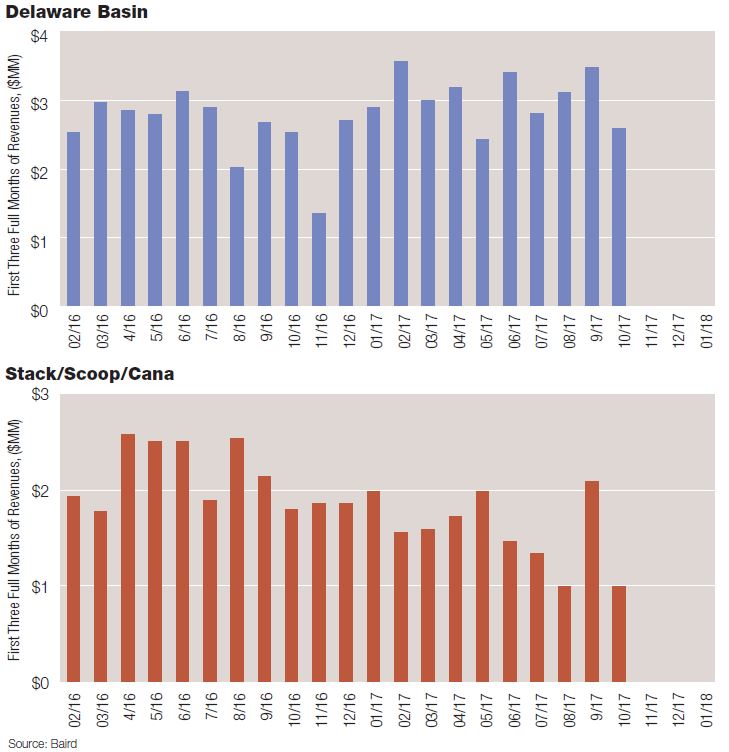
Average Delaware Basin revenues per well improved over the time period but recently, Oklahoma revenues fared worse.
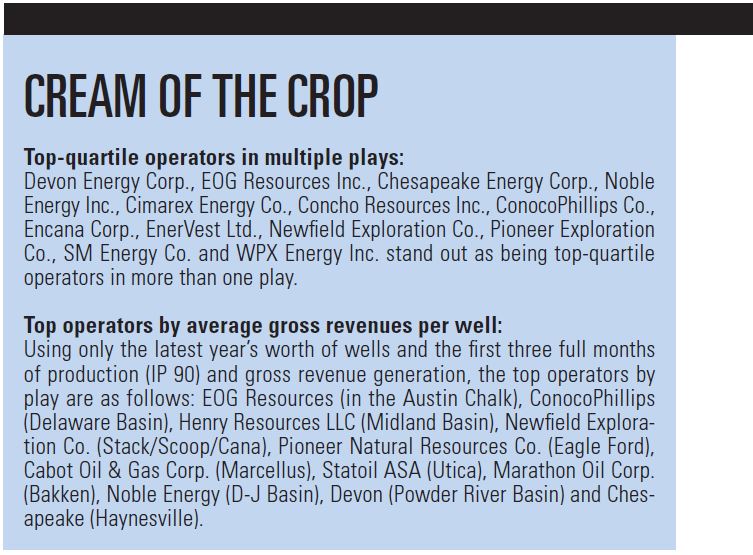
Multiple basin stars
Baird’s ranking analytics also include a summary of the top-quartile operators in each of the 11 plays in the study. It also highlights operators that are top quartile in more than one play. Devon Energy Corp., for example, is a top-quartile operator in four plays; Chesapeake Energy Corp., EOG and Noble Energy Inc. are each top-quartile operators in three plays.
Month-to-month variability often makes it difficult to identify the operator trend, so Baird created the Operator Trend Index (OTI). The OTI applies the Theil-Sen estimator, a statistical method that quantifies trends by calculating the median of a set of linear slopes. It does not indicate which play is better or worse but signals changes, both in consistency and magnitude.
A higher OTI value indicates a more consistently growing play and higher productivity growth. An index value of 100 indicates a $100,000 monthly increase in per-well revenue generation from an increase in a company’s average well productivity. Based on a 24-month study, the increase in revenue generation per average well, then, would be $2.4 million.
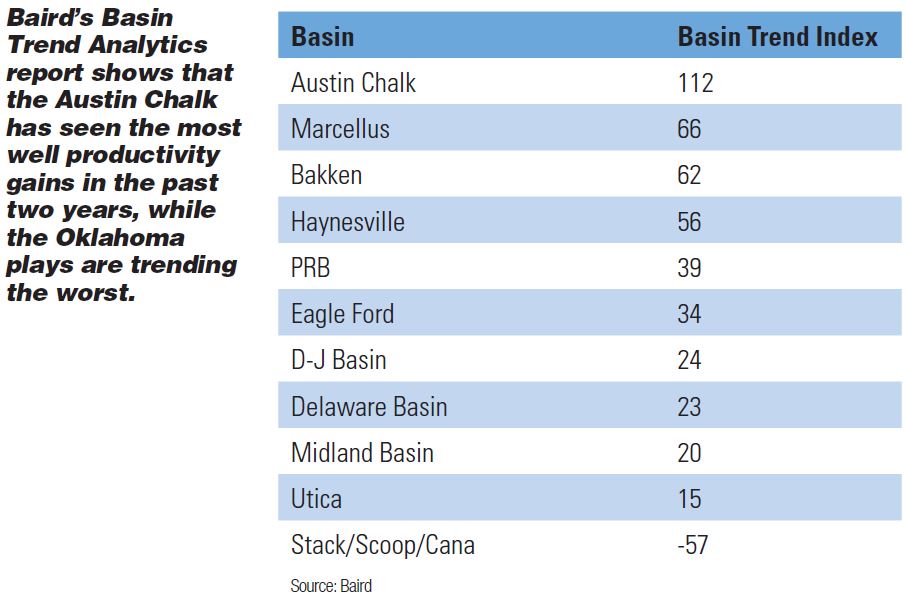
Within the ORA for each play, Baird also aggregated all operator production data to create its Basin Trend Analytics (BTA) reports. The BTA shows an entire play trend and enables comparison of the trends across plays. BTA results can help investors think about productivity trends’ implications on commodity prices. Though all but one of the studied plays have positive productivity trends during the past two years, more recent data include a leveling off of average productivity per well.
During the past two years, the Austin Chalk, Marcellus, Bakken and Haynesville have seen the most consistent and biggest productivity gains.
In the Stack/Scoop/Cana, beginning in mid- to late 2016, productivity per average well seems to have fallen 50%. The Stack/Scoop/Cana trend data may appear worse than it really is, however, due at least partly to problems with Oklahoma state agency data, including delayed, permanently incomplete, inaccurate and missing data. However, operators active in the play have indicated at least some productivity degradation from well performance variability, communication between parent and child wells, overly aggressive spacing and sub-optimal completions.
Combining the Operator Trend Analytics with the ORA might help investors see which E&P companies are among the most productive and showing positive trends.
Baird Energy Big Data Analytics
Great rock generally leads to positive metrics that correlate with an operator’s success—and its stock price performance. These metrics include production growth, cash-flow growth, operating costs, operating margins, capital efficiency, rates of return, free cash-flow generation, net present value per well and net-asset-value growth.
Some states, such as West Virginia, have lagged data and other states, such as Oklahoma, may have data timing, completeness and accuracy issues. Texas and Louisiana require algorithms to allocate lease production to the well level. Since Baird uses wellhead production data, its analysis ignores the economic uplift that operators might get from producing NGL. This analysis also does not include cost data and other economic analyses. Thus, the Baird Energy Big Data Analytics is not perfect, but the firm considers it a very effective Step 1 in researching E&P companies.
Recommended Reading
Uinta Basin: 50% More Oil for Twice the Proppant
2024-03-06 - The higher-intensity completions are costing an average of 35% fewer dollars spent per barrel of oil equivalent of output, Crescent Energy told investors and analysts on March 5.
Exxon, Chevron Tapping Permian for Output Growth in ‘24
2024-02-02 - Exxon Mobil and Chevron plan to tap West Texas and New Mexico for oil and gas production growth in 2024, the U.S. majors reported in their latest earnings.

The One Where EOG’s Stock Tanked
2024-02-23 - A rare earnings miss pushed the wildcatter’s stock down as much as 6%, while larger and smaller peers’ share prices were mostly unchanged. One analyst asked if EOG is like Narcissus.
Hess Corp. Boosts Bakken Output, Drilling Ahead of Chevron Merger
2024-01-31 - Hess Corp. increased its drilling activity and output from the Bakken play of North Dakota during the fourth quarter, the E&P reported in its latest earnings.

Endeavor Integration Brings Capital Efficiency, Durability to Diamondback
2024-02-22 - The combined Diamondback-Endeavor deal is expected to realize $3 billion in synergies and have 12 years of sub-$40/bbl breakeven inventory.