A major source of uncertainty in modeling the growth of hydraulic fractures is the simplistic assumptions of homogenous stress fields, rock properties and hydrostatic pore pressure at reservoir depth. Despite ample evidence of asymmetric hydraulic fractures provided by interpreted microseismic and chemical tracers, most of the current fracture simulators rely on these simplifications, which in turn adversely affects the reservoir simulation models.
As a result, the reservoir simulation often is unable to get a realistic and validated representation of the stimulated permeability from the frack design software. Available fracture and reservoir simulators in the industry lack quantitative tools to address the asymmetric reality and the need for a variable treatment along a wellbore.
After many years of applying “copy and paste” completion designs, completion engineers can finally have the software tools that recognize that the earth is not homogeneous and the treatment of each stage must be adapted to the heterogeneous and dynamic in situ geologic and geomechanical conditions.
To further convolute the issue, current frack design and treatment practices are creating confusion in many E&P companies. This confusion stems from the lack of available practical modeling tools that:
• identify the geologic and geomechanical drivers of performance variability in the subsurface;
• quantitatively identify the treatment parameters that could be economically used to overcome any geologic or geomechanical anomaly around the wellbore; and
• estimate the impact of these variable treatments with fast modeling tools and then compare the predicted behavior to the actual stimulation response and the final production profile.
The workflow presented here addresses these shortcomings by integrating a coupled geophysical, geological and geomechanical (3G) workflow with a constrained asymmetric frack design model.
Wolfcamp application
The 3G workflow was applied to a Wolfcamp well to address concerns of well interference. Using the field-validated material point method geomechanical fracture simulator and continuous fracture modeling, the interaction of hydraulic fractures and natural fractures (derived from seismic attributes, Figure 1A) is simulated, resulting in the modeled strain induced in the rock. This serves as a proxy for stimulated permeability (Figure 1B). Figure 1B shows the extent of rock deformation resulting from the pressure applied on the fracture initiation points. The stimulated area is detected automatically and outlined in the frack design tool. The asymmetric geomechanical half-lengths are measured on both sides of the wellbore for each fracture stage (Figure 1B) and are exported as constraints for the new asymmetric frack design tool.

By imposing these asymmetric geomechanical half-lengths to the frack design tool, the company is able to account for the stress gradients resulting from variable elastic properties, natural fractures and pressure depletion encountered not only along the wellbore but all around the stimulated wells.
The frack model starts by modeling the pore pressure, overburden and horizontal stresses and their geology-driven variation, which is translated into reservoir strain or stimulated permeability by the fracture geomechanical simulator. All are derived from relevant logs and seismic data and validated by actual field measurements.
The model governs the initiation and propagation of the hydraulic fractures interacting with the geologic heterogeneity by calculating the net pressure at the fracture tip. The effect of lateral stress gradients and the viscous gradient along the fracture length are incorporated in the fundamental pressure balance equation at the fracture tip to determine the growth of the fracture. Mass balance, fluid momentum, pressure-width relations applied with appropriate initial and boundary conditions result in a realistic and fast frack design model. The frack model can be validated using pressure logging tools, chemical tracers and microseismic, if available. This is where complex geomechanical science meets practical implementation and field validation.
The leak-off coefficient, which determines the contribution of the fluid leak-off due to opening of natural fractures, is fine-tuned to account for asymmetry observed in geomechanical modeling.
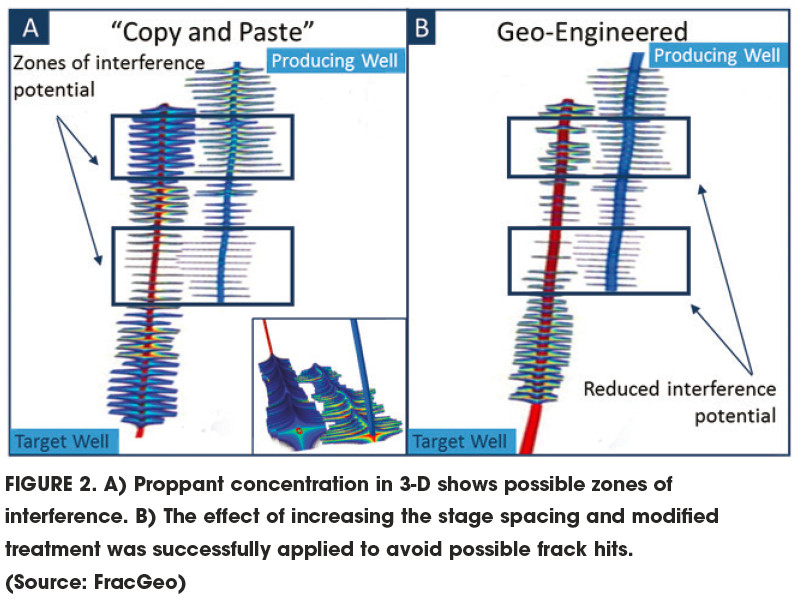
Once the optimum reservoir parameters are computed, other design parameters such as the injection rate, fluid viscosity, and proppant concentration and type can be optimized to achieve a more consistent proppant distribution. With the help of additional constraints the model is able to estimate optimum fracture height, lateral stress gradient, fracture conductivity and proppant concentration as seen in Figure 2A.
Operators can use this workflow to optimize their completions and asset development strategy. A major missing link between frack design and reservoir simulation is addressed with this workflow rooted in geological and geophysical data. It then defines the stimulated reservoir volume (SRV) using the frack design results (conductivity and proppant concentration).
Once the SRV is estimated in 3-D, it can then be used in conjunction with the strain or the frack design results to export to reservoir simulators not only SRV geometry but also the stimulated permeability or any of its proxies such as strain or proppant concentration. This could be used with aided history matching capabilities found in most reservoir simulators. This 3G-driven reservoir simulation workflow enables greater efficiencies in shale management and return on investment optimization through model-driven well spacing and pad development strategies.
In the considered Wolfcamp well, the fracture heights, fracture conductivity and proppant concentrations derived at each frack stage were used to define the SRV in 3-D. The resulting SRV was exported to a 3-D geocellular grid used for classical reservoir simulation.
Different cut-off values for conductivity could be used when exporting the SRV and a preview of the expected depletion achieved since the use of a high cut-off value will help identify the best frack stages.
Well results
In this Wolfcamp example, minimizing interference with a neighboring well was the major challenge addressed. To address the possible zones of interference seen in Figure 2A, the stage spacing was locally increased to 152 m (500 ft), and the treatment was modified in the middle stages of the well. This resulted in reducing the number of stages from 40 to 34, specifically in zones indicating high probability of interference.
The design was altered from pumping a mixture of 320,000 lb of 100 mesh and 40/70 mesh sand to 220,000 lb of 40/70 mesh sand, and the injected fluid viscosity was increased from 10 centipoise (cP) for slick water to 30 cP for linear gel as better carrying capacity was required to pump 40/70 mesh sand alone. The injection rate was reduced from 105 bbl/min to 80 bbl/min. As illustrated in Figure 2B, this integrated approach significantly reduced the possibility of frack hits and well interference.
Recommended Reading

ProPetro Ups Share Repurchases by $100MM
2024-04-25 - ProPetro Holding Corp. is increasing its share repurchase program to a total of $200 million of common shares.

Baker Hughes Hikes Quarterly Dividend
2024-04-25 - Baker Hughes Co. increased its quarterly dividend by 11% year-over-year.

Weatherford M&A Efforts Focused on Integration, Not Scale
2024-04-25 - Services company Weatherford International executives are focused on making deals that, regardless of size or scale, can be integrated into the business, President and CEO Girish Saligram said.

Range Resources Holds Production Steady in 1Q 2024
2024-04-24 - NGLs are providing a boost for Range Resources as the company waits for natural gas demand to rebound.

Hess Midstream Increases Class A Distribution
2024-04-24 - Hess Midstream has increased its quarterly distribution per Class A share by approximately 45% since the first quarter of 2021.