In addition to several other factors, Hendrickson believes that the greater connectedness of our economies and the flow of information will lead to more rapid oil price swings as events in one part of the world are more quickly felt elsewhere. (Source: Hart Energy)
This is an excerpt from the Ralph E. Davis Associates (RED) Weekly E&P Update Newsletter.
If you’re like me, you probably feel that the volatility of oil prices has been very high in the past couple of years. After all, oil prices were well above $100/bbl recently and had a negative price scarcely two years ago. And we’re experiencing significant global events that have an economic impact that influences oil prices, particularly the COVID pandemic and the Russian invasion of Ukraine.
I began to wonder, however, if other forces might be at play that will lead to persistently higher oil price volatility even after the influence of these events passes. Specifically, it occurred to me that the United States’ re-emergence as a major oil producer could introduce more volatility since we don’t coordinate our output with our large producers to “stabilize” the market. And, since our production is heavily dependent on unconventional wells that produce at high initial rates and decline rapidly that they introduce the prospect of more rapid swings in supply that could move prices more quickly.
In his 2015 paper “The New Economics of Oil,” Spencer Dale addressed this second concept. He concluded that unconventional oil should act as a “shock absorber” for oil supply because it could quickly respond to price signals. He noted, however, that much U.S. unconventional oil drilling is conducted by independent producers that tend to be more reliant on external sources of capital, and if this capital wasn’t available, the supply response to high prices might not materialize quickly. We may be seeing that effect now. As noted in our commentary a few weeks ago, the oil-directed rig count hasn’t responded nearly as much as it did during recent similar price spikes.
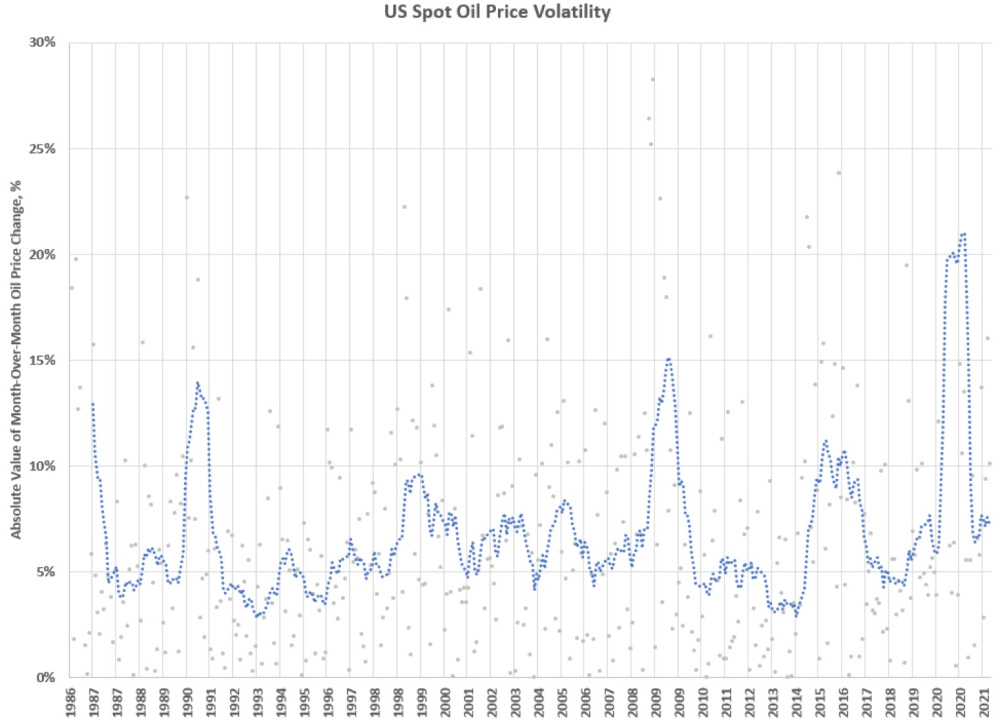
Here’s a graph of oil price volatility over the last few decades. For this analysis, I used the monthly spot oil prices reported by the U.S. Energy Information Administration (EIA) and calculated the absolute value of the month-over-month percentage change. A 12-month moving average is also shown.
There’s a lot of noise in the graph but looking at the moving average may lead to some meaningful observations. First, volatility is volatile; we seem to experience episodes of increased volatility and we’re in one now. Secondly, it appears that the trend of volatility was downward from about 1999 to 2014. Since then, the trend appears to be upward, but it’s hard to pound the table about that. I think the factors I mentioned earlier, plus the greater connectedness of our economies and the flow of information will lead to more rapid price swings as events in one part of the world are more quickly felt elsewhere. And if that opinion holds, it has implications for U.S. producers’ investment and hedging decisions.
About the Author: Steve Hendrickson is the president of Ralph E. Davis Associates, an Opportune LLP company. Hendrickson has over 30 years of professional leadership experience in the energy industry with a proven track record of adding value through acquisitions, development and operations. In addition, he possesses extensive knowledge of petroleum economics, energy finance, reserves reporting and data management, and has deep expertise in reservoir engineering, production engineering and technical evaluations. Hendrickson is a licensed professional engineer in the state of Texas and holds an M.S. in Finance from the University of Houston and a B.S. in Chemical Engineering from The University of Texas at Austin. He recently served as a board member of the Society of Petroleum Evaluation Engineers and is a registered FINRA representative.
Recommended Reading

SunPower Begins Search for New CEO
2024-02-27 - Former CEO Peter Faricy departed SunPower Corp. on Feb. 26, according to the company.

First Solar’s 14 GW of Operational Capacity to Support 30,000 Jobs by 2026
2024-02-26 - First Solar commissioned a study to analyze the economic impact of its vertically integrated solar manufacturing value chain.

enCore Energy Appoints Robert Willette as Chief Legal Officer
2024-02-01 - enCore Energy’s new chief legal officer Robert Willette has over 29 years of corporate legal experience.

Humble Midstream II, Quantum Capital Form Partnership for Infrastructure Projects
2024-01-30 - Humble Midstream II Partners and Quantum Capital Group’s partnership will promote a focus on energy transition infrastructure.

TPG Adds Lebovitz as Head of Infrastructure for Climate Investing Platform
2024-02-07 - TPG Rise Climate was launched in 2021 to make investments across asset classes in climate solutions globally.