
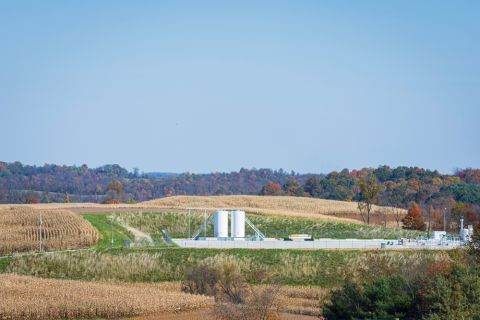
(Source: westtexasfish/Shutterstock.com)
The shifting winds of exploration and development have kept Oklahoma’s Midcontinent producers swaying. Man-made forces like market volatility to the nature-made complexities of the state’s subsurface have led many early entrants into the state’s Scoop/Stack play to exit or reset expectations and restrategize their development approach.
In an exclusive report provided to E&P, Enverus noted that prior to 2016, the Scoop/Stack play was a relatively quiet and isolated unconventional play. Private-equity-backed operators successfully drilled and flipped acreage across the region, with impressive well results bringing more public operators into the play.
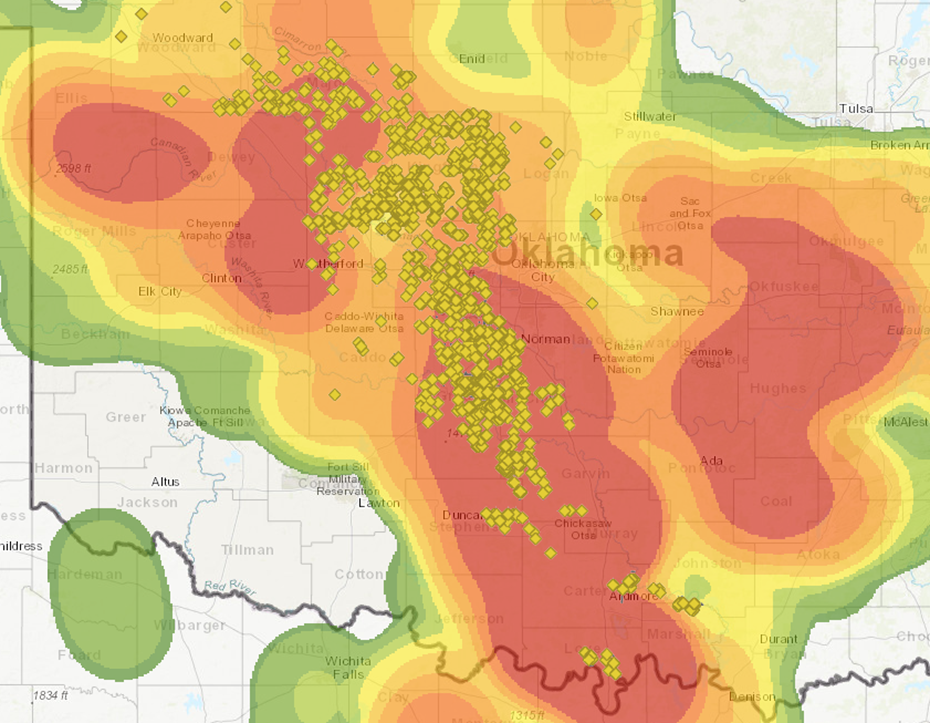
After remaining relatively level throughout 2018, the permit count in the Midcontinent has steadily dropped from 474 in the first quarter of 2019 to 179 in the third quarter. The Stack’s Kingfisher, Canadian and Blaine counties have all seen a significant decrease in the count, with Kingfisher being the most notable. The permit count in the Scoop’s Grady and McClain counties, while still decreasing, has not been as dramatic as that of the Stack counties (Figure 1), according to Enverus.
LEASING HOT SPOTS
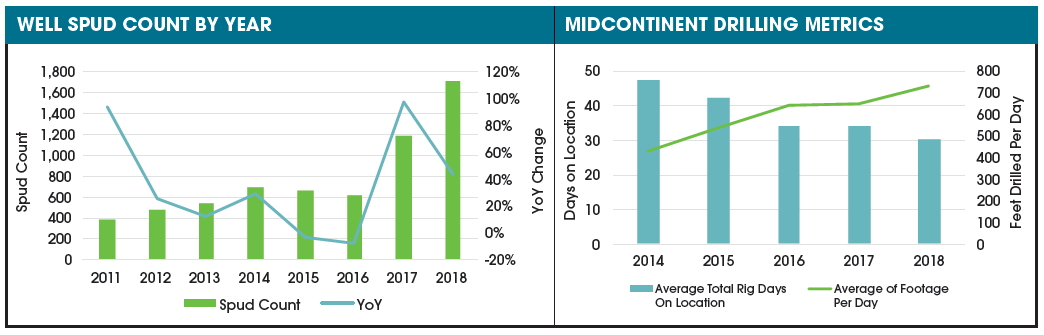
Drilling metrics have improved year over year (YoY) for the past five years, with average total rig days on location dropping to 30 in 2018, while footage drilled per day surpassed 700 ft, as compared to more than 45 days in 2014 drilling a little more than 400 ft/d (Figure 2).
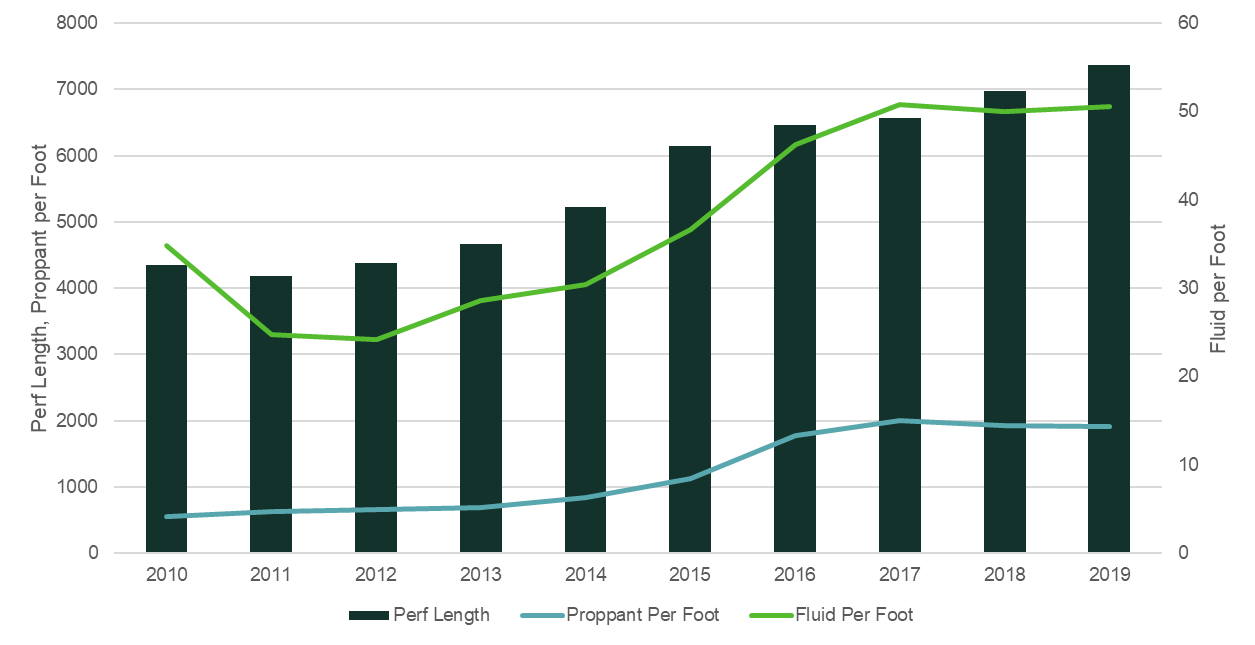
According to the report, completion trends in terms of frac intensity and perforated lengths have been consistent since 2016, while normalized well performance has declined. This decline is due to a variety of factors, including the poor performance from infill wells and mixed results of expanding outside the core of the play (Figure 3). For the Stack, Enverus projects nearly flat production for the next 18 months, while production is expected to grow in the Scoop (Figure 4).
“This disparity in the production forecast is driven by the difference in lower rig counts in the Stack (-25 from the start of 2019 to the end of the second quarter) versus the Scoop (-5 from the start of 2019 to the end of the second quarter),” according to the report.
COMPLETION PRACTICES OVER TIME

Recommended Reading
Analyst: Chevron Duvernay Shale Assets May Sell in $900MM Range
2024-01-29 - E&Ps are turning north toward Canadian shale plays as Lower 48 M&A opportunities shrink, and Chevron aims to monetize its footprint in Alberta’s Duvernay play.

Athabasca Oil, Cenovus Energy Close Deal Creating Duvernay Pureplay
2024-02-08 - Athabasca Oil and Cenovus Energy plan to ramp up production from about 2,000 boe/d to 6,000 boe/d by 2025.
Analysts: Why Are Investors Snapping Up Gulfport Energy Stock?
2024-02-29 - Shares for Oklahoma City-based Gulfport Energy massively outperformed market peers over the past year—and analysts think the natural gas-weighted name has even more upside.

Uinta Basin's XCL Seeks FTC OK to Buy Altamont Energy
2024-03-07 - XCL Resources is seeking approval from the Federal Trade Commission to acquire fellow Utah producer Altamont Energy LLC.

SilverBow Saga: Investor Urges E&P to Take Kimmeridge Deal
2024-03-21 - Kimmeridge’s proposal to combine Eagle Ford players Kimmeridge Texas Gas (KTG) and SilverBow Resources is gaining support from another large investor.