Presented by:
[Editor's note: A version of this story appears in the July 2021 issue of Oil and Gas Investor magazine. Subscribe to the magazine here.]
The current narrative in the modern shale era mandates a balance of free cash flow distribution and sustainable growth. The rising prices for oil and natural gas in 2021 and 2022 and post-COVID-19 demand increases confirm we’ve seen the light at the end of the tunnel. For some, it can’t arrive soon enough, but in the meantime there’s an important component nearly everyone in the oil patch has their eye on.
Although public E&Ps have emphasized prudent capital plans, private operator rig counts have climbed to nearly 50% of total rigs in the U.S. Lower 48 since the beginning of the year. With limited disclosure on hedging portfolios, executive compensation incentives and varying levels of balance sheet strength, the influence of private companies may be underappreciated. Furthermore, private companies can operate on a shorter timeline for private equity investment, creating an increased urgency to spend dry powder.
Investor sentiment may be shifting away from rewarding long-dated inventory and moving toward cash flow generation—an attainable feat while growing production at today’s prices.
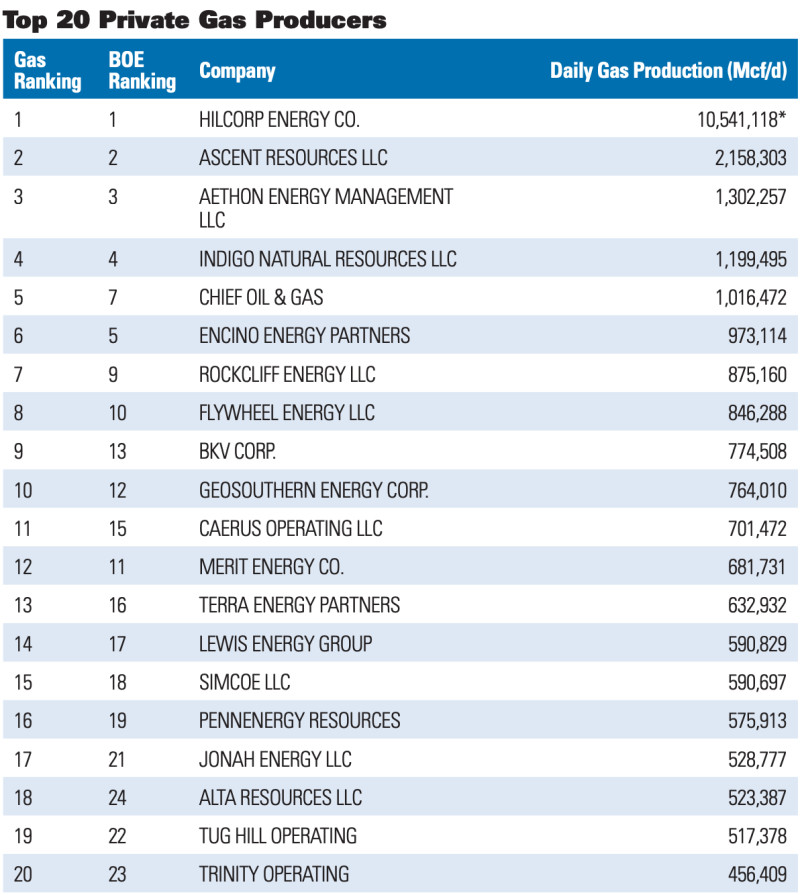
Production history
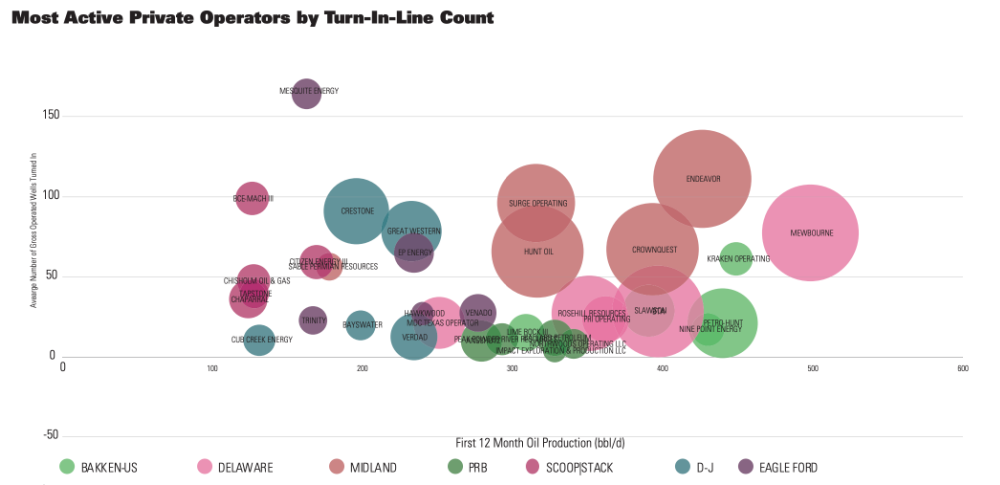
Between 2017 and 2019, private operators supplied nearly one-third of gross operated oil production to the overall U.S. supply stack, and the private wedge grew ~350,000 bbl/d, or about 12% on average, year-overyear in 2018 and 2019. This group dominates much of the activity in areas such as the Utica Shale and Haynesville Shale, contributing between ~60% and 70% of average monthly turn-in-lines (TILs) in 2019 and 2020. Private operators in the SCOOP/STACK, Powder River Basin (PRB) and Midland Basin account for nearly 50%, 40% and 40% of TILs, respectively, while the Eagle Ford Shale and Denver-Julesburg (D-J) Basin are nearly one-third private on average.
The price is right
The commodity market is no stranger to volatility with seven price signals since the beginning of 2015. At Enverus, we quantify a price signal as the first instant of a $10/bbl fluctuation within the forward-looking six months; adjacent spikes in the same direction within this time frame have been grouped into one signal.
In the last six financial planning cycles, 2020 produced the bleakest outlook for the 12-month strip with fourth-quarter 2015 close behind averaging ~$46/bbl. The 12- and 24-month moving average WTI futures contracts at ~$60/bbl and ~$55/bbl as of early March are ~40% and 25% higher than the fourth-quarter 2020 budgeting season strip. While prolonged depressed pricing undoubtedly influenced capital planning for 2021, the first-quarter 2021 rally in crude prices presents the opportunity for an activity recovery, yet relative to the past we expect public operators to hold to plans.
Responding to firmer prices
Private, public and supermajor operators across the major oil plays historically reacted to price signals at different time lags and speeds against market changes. Lags are defined as the time it takes between the price signal and a visible upward/downward trend in an operator’s spud. If there is no change in trajectory in the operator’s activity prior to the next price signal, it is assumed that the operator did not react to the initial event. Weighed against the price swing, private operators in the Delaware, Midland and Eagle Ford average four-month time lags between a price signal and spud date.
The latter two groups beat their public counterparts by a month, while Delaware private parties are on par with public operators. Private operators in the SCOOP/STACK and D-J Basin show about the same three-month reaction time as the public operators in the respective plays.
We measure the velocity that operators ramp up their well spuds upon reacting to a positive price signal by using the slope of the three-month moving average line adjusted for the operator’s reaction time lag. While public companies are undoubtedly working off a larger inventory of wells across most areas, it’s noteworthy that in the last four positive price signals, private operators in the Midland, Delaware and Eagle Ford reacted up to ~2.5, 3.5 and nine times the velocity of their public counterparts. The heightened acceleration from private operators primarily occurred during the January 2016 and August 2017 signals, which lasted nearly 1.5 years on average.
Although these were not indicative of the largest price swings, they lasted the longest (relatively.) And some key takeaways have emerged. We believe the first-quarter 2021 price swing incentivizes growth from private operators with highly economic results as they are not weighed down by a possible negative market reaction to growth beyond guidance and capital discipline. Moreover, the calendar 2022 strip recently averaged ~$55/bbl WTI, making for an attractive hedging opportunity.
While there has been modest rig recovery since the beginning of 2021, there are many high-return areas with a fraction of pre-pandemic rigs, and we expect private operators to ramp activity in these areas before others. Drilling rigs will need to recover at a steady pace or ramp up to match frac crew activity in first-half 2021 to avoid drawing down DUCs to critically low levels.
Where to look
The Delaware and Midland basins represent the largest potential for increased drilling in areas generating IRRs above 20%. The former needs to add ~100, and the latter needs ~85 to rebound to pre-pandemic levels. These two plays provide a combined ~55 areas of interest equating to ~120 rigs drilling prospects that generate returns in excess of 80% at current strip pricing. While the Delaware’s core north oil and gas areas are likely to see the greatest increase in drilling, we are also watching private operators with exposure to the south oil and slope regions. We are monitoring rig movements in the Midland Basin’s Central and Eastern Flank areas as these have the highest returns with the largest drop in rigs currently compared to first-quarter 2020.
The Eagle Ford, Bakken and SCOOP/STACK follow behind the Permian Basin with deficiencies of ~40, ~35 and ~15 rigs. The Eagle Ford’s core eastern volatile oil and condensate are among the most economic with the least rig recovery to date and show the potential to add another 13 rigs to get back to first-quarter 2020 levels.
*Note: Operator classification is indicative of current operator and does not account for M&A
(Source: Enverus)
**Note: There may be downside risk to average productivity when factoring in downspacing, completion design, or a shift to full-development.
(Source: Enverus; Wellcast; Prodcast)
Private operators
There are various active private operators across the oil plays with economics that make it feasible for a ramp-up in activity. The most active and economically superior private operators across major U.S. Lower 48 oil plays can add ~140,000 bbl/d of oil supply in the next 12 months after offsetting base declines. While this is not an immaterial volume, we do not believe this is bearish for prices in the next 12 months.
What to watch
Monitoring rig movements in the Midland Basin’s Central and Eastern Flank areas are a good first indicator, and the Delaware Basin’s core north oil and gas areas offer the highest IRRs and are likely to see the greatest increase in rig activity. The Eagle Ford’s east extension black oil, west volatile oil and west condensate are likely to show increased drilling as these areas generate IRRs of 40% to more than 100%. In the SCOOP/STACK, rigs in the STACK condensate and volatile oil areas have only recovered to 5% of pre-pandemic levels although the wells here can generate returns of ~50% in the current market. Private operators in the Midland, Delaware and Eagle Ford historically reacted up to 2.5 to nine times faster than their public counterparts during periods when oil prices gained $10/bbl WTI.
Private operators are adding rigs faster than publics which is similar to what we’ve observed after historical recoveries. As they may buck the capital discipline trend sweeping across the public space, they are clearly the group to watch right now and into the near future.
For the full list of Oil and Gas Investor’s Top 100 Private E&Ps, see pg. 56 in the July 2021 issue of Oil and Gas Investor magazine.
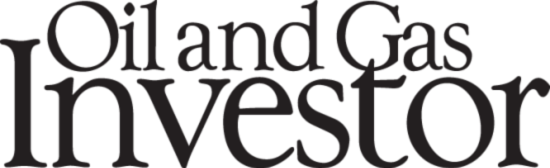
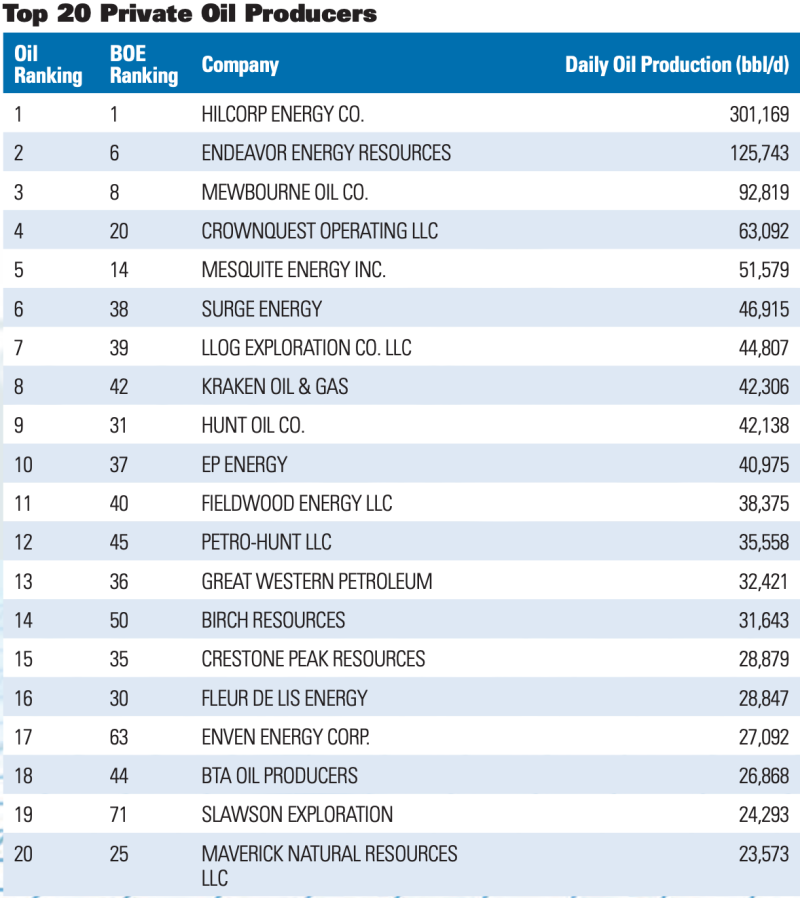
Top 100 U.S. Private E&P Operators |
||||||||
| COMPANY | DAILY PRODUCTION (boe/d) | DAILY OIL PRODUCTION (bbl/d) | DAILY GAS PRODUCTION (Mcf/d) | % OIL | WELL COUNT | WELLS ONLINE IN 2020 | RIG COUNT (4/26/21) | PRIMARY REGION |
| 1. Hilcorp Energy Co. | 2,058,023 | 301,169 | 10,541,118* | 14.63% | 20,081 | 36 | 1 | ALASKA |
| 2. Ascent Resources LLC | 382,656 | 22,938 | 2,158,303 | 5.99% | 603 | 74 | 4 | EASTERN US |
| 3. Aethon Energy Management LLC | 217,554 | 511 | 1,302,257 | 0.23% | 2,429 | 62 | 7 | GULF COAST |
| 4. Indigo Natural Resources LLC | 200,184 | 268 | 1,199,495 | 0.13% | 1,180 | 48 | 5 | GULF COAST |
| 5. Encino Energy Partners | 182,131 | 19,946 | 973,114 | 10.95% | 894 | 48 | 2 | EASTERN US |
| 6. Endeavor Energy Partners | 176,419 | 125,743 | 304,052 | 71.28% | 3,914 | 144 | 9 | PERMIAN |
| 7. Chief Oil & Gas | 169,412 | 0 | 1,016,472 | 0.00% | 376 | 23 | 1 | EASTERN US |
| 8. Mewbourne Oil Co. | 160,816 | 92,819 | 407,978 | 57.72% | 2,355 | 77 | 13 | PERMIAN |
| 9. Rockcliff Energy LLC | 146,347 | 487 | 875,160 | 0.33% | 1,008 | 47 | 4 | GULF COAST |
| 10. Flywheel Energy LLC | 141,048 | 0 | 846,288 | 0.00% | 3,667 | 0 | 0 | MIDCONTINENT |
| 11. Merit Energy Co. | 136,773 | 23,152 | 681,731 | 16.93% | 9,647 | 5 | 0 | MIDCONTINENT |
| 12. Geosouthern Energy Corp. | 130,807 | 3,472 | 764,010 | 2.65% | 556 | 18 | 4 | GULF COAST |
| 13. BKV Corp. | 129,574 | 490 | 774,508 | 0.38% | 4,124 | 0 | 0 | MIDCONTINENT |
| 14. Mesquite Energy Inc. | 121,407 | 51,579 | 418,968 | 42.48% | 2,307 | 32 | 1 | GULF COAST |
| 15. Caerus Operating LLC | 118,923 | 2,011 | 701,472 | 1.69% | 6,771 | 51 | 0 | ROCKIES |
| 16. Terra Energy Partners | 1007,166 | 1,677 | 632,932 | 1.56% | 5,442 | 54 | 0 | ROCKIES |
| 17. Lewis Energy Group | 100,686 | 2,214 | 590,829 | 2.20% | 1,823 | 25 | 2 | GULF COAST |
| 18. Simcoe LLC | 98,682 | 233 | 590,697 | 0.24% | 3,581 | 0 | 0 | ROCKIES |
| 19. PennEnergy Resources | 97,988 | 2,002 | 575,913 | 2.04% | 391 | 18 | 1 | EASTERN US |
| 20. CrownQuest Operating LLC | 95,514 | 63,092 | 194,527 | 66.06% | 1,134 | 83 | 4 | PERMIAN |
| 21. Jonah Energy LLC | 93,318 | 5,189 | 528,777 | 5.56% | 2,416 | 20 | 1 | ROCKIES |
| 22. Tug Hill Operating | 92,646 | 6,416 | 517,378 | 6.93% | 206 | 35 | 3 | EASTERN US |
| 23. Trinity Operating | 88,805 | 12,737 | 456,409 | 14.34% | 1,296 | 49 | 4 | MIDCONTINENT |
| 24. Alta Resources LLC | 87,231 | 0 | 523,387 | 0.00% | 381 | 21 | 1 | EASTERN US |
| 25. Maverick Natural Resources LLC | 86,747 | 23,573 | 379,041 | 27.17% | 3,722 | 17 | 0 | MIDCONTINENT |
| 26. Blackbeard Operating LLC | 86,152 | 14,118 | 432,206 | 16.39% | 3,756 | 31 | 0 | MIDCONTINENT |
| 27. Scout Energy Partners | 75,081 | 8,601 | 398,880 | 11.46% | 15,131 | 15 | 0 | MIDCONTINENT |
| 28. HG Energy | 71,177 | 1,340 | 419,023 | 1.88% | 161 | 20 | 3 | EASTERN US |
| 29. TG Natural Resources | 69,110 | 1,368 | 406,451 | 1.98% | 2,226 | 2 | 0 | GULF COAST |
| 30. Fleur de Lis Energy | 67,920 | 28,847 | 234,435 | 41.47% | 4,692 | 1 | 0 | MIDCONTINENT |
Farzin Mou is a vice president of intelligence at Enverus. She joined RS Energy Group, acquired by Enverus, in September 2017 as part of the Appalachia team focusing on net asset valuations, drilling and completions analysis, and acreage valuations. Since then, she spent a year as a principal consultant helping clients with strategic decisions using Enverus solutions. More recently, she joined the macro team with a focus on North American liquids supply.
Recommended Reading
Deep Well Services, CNX Launch JV AutoSep Technologies
2024-04-25 - AutoSep Technologies, a joint venture between Deep Well Services and CNX Resources, will provide automated conventional flowback operations to the oil and gas industry.

EQT Sees Clear Path to $5B in Potential Divestments
2024-04-24 - EQT Corp. executives said that an April deal with Equinor has been a catalyst for talks with potential buyers as the company looks to shed debt for its Equitrans Midstream acquisition.

Matador Hoards Dry Powder for Potential M&A, Adds Delaware Acreage
2024-04-24 - Delaware-focused E&P Matador Resources is growing oil production, expanding midstream capacity, keeping debt low and hunting for M&A opportunities.
TotalEnergies, Vanguard Renewables Form RNG JV in US
2024-04-24 - Total Energies and Vanguard Renewable’s equally owned joint venture initially aims to advance 10 RNG projects into construction during the next 12 months.
Ithaca Energy to Buy Eni's UK Assets in $938MM North Sea Deal
2024-04-23 - Eni, one of Italy's biggest energy companies, will transfer its U.K. business in exchange for 38.5% of Ithaca's share capital, while the existing Ithaca Energy shareholders will own the remaining 61.5% of the combined group.