Throughout history the vast majority of humans died in a world that looked very much like it did when they were born. More recently, the exponential growth of technology has fundamentally shifted the world’s systems and the humans who occupy it. The oil and gas industry has been struggling with the question of how it will adopt and adapt in light of these technological advancements. The largest driver in the current market of uncertainty is choosing a technology that will provide optimal learning for the least amount of effort, money and time.
One area in which the industry has chosen to explore technological advantage is in generating type curves and accurately forecasting well production. Traditional methods are based on empirical equations formulated in the 1940s that have no physical rationale. The original Arps equation was derived empirically through observation, but it is notoriously unstable. Currently, engineers use a mix of modified Arps methods as well as area expertise. Unfortunately, this method can introduce errors, or even a level of bias, which makes it very difficult, if not impossible, for two independently hand-built forecasts for a given well to be meaningfully reconciled against one another. One area in which computers are superior to humans is in pattern recognition. Machines can process copious volumes of data to empirically diagnose cancer better than doctors (90% versus 50%, respectively). Can a computer also predict well production more accurately?
Predictive analytics
Predictive analytics is the science of using past facts to understand the present and predict the future, specifically by training a model using historic data. Writing the algorithm to do that successfully has confounded the industry even with the advantage of big datasets and high-speed computing. The industry has only found one method that eschews the Arps formula altogether and tackles the problem from first principles using the diffusion equation as its base. With inputs of only monthly oil, gas, water volumes and producing hours, the BetaZi physio-statistical model can automatically forecast hydrocarbon production by finding 1 million possible scenarios (called samples), which explain the production history of a well (Figure 1). The model then runs statistics over the samples to establish a P50 forecast with calibrated forecast percentiles that represent a spread of risk around the P50. Finally, it tests results to make sure they are accurate. This is a powerful new scientific model that relies on quality data input.
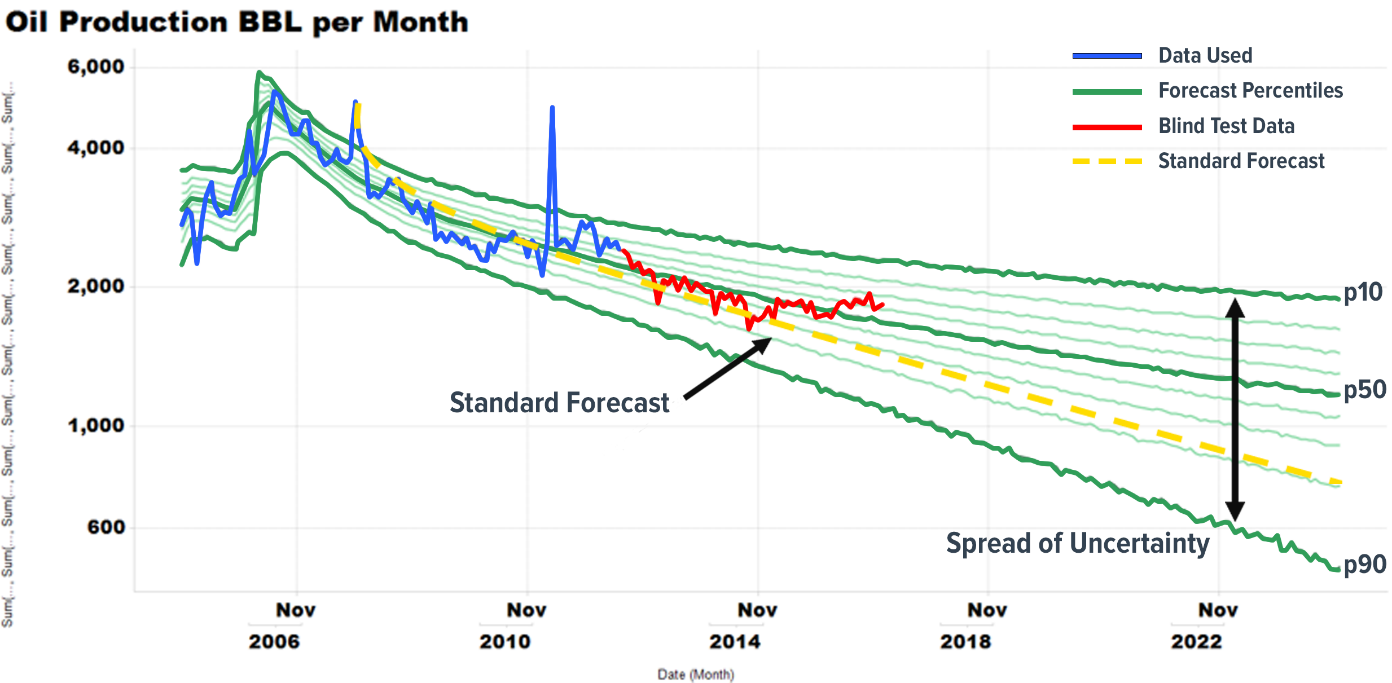
This predictive analytics algorithm works because it uses advanced science to combine both physics and experience into its solutions. It uses multiple solutions to differential equations to ensure that samples always honor the fundamental physics of fluid flow. At the same time, the model uses experience learned from training on large datasets to understand how typical well behavior deviates from physics.
geoLOGIC Systems ran its own test to determine how forecasts generated by this model fair against those produced by a seasoned human reservoir engineer (HRE).
Testing results
The company started with forecasts that were generated in October 2017 on a series of 19 British Columbia Montney wells. The wells were all operated by the same company and had at least three months of production data. To test for the accuracy of the predictions, geoLOGIC examined the cumulative gas produced in the following year (October 2017 to October 2018) and compared it with curves generated by basinINTEL, a data-driven production forecasting software powered by BetaZi, and the HRE in October 2017.
Figure 2 shows the difference between the cumulative gas reported over the following 12 months and the two different forecasts. The automatic forecasts generated by this software were more accurate in 10 out of 19 cases, and one would argue a tie on Well 4 (seeing as it was down to a decimal point).
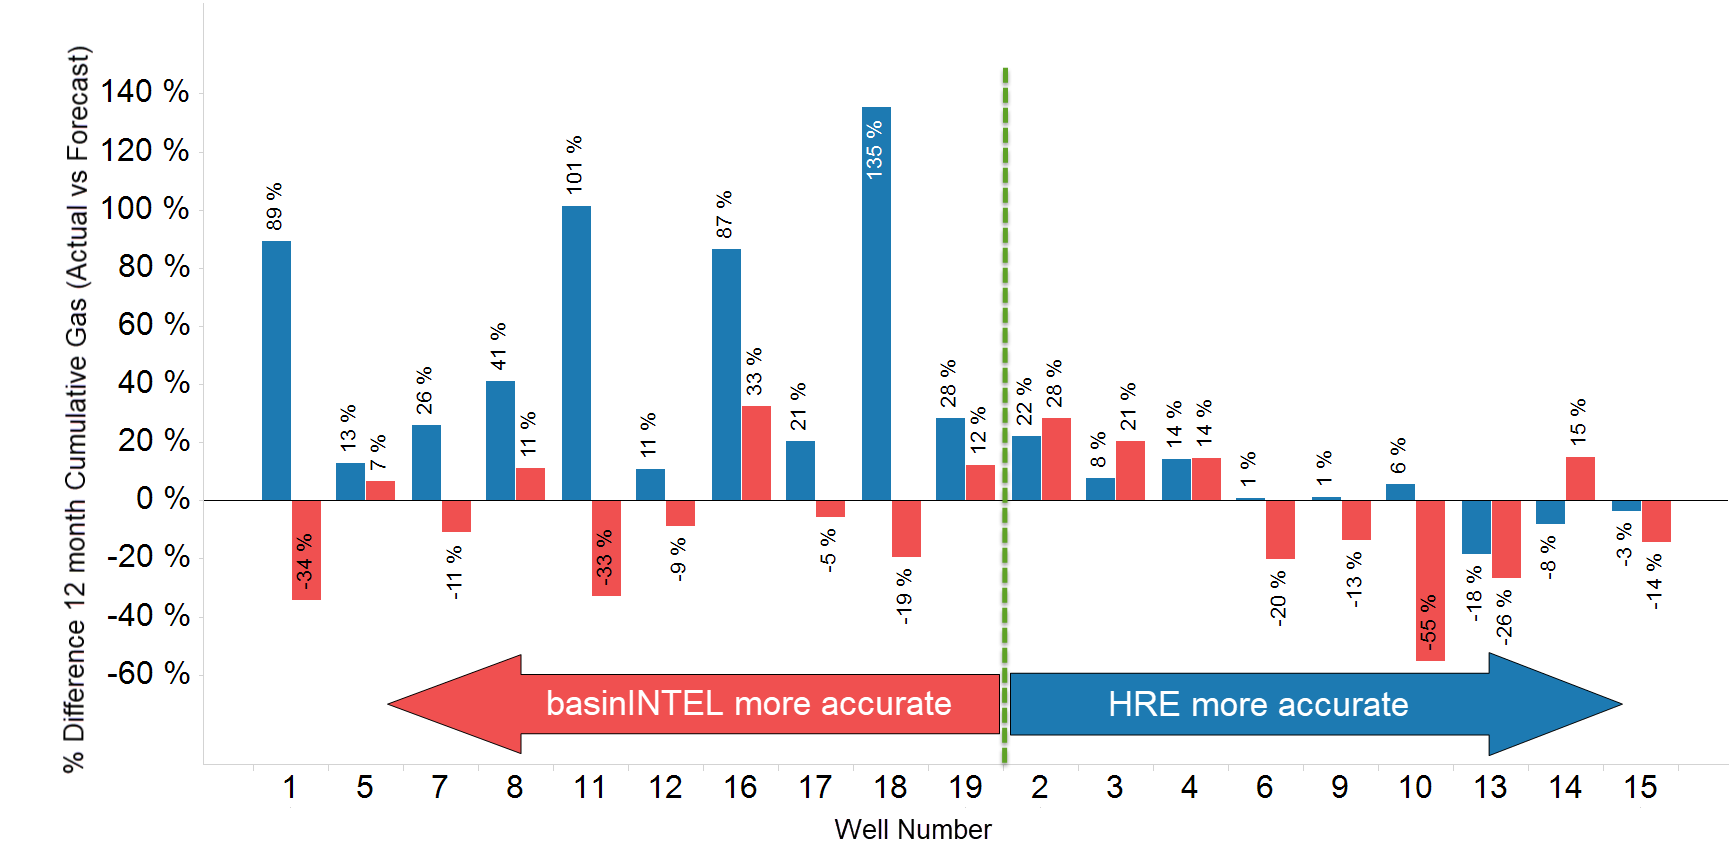
On average, the software outperformed the HRE (-5% inaccuracy versus 30%-plus) with a smaller variance and no outliers. Also, for the most part, the HRE seemed to overestimate a well’s ability to produce, which could severely impact return on investment calculations.
Notably, five of the nine wells the HRE forecasted more accurately than the software were on production for only four months before the forecast being performed. In one example, a well had just reached the
peak rate on the month the forecast was generated. The HRE created these curves based on area expertise rather than the actual production data, causing them to be more art than science.
geoLOGIC concluded that the automatic forecasts were superior for accuracy, cost-efficiency and time. The company found this new science was able to provide thousands of unbiased forecasts at one’s fingertips, as opposed to the labor-intensive and error-prone methods of conventional production forecasting. This technology is cheap and available enough to allow anyone to use it as a baseline for evaluating not just big deals but all of their well data.
Recommended Reading

Wayangankar: Golden Era for US Natural Gas Storage – Version 2.0
2024-04-19 - While the current resurgence in gas storage is reminiscent of the 2000s —an era that saw ~400 Bcf of storage capacity additions — the market drivers providing the tailwinds today are drastically different from that cycle.
Biden Administration Criticized for Limits to Arctic Oil, Gas Drilling
2024-04-19 - The Bureau of Land Management is limiting new oil and gas leasing in the Arctic and also shut down a road proposal for industrial mining purposes.

SLB’s ChampionX Acquisition Key to Production Recovery Market
2024-04-19 - During a quarterly earnings call, SLB CEO Olivier Le Peuch highlighted the production recovery market as a key part of the company’s growth strategy.

PHX Minerals’ Borrowing Base Reaffirmed
2024-04-19 - PHX Minerals said the company’s credit facility was extended through Sept. 1, 2028.

Exclusive: The Politics, Realities and Benefits of Natural Gas
2024-04-19 - Replacing just 5% of coal-fired power plants with U.S. LNG — even at average methane and greenhouse-gas emissions intensity — could reduce energy sector emissions by 30% globally, says Chris Treanor, PAGE Coalition executive director.