
RED President Steve Hendrickson looks at the recent volatility in natural gas prices and what the future might hold for the commodity. (Source: Shutterstock.com)
This is an excerpt from the Ralph E. Davis Associates (RED) Weekly E&P Update Newsletter.
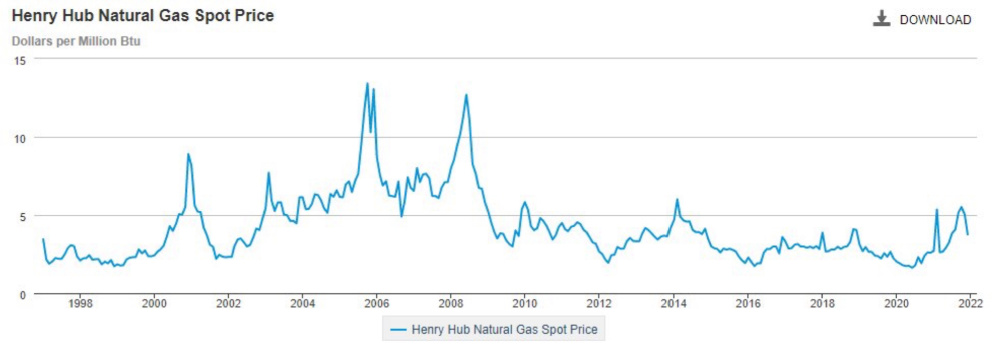
Just over two months ago we were entering the winter heating season enjoying the highest U.S. natural gas prices in almost eight years. Demand was strengthening as the economy continued to recover, exports were humming and although rig counts were higher, natural gas producers had, for the most part, maintained capital discipline and resisted the urge to overdrill.
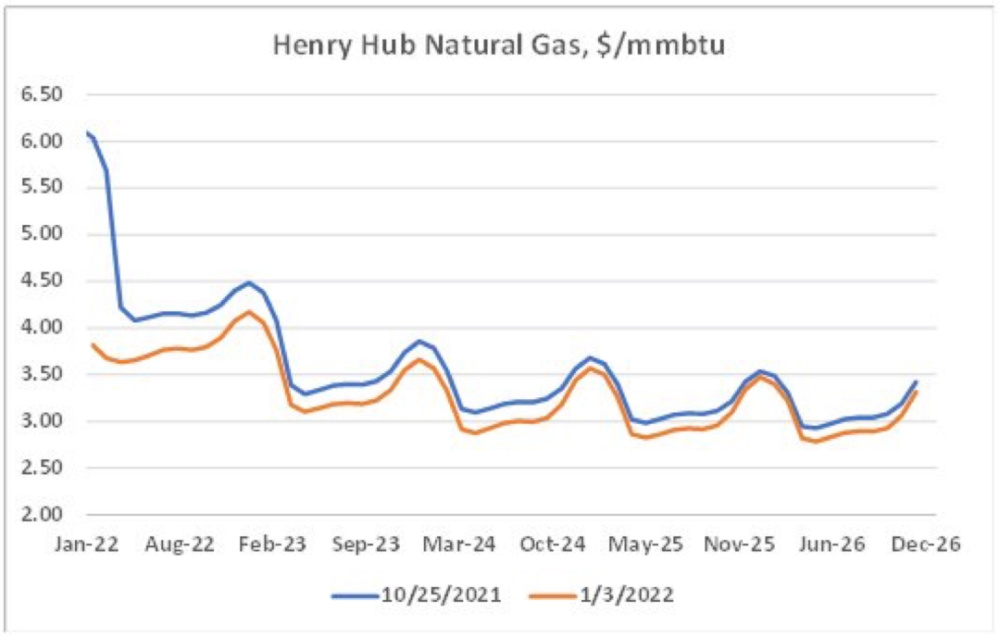
By the end of the year, however, natural gas spot and futures prices had fallen significantly. What happened?
Overproduction doesn’t seem to be the culprit. Although U.S. natural gas production has increased steadily since the demand drop at the start of the pandemic, the annual average has been consistent over the last three years.
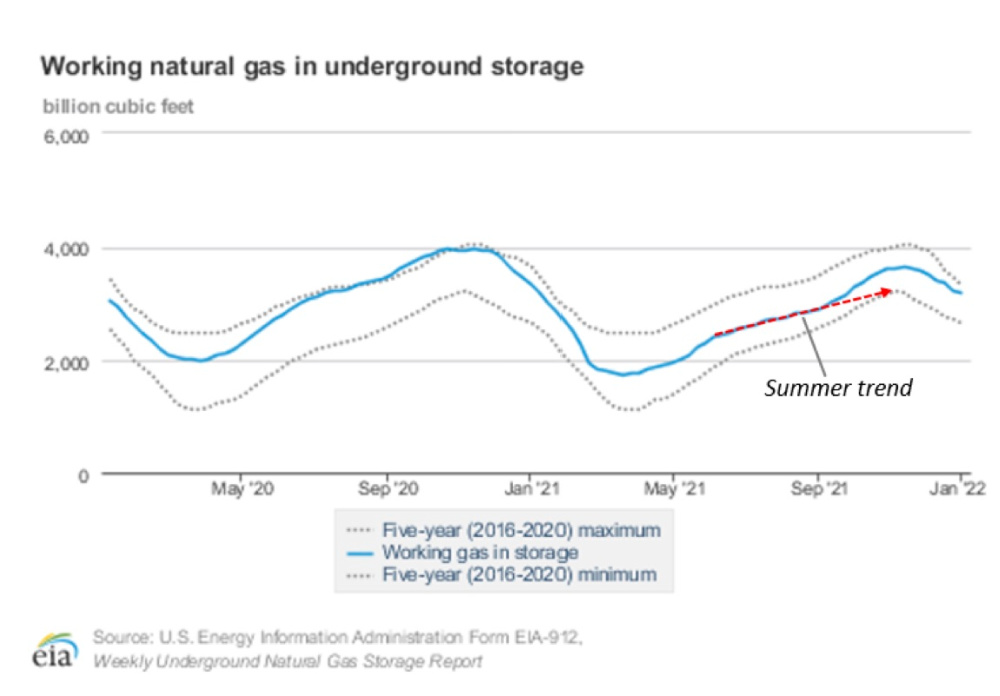
Looking back at working gas in storage, we can see that we were on a trajectory to enter the heating season near the five-year low. In October, the trend changed, however. Production did increase slightly during this period, but the big story was the surprisingly mild weather we experienced in the last three months of the year. If you live in Texas, you know exactly what I’m talking about. According to the Texas State Climatologist, in 2021, we experienced what was probably the warmest December since at least 1989.
On the bright side, Natural Gas Intelligence reported this week that factors may be lining up for higher prices before the winter is over. Production has dipped recently, and the latest weather models indicate the U.S. may get a cold blast of Canadian air near the end of the month (hopefully not as cold as last year!). February future prices closed above $4/MMBtu on Jan. 10 (about 8% higher than where we were a week ago), and there’s a good chance that we’ll exit the heating season with storage near the five-year average rather than the five-year high.

About the Author:
Steve Hendrickson is the president of Ralph E. Davis Associates, an Opportune LLP company. Hendrickson has over 30 years of professional leadership experience in the energy industry with a proven track record of adding value through acquisitions, development and operations. In addition, he possesses extensive knowledge of petroleum economics, energy finance, reserves reporting and data management, and has deep expertise in reservoir engineering, production engineering and technical evaluations. Hendrickson is a licensed professional engineer in the state of Texas and holds an M.S. in Finance from the University of Houston and a B.S. in Chemical Engineering from The University of Texas at Austin. He recently served as a board member of the Society of Petroleum Evaluation Engineers and is a registered FINRA representative.
Recommended Reading

EIG’s MidOcean Closes Purchase of 20% Stake in Peru LNG
2024-04-23 - MidOcean Energy’s deal for SK Earthon’s Peru LNG follows a March deal to purchase Tokyo Gas’ LNG interests in Australia.
TotalEnergies to Acquire Remaining 50% of SapuraOMV
2024-04-22 - TotalEnergies is acquiring the remaining 50% interest of upstream gas operator SapuraOMV, bringing the French company's tab to more than $1.4 billion.

TotalEnergies Cements Oman Partnership with Marsa LNG Project
2024-04-22 - Marsa LNG is expected to start production by first quarter 2028 with TotalEnergies holding 80% interest in the project and Oman National Oil Co. holding 20%.

Is Double Eagle IV the Most Coveted PE-backed Permian E&P Left?
2024-04-22 - Double Eagle IV is quietly adding leases and drilling new oil wells in core parts of the Midland Basin. After a historic run of corporate consolidation, is it the most attractive private equity-backed E&P still standing in the Permian Basin?
Brett: Oil M&A Outlook is Strong, Even With Bifurcation in Valuations
2024-04-18 - Valuations across major basins are experiencing a very divergent bifurcation as value rushes back toward high-quality undeveloped properties.