
(Source: Hart Energy; Kairos Aerospace)
[Editor's note: A version of this story appears in the May 2020 edition of E&P. Subscribe to the magazine here.]
These days, the oil and gas industry is under pressure to reduce methane emissions from all directions— from governments, environmental activists and now even investors. Many companies, including the members of the API’s Environmental Partnership and the members of the Oil and Gas Climate Initiative, have made public commitments to set and achieve targets for reduced methane intensity in their operations. Behind the scenes, however, most companies struggle with how to achieve these goals. They often have incomplete information about what their current emissions are or where they come from. Methane mitigation practices are usually designed around regulatory requirements, which are mostly about required actions—whether they are effective or not. Methane leak detection and repair (LDAR) programs can feel like an unending game of whack-a-mole—constantly searching for and fixing leaks without ever understanding the big picture or finding ways to prevent leaks from happening in the first place. Is there a way to be more strategic about tackling this problem?
A good strategy would establish a baseline, create and implement a plan and then measure progress. That might sound pretty basic, but many operators struggle to define and implement an emissions reduction strategy. In part, that is because it has been too difficult to measure their actual emissions and establish a baseline.
But don’t companies already know and report on their methane emissions? Well, yes and no. Many companies operating in the U.S. are required to provide methane emissions estimates by the EPA’s Greenhouse Gas Reporting Program (GHGRP). The GHGRP methodology causes companies to report emissions largely based on emission factors, not actual measurements. Those factors are intended to represent industry average emission rates for different types of equipment, but they tell us very little about the actual performance for an individual company or where that company’s emissions are coming from. This is especially true because researchers have found that a majority of emissions in most of the datasets studied come from a small percentage of sites with especially high emission rates. Those large emissions sources are often caused by equipment malfunctions and other abnormal operations, not by the kind of typical operations that the emission factors are capturing. As an example of this, an analysis by the Environmental Defense Fund (EDF) of top methane emissions sources in the New Mexico Permian estimated that 72% of all methane was coming from these abnormal sources. In short, while the GHGRP numbers may be adequate for giving the EPA a rough industrywide estimate, they do not provide the level of detail about where emissions are really coming from that decision-makers within a company need to take action effectively.
Establishing a more accurate baseline
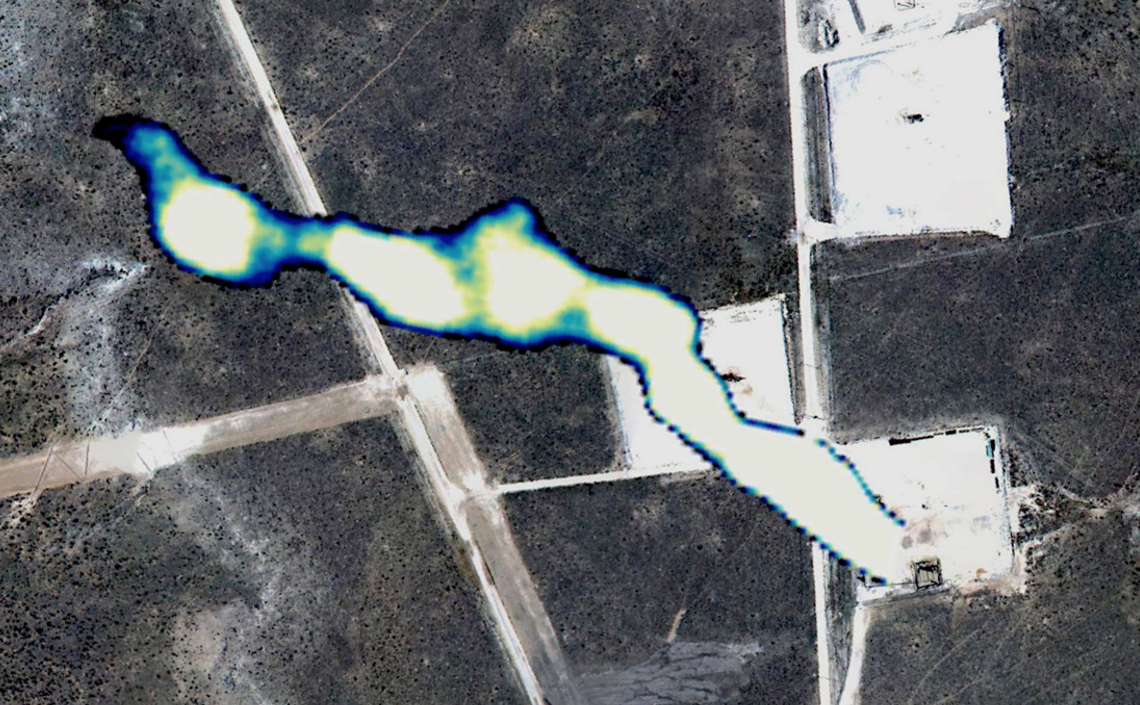
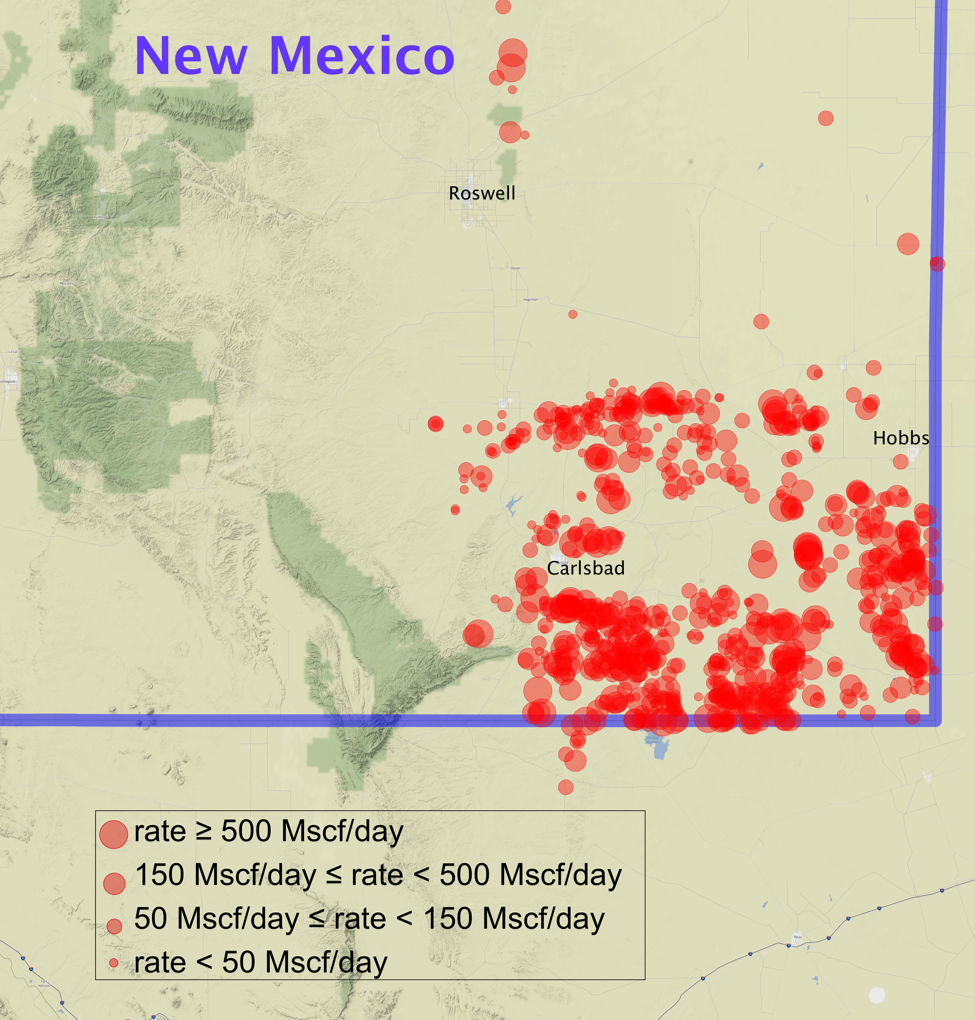
It starts by measuring actual emissions. It would be very time-consuming to measure every source of methane on every well pad across a whole operation, but operators can quickly and inexpensively measure the larger sources that represent the majority of emissions. In 2019 Kairos surveyed most of the New Mexico portion of the Permian Basin, inspecting more than 28,000 active wells
and 10,000 miles of natural gas pipelines as well as identifying about 1,000 large sources of methane emissions. Comparing the Kairos system’s sensitivity to a model developed by the EDF, an estimated 1,000-plus sources accounted for 70% to 80% of all methane being emitted in the region. That is encouraging news because it tells that significant methane reduction can be achieved by fixing a relatively small number of problems (less than 3% of sites). If more than 70% of the total emissions are being directly located and measured, both the estimate of total emissions and the understanding of the root causes should dramatically improve.
Creating a better plan of action
As an analogy, imagine being responsible for water conservation in a town going through a serious drought. One could hire a plumber to find and fix leaks in people’s homes. The plumber would go to the first apartment building and systematically inspect each apartment, testing every faucet for drips. And he’d find some, so he would have to spend time and money repairing those faucets.
Meanwhile, one street over, there is a broken sprinkler head shooting water 10 ft in the air in someone’s backyard while the owner is away at work. That plumber could spend weeks (and a lot of money) fixing drippy faucets before he’d save as much water as he could have by fixing one bad sprinkler. That is what is going on today with methane.
People are sent out to look for dripping faucets because the location of the broken sprinklers is unknown. Worse, in some cases, perfectly good faucets are replaced just because the emission factors show that the newer model leaks less on average, and that is the way to make the GHGRP numbers look better. Measuring methane emissions from entire fields from high above, as Kairos does, gives a baseline for emissions and gives a map of where the opportunities for improvement are.
Measuring progress
Understanding the big picture can help make LDAR programs less of a game of whack-a-mole. As an example, a client from the 2019 survey realized that a significant number of its large emissions were coming from a particular type of thief hatch that was not sealing properly. Within the client’s operations, several types of hatches were used, but the problems appeared to be associated with just one type, which led the client to systematically replace all the hatches of that type. As Kairos resurveys the field again this spring and measures progress, it is expected to see that this one insight, and the resulting proactive maintenance program, were a big step forward in preventing problems before they happen.
Understanding the big picture can identify sources of emissions that are not as easily addressed, but knowing what they are can still inform priorities and targets. For one client, Kairos’ work identified the root cause for a large portion of emissions was that line pressure was frequently too high in one of its midstream partners’ gathering networks, causing venting (as intended) from the pressure relief valves on the tank batteries. This is not something that is immediately repairable since their own equipment was working correctly. However, knowing how much of their emissions were caused by this type of problem highlights the importance of working with the midstream partner to alleviate the bottlenecks or considering other alternatives to avoid frequent venting.
Better data about true emissions can justify action on economic or compliance grounds. One client had used standard emissions estimating techniques for a large crude gathering and processing facility, but when the actual emissions from that facility were measured, it significantly exceeded expectations. The higher numbers justified investing in a larger vapor recovery system, both to capture the unexpectedly large amount of lost product and ensure that it stayed within permitted levels for the facility. It was a clear example of the value of direct measurement rather than relying on engineering estimates or emission factors.
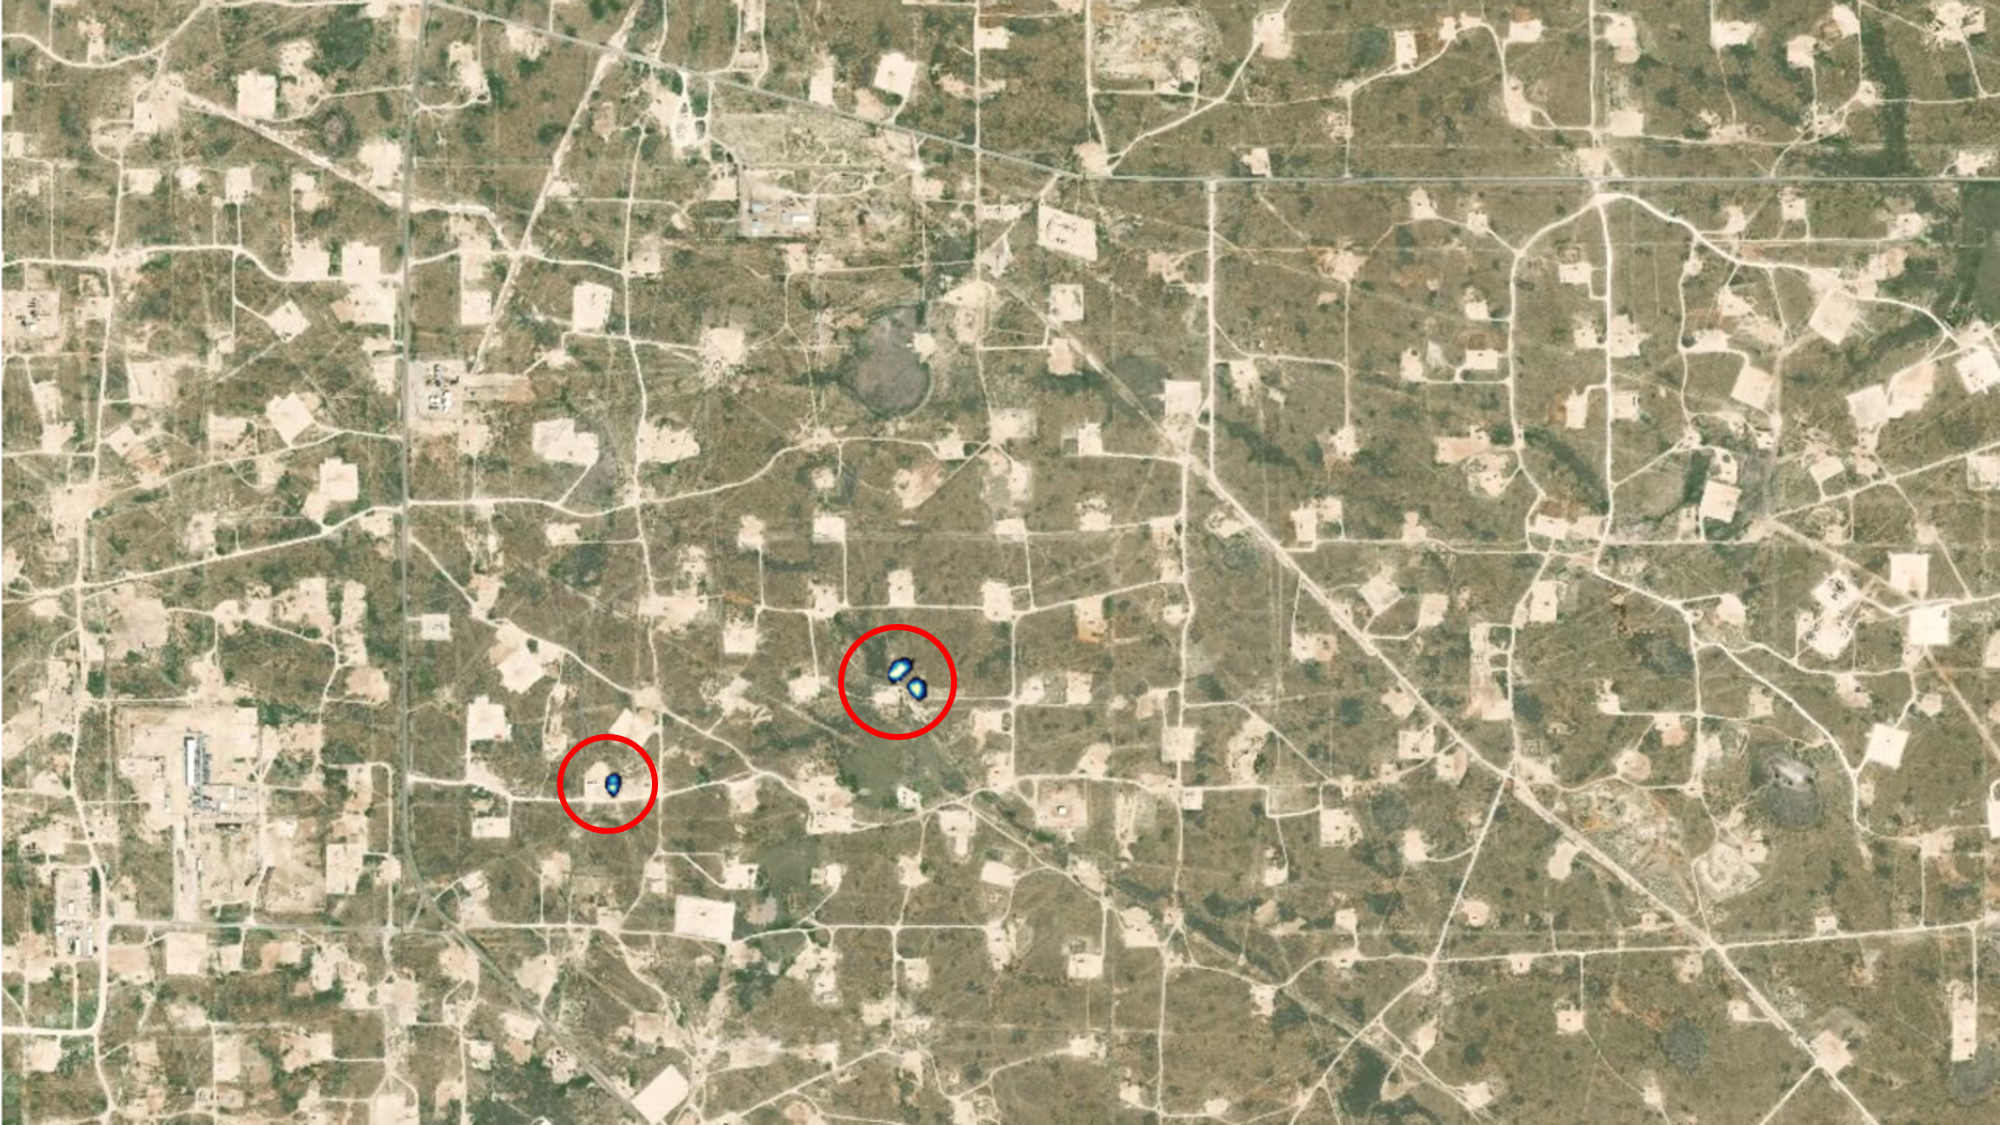
Understanding the big picture might even identify problems in places not checked. For example, 30% of methane emissions (by volume) identified during the 2019 New Mexico Permian survey were from sources well away from well pads or other surface facilities. It was discovered that there are a lot of leaking flowlines and natural gas gathering lines out there in places where conventional LDAR teams rarely, if ever, look. When scanning an entire area from high above, however, those unexpected sources will be detected. Because these pipeline leaks tend to be relatively large, clients were able to make big reductions in overall emissions just by fixing a handful of these unexpected problems.
Stakeholders from financial institutions, environmental groups and the public are demanding that the oil and gas industry reduce methane emissions, and many companies have pledged to do so. That should start with establishing a baseline—an accurate understanding of how much methane being emitted and from where—by directing, locating and measuring the large sources that typically account for a majority of emissions. Understanding that big picture will allow prioritization of efforts and establish realistic targets for improvement. Then the ongoing measurement will track progress versus the baseline and demonstrate to stakeholders that delivery on those promises. Let’s stop focusing on those drippy faucets and start fixing the broken sprinklers.
References available. Contact Jennifer Presley at jpresley@hartenergy.com for more information.
Recommended Reading
Exxon Versus Chevron: The Fight for Hess’ 30% Guyana Interest
2024-03-04 - Chevron's plan to buy Hess Corp. and assume a 30% foothold in Guyana has been complicated by Exxon Mobil and CNOOC's claims that they have the right of first refusal for the interest.
Pitts: Heavyweight Battle Brewing Between US Supermajors in South America
2024-04-09 - Exxon Mobil took the first swing in defense of its right of first refusal for Hess' interest in Guyana's Stabroek Block, but Chevron isn't backing down.
Petrobras to Step Up Exploration with $7.5B in Capex, CEO Says
2024-03-26 - Petrobras CEO Jean Paul Prates said the company is considering exploration opportunities from the Equatorial margin of South America to West Africa.

Exxon Ups Mammoth Offshore Guyana Production by Another 100,000 bbl/d
2024-04-15 - Exxon Mobil, which took a final investment decision on its Whiptail development on April 12, now estimates its six offshore Guyana projects will average gross production of 1.3 MMbbl/d by 2027.
Exxon Mobil Green-lights $12.7B Whiptail Project Offshore Guyana
2024-04-12 - Exxon Mobil’s sixth development in the Stabroek Block will add 250,000 bbl/d capacity when it starts production in 2027.