
Storm clouds are gathering on the LNG export future that may disrupt the smooth sailing Haynesville Shale. (Source: Shutterstock.com; Hart Energy)
[Editor's note: A version of this story appears in the June 2020 edition of E&P. Subscribe to the magazine here. It was originally published June 1, 2020.]
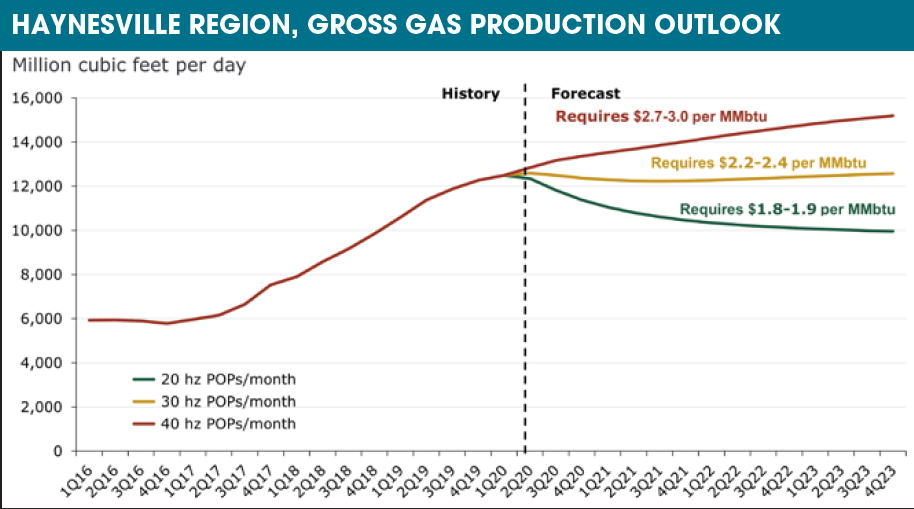
The Haynesville gas basin, arguably the most important basin for LNG exports in the U.S. due to its proximity to existing and planned terminals, is set for a 20% decline in output toward 2023 if Henry Hub prices average $1.80 to $1.90/MMBtu, according to a Rystad Energy analysis.
Henry Hub prices are currently within the $1.80 to $1.90 range, and if they maintain current levels until 2023, gas production in Haynesville is set for a decline in activity. As a result, Rystad expects only an average of 20 horizontal wells per month will be put on production. Haynesville gross gas output will then fall from 12.5 Bcf/d to 10 Bcf/d throughout 2020-2022, stabilizing in 2023.
In a Henry Hub environment of $2.20 to $2.40, the running rate of activity is at about 30 horizontal wells per month in the medium term. Such an activity level delivers an almost perfect match with maintenance requirements, with production remaining close to 12.5 Bcf/d during 2020 to 2023. Higher gas prices are sufficient to trigger continuous production growth in the Haynesville.
In a $2.70 to $3 Henry Hub environment, the running rate of activity is set to increase to 40 wells per month—sufficient to see another 3 Bcf/d added by the Haynesville before year-end 2023.
“As of today, we have not seen any meaningful production slowdown in Haynesville gas output—yet. With the declining trend, activity is set to fall below maintenance requirements in the next few months. Nevertheless, we should not forget about the likelihood of continuous productivity improvements, which always accompany declining activity due to the renewed focus on the best projects,” said Artem Abramov, Rystad Energy’s head of shale research.
The total number of horizontal spuds per quarter has already declined from about 110 to 120 wells per quarter in the fourth quarter of 2017 to the third quarter of 2019, and to 85 wells in the first quarter of 2020. With the current rig count, the basin will likely be down to 75 horizontal spuds in the second quarter of this year.
The number of wells put on production has lagged behind spuds in 2017 to 2019. But everything changed in the fourth quarter of 2019 to the first quarter of this year, as operators began diving into their drilled but completed inventory (a normal trend when the drilling market begins to decline). In the first quarter, it is estimated that Haynesville operators put 94 horizontal wells on production, but the recent decline in fracking will likely result in about a 15% contraction in activity put on production in the second quarter.
Among all major unconventional oil and gas basins in the U.S., the Haynesville exhibits the highest production contribution from private operators. As of the first quarter, private operators produced 7.2 Bcf/d of gross gas in the region, almost 60% of total output. Private operators also drove nearly all recent growth in the region.
As of the first quarter, short-term growth is probably over for dedicated public operators and supermajors—both groups exhibit little to no growth on a year-over-year basis, with a growing number of operators managing a plateau. In turn, many private operators had a back-loaded growth schedule in 2019, and the group as a whole pushed its year-over-year growth to a record high level of about 1.5 Bcf/d, a level previously achieved in 2018.
Recommended Reading
Imperial Expects TMX to Tighten Differentials, Raise Heavy Crude Prices
2024-02-06 - Imperial Oil expects the completion of the Trans Mountain Pipeline expansion to tighten WCS and WTI light and heavy oil differentials and boost its access to more lucrative markets in 2024.
US Gulf Coast Heavy Crude Oil Prices Firm as Supplies Tighten
2024-04-10 - Pushing up heavy crude prices are falling oil exports from Mexico, the potential for resumption of sanctions on Venezuelan crude, the imminent startup of a Canadian pipeline and continued output cuts by OPEC+.
Oil Broadly Steady After Surprise US Crude Stock Drop
2024-03-21 - Stockpiles unexpectedly declined by 2 MMbbl to 445 MMbbl in the week ended March 15, as exports rose and refiners continued to increase activity.

Exxon’s Payara Hits 220,000 bbl/d Ceiling in Just Three Months
2024-02-05 - ExxonMobil Corp.’s third development offshore Guyana in the Stabroek Block — the Payara project— reached its nameplate production capacity of 220,000 bbl/d in January 2024, less than three months after commencing production and ahead of schedule.
Russia Orders Companies to Cut Oil Output to Meet OPEC+ Target
2024-03-25 - Russia plans to gradually ease the export cuts and focus on only reducing output.