Completion strategies have differed depending on the area in the Williston Basin. What works best to lower dollars per barrel of oil? A new statistical analysis methodology, based on completion and production data available in the public domain, was applied to Middle Bakken wells in the Central Basin to answer this question.
In general, two types of analysis are used to determine what makes a better well. One is “dumb” statistical analysis methods such as multivariate analysis (MVA), which can help find “accidental” relationships between well production and completion. Petrophysical parameters also can be used in this method. Lolon et al. (2016) described a MVA methodology that divides a dataset in a testing and training portion to achieve analysis results that are independent of the selected data. The analysis showed that multiple linear regression techniques were the best approach. Despite the complexities of the workflow for the use of these models, they only uncover independent relationships between parameters without providing a physical reason regarding why there might be a relationship.
The other analysis method involves “smart” physical models, in this case calibrated fracture and reservoir models, which can be run to determine production sensitivities.
The advantage of the first method is that information for thousands of wells can be included, whereas calibrated modeling is generally only conducted on a few wells. In this analysis, it was decided to combine the strengths of both methods and include well-understood physical relationships for common completion parameters to improve the “dumb” MVA and make it smarter.
Differences in models
There is only a subtle difference between a linear MVA model and the new physics-based MVA model that has been developed. In a linear MVA, some production metrics (e.g., 365-day cumulative oil production) is simply a linear function of a variety of completion and petrophysical parameters. In the physics-based model, the linear functions for completion parameters have been replaced with relationships derived from calibrated fracture/ reservoir modeling.
Figure 1 shows a plot of 365-day cumulative oil production normalized per lateral foot versus proppant mass per lateral foot and versus fracture stage intensity. Middle Bakken production datapoints, as well as the linear and physics-based relationships that best fit these data, are shown. The physics-based function that approximates the results best in this area with significant fracture height growth is natural- log based, which provides the transformed relationship of proppant mass per lateral foot in the subsequent MVA statistical models.

Figure 1 also shows the results of the reservoir modeling sensitivities of 365-day cumulative oil production normalized per foot of lateral versus fracture spacing. Note that fracture or fracture-entry point spacing (number of perf clusters or sleeves per stage) is not readily available in the public domain. Therefore, stage spacing, stage length (foot/stage) or number of stages is used as a proxy for fracture spacing assuming that more fracture stages along the lateral will result in a higher fracture density along the wellbore. The model results show increasing incremental oil production as fracture spacing is reduced.
Once a MVA production model has been created, a fracture pricing model can be applied to determine how production changes as a function of completion cost and to determine which completion parameter provides the best bang for a completion buck. Contrary to common financial analysis using dollars per barrel of oil for the lifetime of the well (EUR), this financial analysis is conducted only with known production data (e.g., 365-day cumulative oil production). The benefit of this is that type curve assumptions do not have to be considered.
Figure 2 shows an evaluation of the impact of two physics-based completion parameters used: proppant mass and stage intensity. The hybrid physics-based MVA model predicts a production increase that at some point stops offsetting the increase in cost, thus leading to higher dollars per barrel of oil. The lowest point in the valley of the dollars per barrel of oil curve, therefore, gives the optimum proppant mass. The minimum dollar per year price of $39/bbl is achieved at about 750 lb/ft of proppant mass in this example.
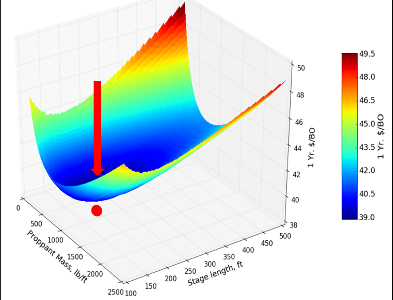
The dollars per year barrel of oil sensitivity to stage spacing appears to be weaker and exhibits a minimum about 61 m (200 ft) (50 stages for 3,048-m [10,000-ft] lateral). However, the sensitivity to pump rate is quite strong and does not exhibit a minimum dollars per year barrel of oil within the range. Dollars per year barrel of oil are minimized with an increase in pump rate up to a physical maximum of about 100 bbl/min.
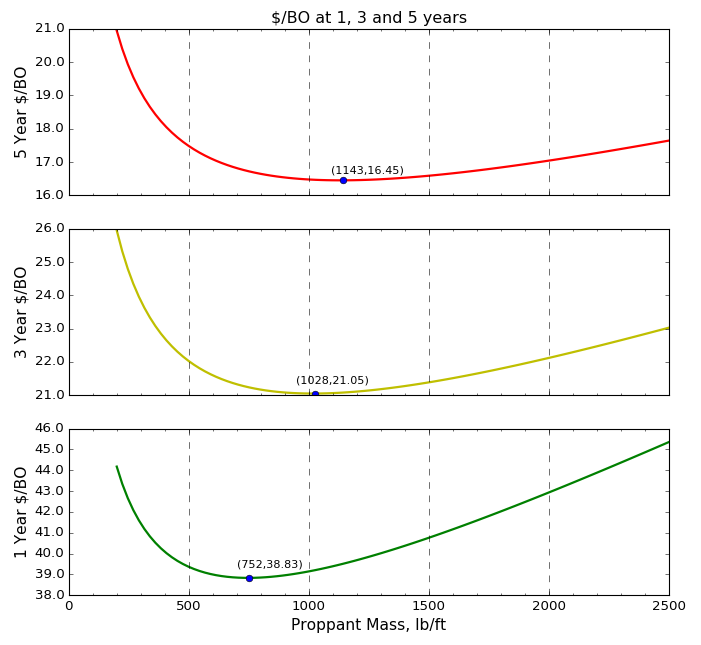
The results for the dollars per barrel of oil optimization extrapolated to three and five years are shown in Figure 3. The minimum dollars per barrel of oil shifts toward larger proppant mass or treatment sizes as a larger time frame is considered. The optimum $5/year/bbl is achieved by increasing treatment sizes by about 400 lb/ft to 1,140 lb/ft of proppant mass (27 bbl/ ft of clean fluid) compared to the one-year optimum. The shift to larger optimum treatment sizes for a longer producing period occurs because the well cost remains fixed while the production benefit with increased treatment sizes becomes larger in the long term. This would imply that pumping at least 1,000 lb/ft of proppant mass with 20 bbl/ft of clean fluid would still result in improved economics for short-term five-year production metrics in the Williston Central Basin provided there are no other limitations such as tighter well spacing and associated interwell communication.
Conclusions
A hybrid MVA model with transformed completion parameters based on physical relationships results in more realistic predictions of well performance as a function of these completion parameters. The MVA model indicates that for both the Middle Bakken and Three Forks the most significant completion parameters in order of importance are proppant mass per foot of lateral, pump rate, average pumped proppant concentration (fluid system) and stage spacing. The analysis methodology has been extended to other U.S. liquid-rich basins.
References available. Contact Brian Walzel for more information at bwalzel@hartenergy.com.
Recommended Reading

Range Resources Holds Production Steady in 1Q 2024
2024-04-24 - NGLs are providing a boost for Range Resources as the company waits for natural gas demand to rebound.

Hess Midstream Increases Class A Distribution
2024-04-24 - Hess Midstream has increased its quarterly distribution per Class A share by approximately 45% since the first quarter of 2021.

Baker Hughes Awarded Saudi Pipeline Technology Contract
2024-04-23 - Baker Hughes will supply centrifugal compressors for Saudi Arabia’s new pipeline system, which aims to increase gas distribution across the kingdom and reduce carbon emissions

PrairieSky Adds $6.4MM in Mannville Royalty Interests, Reduces Debt
2024-04-23 - PrairieSky Royalty said the acquisition was funded with excess earnings from the CA$83 million (US$60.75 million) generated from operations.
Equitrans Midstream Announces Quarterly Dividends
2024-04-23 - Equitrans' dividends will be paid on May 15 to all applicable ETRN shareholders of record at the close of business on May 7.