Although ultrasonic measurements have been in use for borehole imaging, in openhole and cased-hole wireline for more than three decades, they could not be used in highly deviated wells and hostile environments.
Thus, efforts have been made to develop ultrasonic LWD imaging devices that are no longer dependent on the type of drilling mud or standoff such as LWD resistive imaging tools. It was also important to obtain a resolution of the image that would allow accurate identification of stratigraphic, structural and tectonic stress direction indicators.
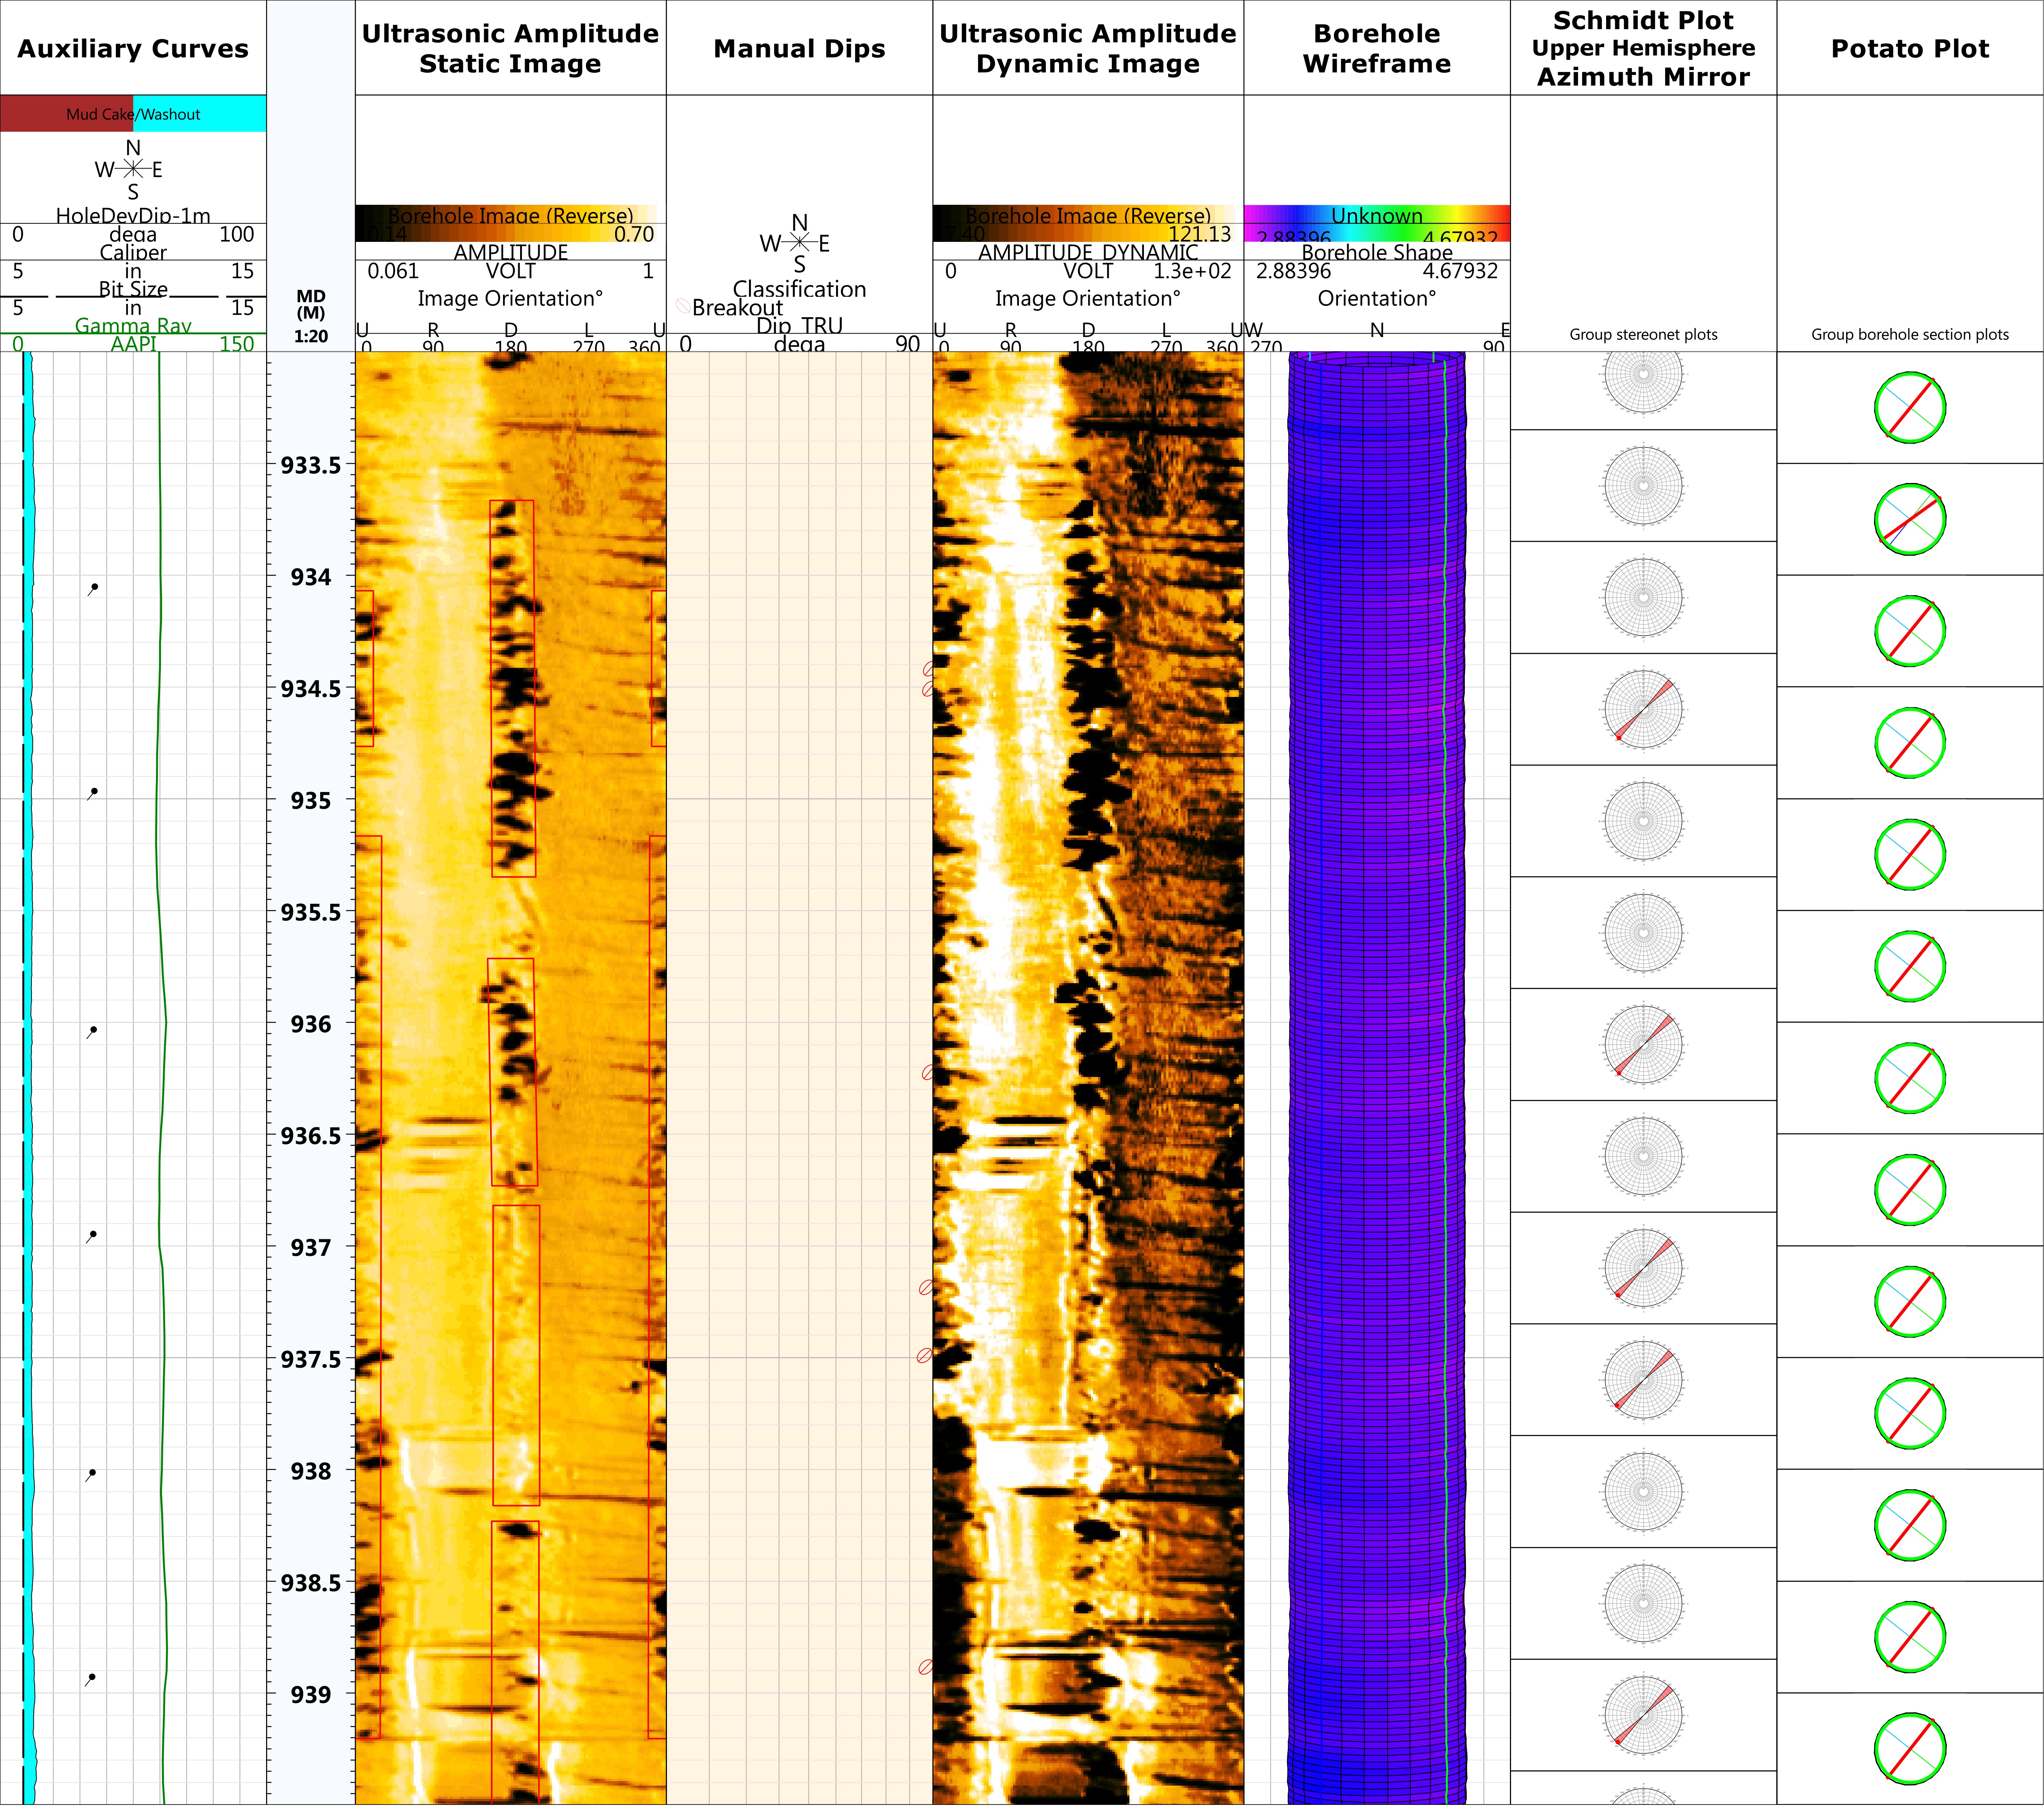
The ultrasonic amplitude image has helped in identification of the most stratigraphic, structural and tectonic stress orientation features. Travel time measurements were oriented to create a truth borehole shape. Breakout direction was determined with the help of the potato plot and confirmed the direction of those determined on the amplitude image. In-situ tectonic stress direction elements, drillinginduced fractures and tensile zones have been identified alongside breakouts, the first two indicating maximum tectonic stress direction.
Method and theory
A high-frequency ultrasonic transducer acts as a transmitter and receiver to provide measurements of travel time and amplitude. In this way, the ultrasonic transducer provides borehole images across 128 sectors using travel time measurements and 128 sectors’ formation images using amplitude measurements, with a 360-degree borehole coverage.
The sound pulse generated by the transducer travels through the mud to the borehole wall where it is reflected and travels back to the transducer. The travel time is the time it takes to make this journey and is used to provide the caliper measurement. The standoff between the tool and borehole wall is calculated as mud velocity multiplied by arrival time of the first reflection from the borehole wall divided by two.
The second measurement is the detection of formation features (beddings and fractures) and borehole breakouts from the change in signal amplitude. The amplitude of the reflected wave is a function of the acoustic impedance of the medium, which is defined as the velocity times the density of the medium. The higher the impedance of the medium, the higher the amplitude and vice versa. The presence of a fluid gap (vugs or fracture) causes the amplitude to decrease due to the lower acoustic impedance of the fluid compared to the rock. The relative change in amplitude is proportional to the width of the fluid gap.
The travel time and amplitude measurements of the ultrasonic waves are a function of several factors such as mud slowness, standoff and acoustic impedance variations.
Case study
The analyzed well is situated in the northern Weald Basin in Surey, southern England. The 57⁄8-in. sidetrack well started from a maximum inclination of 69 degrees and dropped to 2 degrees, drilled with oil-based mud. The 4¾ in. LWD high-resolution ultrasonic imaging tool recorded the data in a stored memory while reaming the well without affecting the rig activity as powered by batteries thus independent from mud flow.
The interpretation of ultrasonic amplitude and travel time images from memory has led to the accurate identification of stratigraphic, structural and in-situ tectonic stress indicator features. Bedding, crossbedding disconformities, natural fractures, vugs, breakouts, induced fractures and tensile zones have been identified and classified. Most of the picked features have been identified on the amplitude image, and some of them were confirmed by travel time measurements. Borehole breakouts, drilling-induced fractures and tensile zones were identified as in-situ tectonic stress indicators. Borehole breakouts (Figure 1) could be distinguished on the amplitude image as low acousticamplitude zones developed 180 degrees apart around the borehole wall. Also, the oriented potato plot derived from travel time measurements may offer indications related to borehole ovalization. In this way, breakouts are determined from two different methods that confirm each other.
Drilling-induced fractures (Figure 2), developed 180 degrees apart around the borehole and 90 degrees from breakouts, are created when the stress concentrated around the borehole exceeded that required to cause tensile failure of the wellbore wall. They represent a typical maximum stress direction indicator. Drilling-enhanced fractures, which are pre-existing natural fractures that reopen or its apertures are enhanced because of drilling, in-situ imbalance or thermal contraction, have the same orientation as drilling-induced fractures and confirm the maximum stress direction.

Conclusion
Borehole instability phenomena become even more critical in the current economic environment because of the need to mitigate all nonproductive time factors to deliver optimized wells with respect to costs.
The new LWD ultrasonic imaging represents a powerful instrument for detection of wellbore stability parameters both in water- and oil-based mud in hole sizes ranging from 57⁄8-in to 8¾-in. In-situ tectonic stress elements were both detected on amplitude image and deduced from borehole ovality analysis. The determination of borehole breakouts as magnitude and orientation contributes to the validation or adjustment of the geomechanical predrill model and the selection of the optimal parameters for the drilling mud. As a result of the borehole shape analysis, two key seat zones were identified generated by large dogleg values. These observations helped drillers to understand the borehole conditions to avoid issues during the casing job.
Recommended Reading

Reactive Downhole Tools Appoints COO, CTO
2024-02-14 - Reactive Downhole Tools is also developing a new R&D test center in Abu Dhabi.

SunPower Begins Search for New CEO
2024-02-27 - Former CEO Peter Faricy departed SunPower Corp. on Feb. 26, according to the company.

First Solar’s 14 GW of Operational Capacity to Support 30,000 Jobs by 2026
2024-02-26 - First Solar commissioned a study to analyze the economic impact of its vertically integrated solar manufacturing value chain.

Daniel Berenbaum Joins Bloom Energy as CFO
2024-04-17 - Berenbaum succeeds CFO Greg Cameron, who is staying with Bloom until mid-May to facilitate the transition.

GE Vernova Completes Spin-Off from GE
2024-04-04 - GE Vernova, an energy transition company, began trading as an independent company on the New York Stock Exchange this week.