
In this project in Ecuador, one operator saw the benefits of integrating a complete equipment and technology package across their completion operations, according to Gyrodata. (Source: Shutterstock.com)
Albert Einstein once famously declared that “Intellectuals solve problems, geniuses prevent them.” This philosophy has become increasingly important to the oil and gas industry as business models, economics and technology have all rapidly evolved in the past decade. Because drilling and producing wells is a complicated endeavor, the potential for problems will always exist. However, as the industry has moved forward, the need to address challenges has given way to a need to prevent them from happening in the first place. This has been compounded by slowing investment in the sector necessitating better, more efficient solutions as E&P companies have pulled back on capital spending.
In a recent project, an operator in Ecuador worked with Gyrodata to optimize their completions operations, integrating an equipment, technology and service package take accurate wellbore surveys, drill more precise wells, conduct more effective formation evaluation and improve their overall production.
Technology
The operator used a suite of technologies on the completion portion of the project to better understand the wells’ complex reservoir situation and develop an optimized placement for their production equipment designed to improve hydrocarbon recovery. The GeoGuide cement bond log (CBL) is a radial CBL that provided the operator with a complete, 360-degree depiction of the cement-to-casing and cement-to-formation bond integrity. The system uses traditional dual receiver logs, including 3-ft amplitude CBL and 5-ft variable density logs, as well as a segmented radial receiver array that generates a detailed cement quality map. The system was run in real-time mode via e-line, and its adjustable data sampling rates maximized data acquisition for high-resolution logs.
The GeoGuide system was combined with MicroGuide, a high-density wellbore tortuosity logging system designed to optimize production equipment placement. The software receives data from the survey stations in the wellbore survey, with the survey data in this project obtained from the MWD equipment. The software then defines reference lines for the wellbore path based on the received survey data and determines displacements of the wellbore path from the reference lines. This information forms the foundation for calculations that yield a 3D wellbore representation, which changes and evolves as the system is run in hole and the data is sent to surface. The operator chose this tortuosity logging software to help understand wellbore tortuosity and how it affected both drilling and production. Due to the limitations of conventional equipment, the clarity and detail that the operator wanted to obtain would not have been possible without this technology.
Additionally, several perforating technologies were incorporated during completions. Propellants were lowered together with stimulation guns sourced from a third-party to make microfractures, improving the formation response and allowing well perforation and perforation breakdown. High-performance charges enabled the operator to stimulate each formation before executing the perforation job to achieve the best possible combination of charges, propellant and underbalanced valves. Using dynamic underbalance chambers enabled prediction of dynamic pressure and fluid flow while modeling the effects of pressure transients. By understanding this information, the operator was able to reduce the damage to the formation by the guns and improve production. The dynamic underbalance perforating technique also optimized wellbore cleanup, especially with previous perforations. Lowering the underbalanced valves with empty chambers in front of the perforations and generating a surge effect helped dramatically improve the quality of the cleanup operation while minimizing the risk of sanding up the perforating guns.
Case study
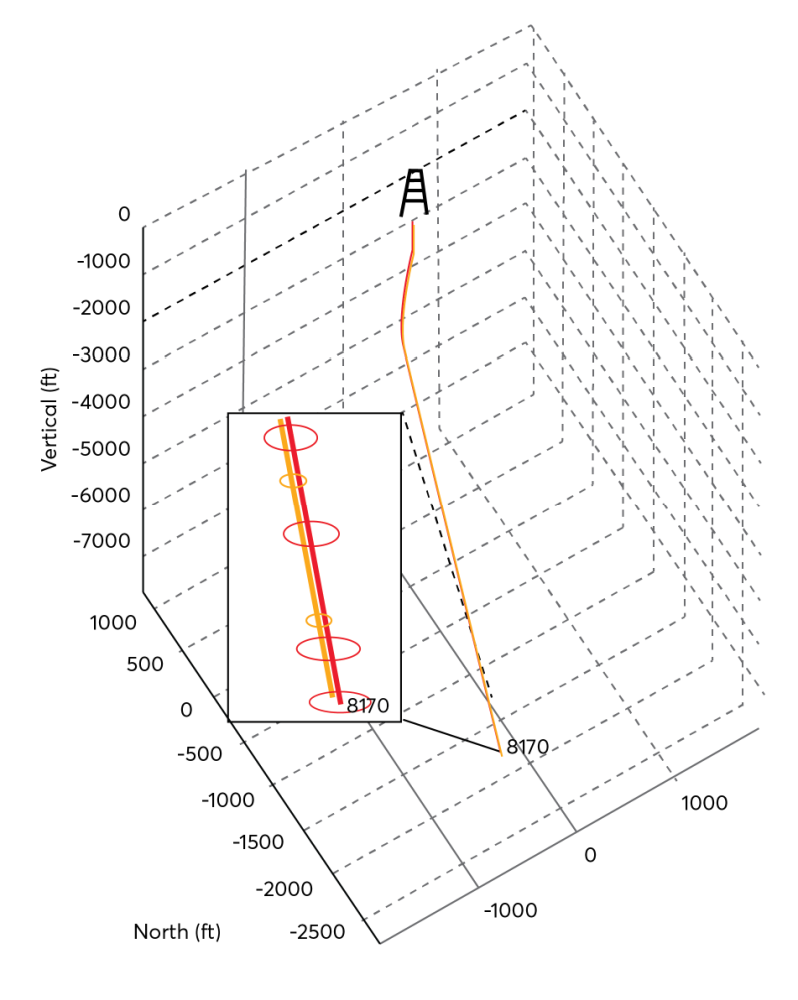
The survey, completed with both the MWD tool and a continuous all-attitude (CAAT) gyro in memory mode, was considered definitive based on its high accuracy. As shown in Fig. 1, the ellipse of uncertainty (EOU) when running the combined MWD and CAAT gyro configuration was reduced by 86.9% versus just running an MWD tool, reaffirming the more accurate and precise placement of the wellbore.
The completions portion of the project saw Gyrodata provide three primary services to the operator: logging, energetics (perforation) and production evaluation. Of particular interest was better understanding the quality of the cement and whether or not it was adhering properly to the casing and formation. Running the GeoGuide system allowed the operator to obtain the information necessary, via the CBL, that proved the effectiveness of the cement job. The operator also needed to know the status or integrity of the 7-in. and 9⅝-in. casing, with Gyrodata providing its casing integrity service with a multi-finger caliper and magnetic thickness detector tool. This allowed the operator to register the entire well by evaluating the two casings in one run while maintaining the quality of the data.
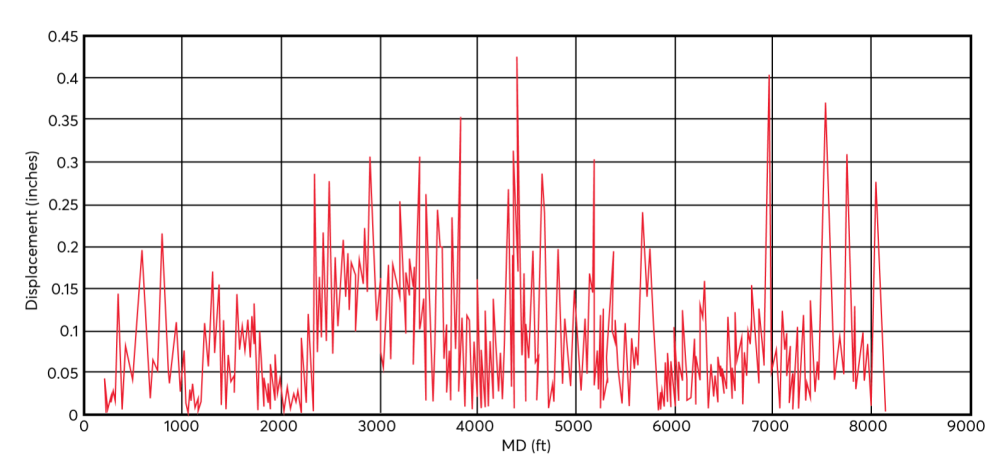
Optimal placement of the electrical submersible pumps (ESPs) to maximize production was also critical. Gyrodata ran the MicroGuide tortuosity system on a single gyro run in combination with the radial CBL tool to obtain a high-resolution survey of the wellbore, enabling 3D visualization of the wellbore’s trajectory as well as areas of tortuosity and microdoglegs in the well that could be negatively impacting production. The system performed a simulation to evaluate the depths suggested by the operator for the lower ESP and upper ESP, which were 7,445 ft and 7,207 ft, respectively. Both pumps had a maximum OD of 4.56 in., while the lower pump would be placed within the 9⅝-in. casing with an ID of 8.681 in. The goal was to determine if the ESPs could be positioned there without exceeding the maximum deformation recommended by the original equipment manufacturer (OEM) of 1 degree/100 ft.
In both cases, the equipment would remain straight, with no deflection or bending. At both depths suggested by the operator, the MicroGuide logs proved that the ESPs would not be subjected to uniform deflections at or above the suggested OEM tolerance level, validating the pumps’ positioning (Fig. 2). However, the logs noted areas of high tortuosity that could cause strain and damage to the ESPs when placing them downhole, which meant special care needed to be taken when passing through those areas. The areas of high tortuosity were from 2,877 ft to 2,935 ft, 4,388 ft to 4,437 ft, 4,659 ft to 4,677 ft, and 6,919 ft to 6,997 ft. Gyrodata recommended performing a depth correlation of the ESPs once they were successfully placed at the theoretical depths to ensure that the equipment was correctly positioned precisely within the zones with extremely low tortuosity. The combined tortuosity logging and radial CBL solution saved the operator approximately 8 hours per run, while using the new energetics and completion techniques that Gyrodata provided and confirming optimal ESP placement improved production and kept the pumps working with no issues since their installation.
Conclusion
By more effectively drilling and placing a highly accurate wellbore, completion and production processes are simplified. In this project in Ecuador, one operator saw the benefits of integrating a complete equipment and technology package across their completion operations. Having an operator that was willing and open-minded about new technology implementation was also key to making this accomplishment possible, as was the dedicated personnel of the operator in working with the service company to align objectives and successfully perform the work in the field.
Recommended Reading

BP Restructures, Reduces Executive Team to 10
2024-04-18 - BP said the organizational changes will reduce duplication and reporting line complexity.
Matador Resources Announces Quarterly Cash Dividend
2024-04-18 - Matador Resources’ dividend is payable on June 7 to shareholders of record by May 17.
EQT Declares Quarterly Dividend
2024-04-18 - EQT Corp.’s dividend is payable June 1 to shareholders of record by May 8.

Daniel Berenbaum Joins Bloom Energy as CFO
2024-04-17 - Berenbaum succeeds CFO Greg Cameron, who is staying with Bloom until mid-May to facilitate the transition.
Equinor Releases Overview of Share Buyback Program
2024-04-17 - Equinor said the maximum shares to be repurchased is 16.8 million, of which up to 7.4 million shares can be acquired until May 15 and up to 9.4 million shares until Jan. 15, 2025 — the program’s end date.