Weekly oil, gas rig count increases
U.S. energy firms added oil and natural gas rigs for the first time since March, according to Enverus, as some shale producers reverse production cuts with oil prices recovering from a slump in fuel demand amid coronavirus lockdowns.
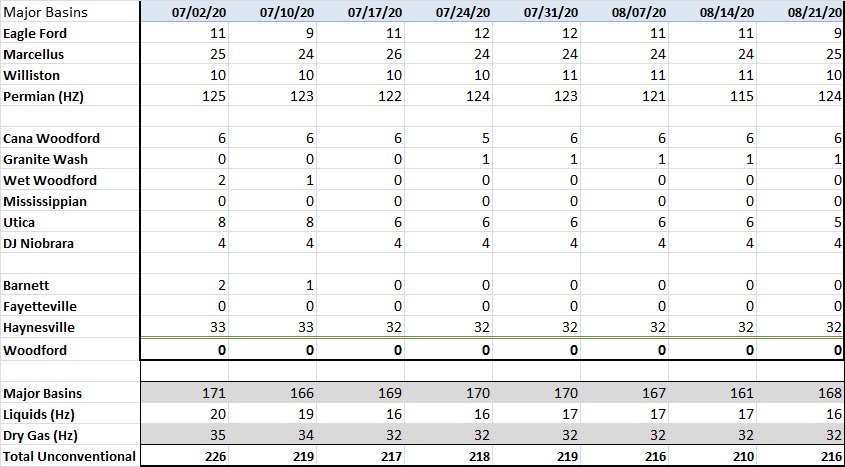
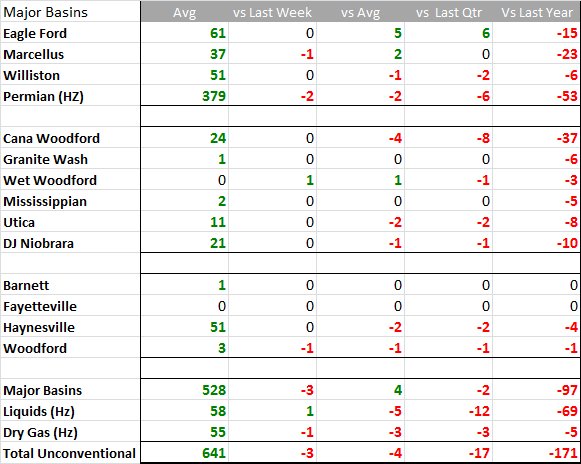
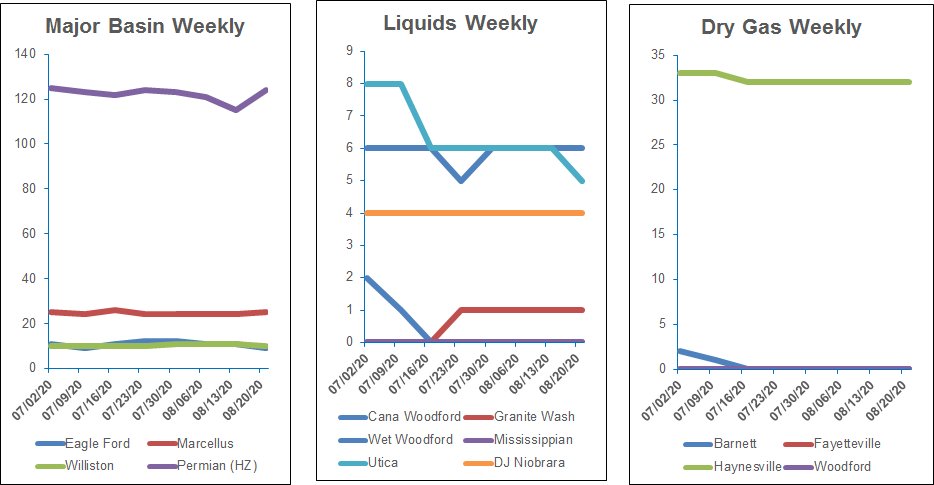
The weekly increase in oil and gas rigs was the biggest gain since January. U.S. oil rigs rose 11 to 183 this week, also their biggest rise since January. Gas rigs fell by one to 69, just one short of its record low.
The Permian Basin, Rockies, West Coast and Gulf of Mexico added two rigs each. Making the largest percentage and absolute gains was the Midcontinent region, which is up six.
The Midcontinent increase was 100% because operators who were not running any rigs on July 5 added one rig each. Continental Resources Inc. remains the most active operator in the region, running three rigs, followed by Citizen Energy and Ovintiv Inc. at two each.
In the Permian Basin, Exxon Mobil Corp.’s rig count is down 23% since July 5, but the company remains the most active operator in the region at 20 rigs. The second most active operator is Devon Energy at nine rigs. There were no other notable increases or decreases in the Permian during the period.
Even though U.S. crude prices have increased by about 120% from April record lows, WTI is still down about 32% since the start of the year and have been largely range-bound since mid-June at between $37/bbl and $43/bbl. On Aug. 21, it was trading around $42/bbl on hopes global economies and energy demand will snap back as governments lift lockdowns.
Analysts said higher oil prices will encourage energy firms to slow rig count reductions and start adding units later this year.
U.S. financial services firm Cowen & Co. said the 45 independent E&P companies it tracks plan to slash spending by about 47% in 2020 versus 2019. That follows a capex reduction of roughly 9% in 2019 and an increase of around 23% in 2018.
Cowen also said that some E&Ps issued early estimates for 2021 that so far point to 8% drop in spending next year versus 2020.
Trends
Recommended Reading

Green Swan Seeks US Financing for Global Decarbonization Projects
2024-02-21 - Green Swan, an investment platform seeking to provide capital to countries signed on to the Paris Agreement, is courting U.S. investors to fund decarbonization projects in countries including Iran and Venezuela, its executives told Hart Energy.

Humble Midstream II, Quantum Capital Form Partnership for Infrastructure Projects
2024-01-30 - Humble Midstream II Partners and Quantum Capital Group’s partnership will promote a focus on energy transition infrastructure.
Air Products Sees $15B Hydrogen, Energy Transition Project Backlog
2024-02-07 - Pennsylvania-headquartered Air Products has eight hydrogen projects underway and is targeting an IRR of more than 10%.

First Solar’s 14 GW of Operational Capacity to Support 30,000 Jobs by 2026
2024-02-26 - First Solar commissioned a study to analyze the economic impact of its vertically integrated solar manufacturing value chain.
TechnipFMC Eyes $30B in Subsea Orders by 2025
2024-02-23 - TechnipFMC is capitalizing on an industry shift in spending to offshore projects from land projects.