This story will appear in the upcoming Hydraulic Fracturing special report presented by:
![]()
There’s a lot riding on getting a hydraulic fracture right, but gauging frac efficacy in horizontal wellbores is becoming easier.
In the early years of the shale revolution, operators had little visibility in what was going on in their unconventional wellbores. They had to rely on inexact, time-intensive or costly approaches to see how their fracs were performing.
But over the years, technologies have improved while decreasing in cost. As a result, technologies such as fiber optics can better inform operators on how fracs in horizontal wells are performing, and new software can help inform an operator about the distance and direction the fractures traveled. Fracturing a well is all about increasing the permeability in a rock to provide a pathway for fluids and gas to move from the rock into the wellbore.
“An important question to ask is, ‘What is the efficacy of my frac?’” said Brian Fuller, Sterling Seismic’s vice president of reservoir geoscience. “You put $100,000 to $200,000 per frac stage into a well, maybe do 30 to 40 frac stages in a well, before long it adds up.”
“If at one time a well produces from one location but another part of the well never sees production, then there is potential to profitably refract that non-productive area. We know there may be virgin production we’ve never even touched there.”—Brian Fuller, Vice President of Reservoir Geosciences, Sterling Seismic
One of the ways engineers analyze the efficacy of a frac is to see how much oil and gas is coming out of a reservoir that can be attributed to a specific frac stage.
“It’s an inexact science,” he said. “It’s hard to see how much fluid is coming from a specific frac stage. You may have five to 10 perfs in a frac stage but not know exactly how much fluid is coming out of an individual perforation or group of perforations.”
The microseismic method uses seismometers or fiber optic sensing to detect microearthquakes associated with fluid pumped into the borehole and reservoir. The microseismic events may indicate how far fluids and proppants are going out into the reservoir. Using microseismic, the question of whether the sand is propping open the fracture remains unclear, however, Fuller said.
“Not every microseismic event is a place where proppant has gone into the reservoir,” he said, but it “offers clues” about how far from the wellbore the sand may have traveled.
A third method, coring, involves placing colored proppant downhole in different frac stages and seeing where different colored sand ends up after the post-frac core is extracted from the reservoir. While expensive, it makes it possible to “really put your finger on how many fractures were generated,” Fuller said. At the same time, coring doesn’t shed as much light on the full dimensions of fractures, he said.
It is important not just to know fracture length and height, but also how wide they are. And those fracture widths can change over time, Fuller said.
Another way to gauge frac efficacy has been trial and error, said Delaney Leigh, senior product champion for production enhancement at Halliburton Co. Operators evaluated fracture efficacy in the unconventional market with “the best information available,” she said.
But waiting on production to see which frac designs are more productive means a long learning curve. “They could have 100 wells before they understand the impact of the design,” she said.
On top of that, uncontrolled variables such as rock properties, parent-child well relationships and inconsistencies on how jobs are executed also come into play, she said.
“In most cases, when comparing fracture designs, operators are considering if a stage was successfully done or not based on what they’re seeing at the surface,” Leigh said. “There is little visibility into what’s going on downhole.”
But intelligent fracturing can help change that. Integrating subsurface insights, automation and machine learning gives real-time visibility and control over fracture outcomes, she added.
One way to gain visibility downhole is through distributed acoustic sensing (DAS), which uses fiber to provide direct measurements of downhole conditions up to the surface.
An instrumental approach
Instrumenting wells with diagnostics and real-time analytics can solve for subsurface uncertainty and accelerate the learning curve, Leigh said.
“When operators can see and control what’s going on in real time, they can make better choices that affect the entire cost of ownership.”—Delaney Leigh, Senior Product Champion, Production Enhancement, Halliburton Co.
In the past, fiber optics have been cost-prohibitive and operationally complex. Successfully placing fragile glass into a wellbore was not something that could be done on a broad scale in the past, Leigh said.
“That’s changing, and it’s changing pretty quickly,” she said.
The cables going into the ground now are a scalable solution at a fraction of the cost compared to three years ago, she said.
Halliburton has invested a lot of R&D effort and money into making fiber optics a scalable technology for routine downhole use. Part of that effort has focused on making sure the fiber optics are easier to install. The installation planning and preparation time has decreased from months to weeks, she said.
“We’re optimizing the cable design to survive the operation it’s designed for,” she said.
Now, she said, the cost is less than half of what it once cost to be run in a horizontal well, and it can be done in less time as well.
Halliburton’s solution uses mapping sensors to locate the position of the fiber optic cable in the well to eliminate an additional wireline mapping run. Leigh said these sensors ensure perforating guns can orient away from the fiber cable.
The fiber optics monitoring has “come a long way,” and more operators use the technology as part of their routine completion approach, she said.
“The future is bright. They use downhole sensors to understand how fracs are performing,” Leigh added. “Having DAS and (distributed temperature sensing) DTS information gives you a direct subsurface measurement of where your frac fluid is going in the well.”
But having that knowledge is only part of the equation. The other part is how quickly the operator acts on that feedback, she said.
Halliburton has integrated measurements and automation to react to fracture behavior in real time, she said, adding that the real prize is the ability “to respond to what’s going on in real-time downhole on location while pumping.”
The combination has allowed operators to reduce the learning curve from months to minutes, which makes “better fracs on every pad by knowing what’s happening in real time and acting on it,” Leigh said.
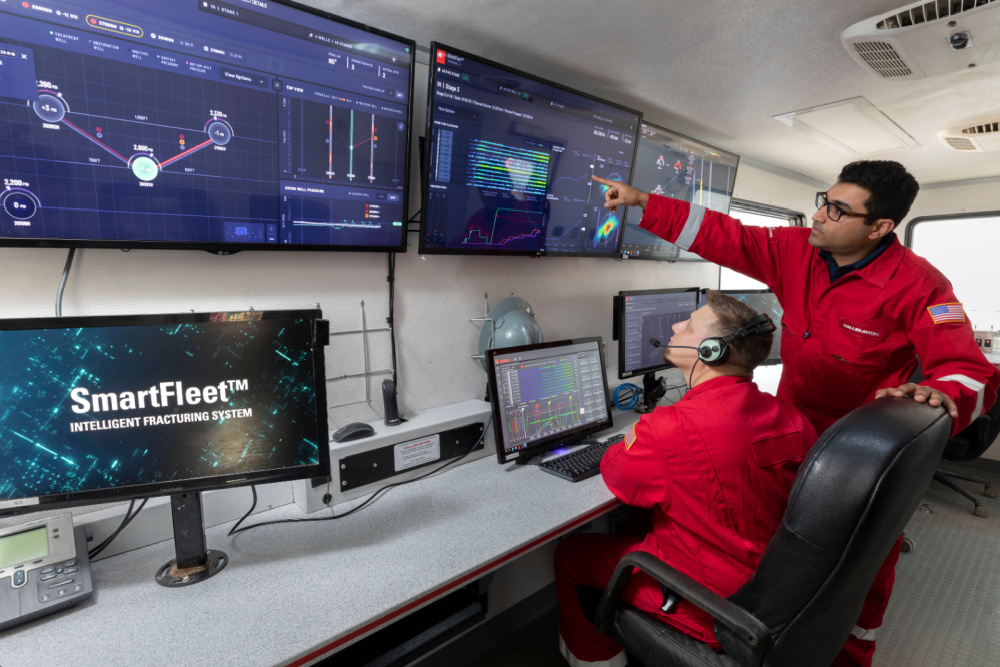
Halliburton’s SmartFleet intelligent fracturing system, commercialized in 2021, uses intelligent automation that relies on the improved fiber optics and real-time analytics to help operators see and control the efficacy of their fracs.
The result, she added, is better fluid distribution across the entire lateral as well as improved well economics. According to Halliburton, SmartFleet operations have improved the uniformity of fluid distribution across perforation clusters by 20% on average while also enabling operators to remove redundancy in completion costs. This reduces their average completion cost by 15%, the service company said.
In one Permian Basin deployment, an operator wanted to reduce fluid usage and screenouts. SmartFleet reduced the volume of fluid pumped from 70 bbl/ft to 60 bbl/ft for a total of 110,000 bbls less water per well and 20 hours less pump time, while reducing screenouts by 50%, according to Halliburton.
In another Permian deployment, the operator wanted to increase stage length to reduce interventions, time and cost. Using SmartFleet increased stage length by 80% and resulted in 50 hours less on location. It also increased fluid distribution across clusters by 30%, according to the service company.
“When operators can see and control what’s going on in real time, they can make better choices that affect the entire cost of ownership,” Leigh said. “In a perfect world, we would have distributed sensors in every well, strapped to every string of casing that goes downhole.”
Changes over time
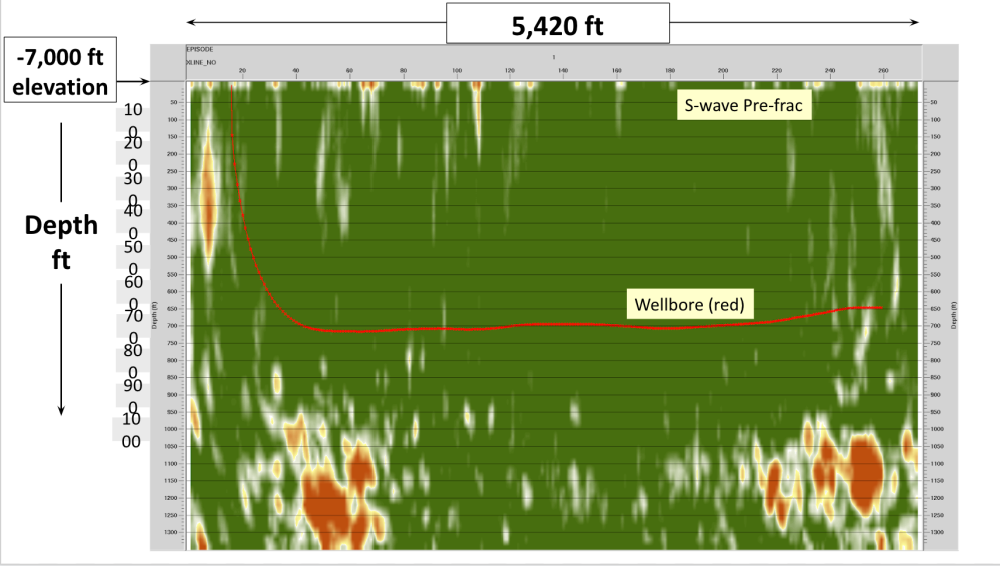
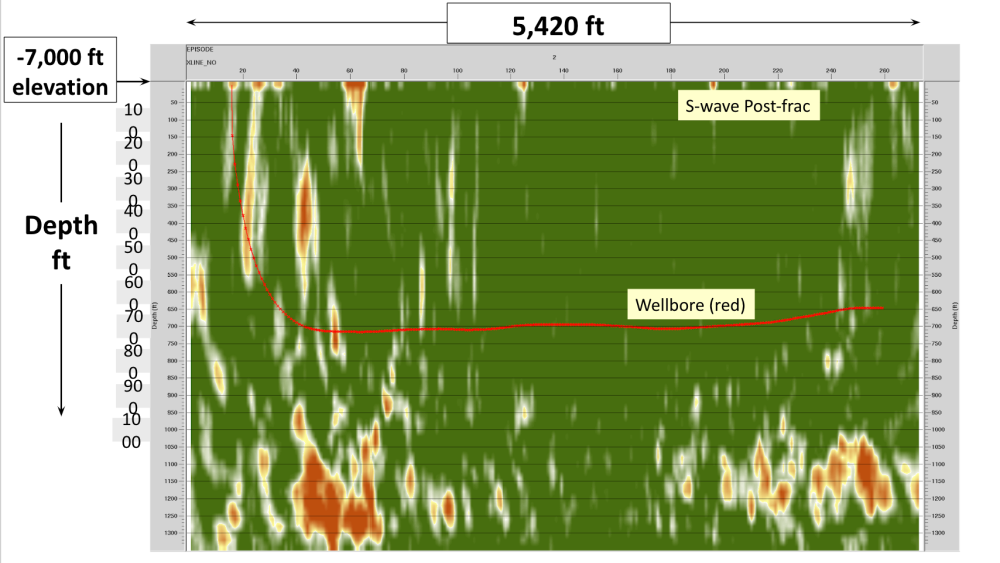
DAS data is critical to Sterling Seismic’s approach to evaluating frac efficacy. The company uses artificial intelligence (AI) assisted data processing technology based on the diffraction and reflection of seismic waves to generate seismic images around the wellbore. The resulting images can be combined with rock mechanics analysis to measure changes over time in reservoir characteristics like pore pressure, rock stress, stress direction and fracture density.
By processing wave diffraction data before and after a frac job, Fuller said, it’s possible to get a time lapse view of the number, location and size of fractures. Time lapse DAS reflection data and rock mechanics can also be used to estimate production-induced pressure drawdown.
The AI technology can then analyze that data to locate “where most of your fracture energy is,” Fuller said.
As such, it can also show a lack of events to identify potential targets for later refracs. The same approach can also be used throughout the life of the field, he said.
That time lapse approach can provide additional information, such as where fluid is entering the borehole and where in the reservoir it is coming from, he said. It’s possible that it can also answer crucial questions such as fracture width, he said.
“Is it a millimeter or 100 millimeter? We’re getting there,” Fuller said.
In terms of the methodology’s accuracy, there’s not a perfect overlay of P wave and S wave over compressional and shear wave diffraction images, he said.
“The real world’s not that simple,” Fuller said. “There are a lot of places where they overlay nicely, and some places where I see one and not the other.”
Further, he said, “I don’t have direct evidence that what I’m seeing is a wide fracture versus a thin fracture, but according to modeling, we should be able to see the amount of energy that comes from a diffractor is a function of the type of wave and the width.”
Sterling has been working with fiber optics company Ziebel.
“Ziebel does a lot of passive listening for reservoir gurgling,” Fuller said. “Where there’s a lot of gurgling or low-amplitude seismic signals, it is assumed that fluids are entering the borehole.”
And as long as there is fiber in the borehole and a seismic source at the surface, Sterling can apply the AI-based technology.
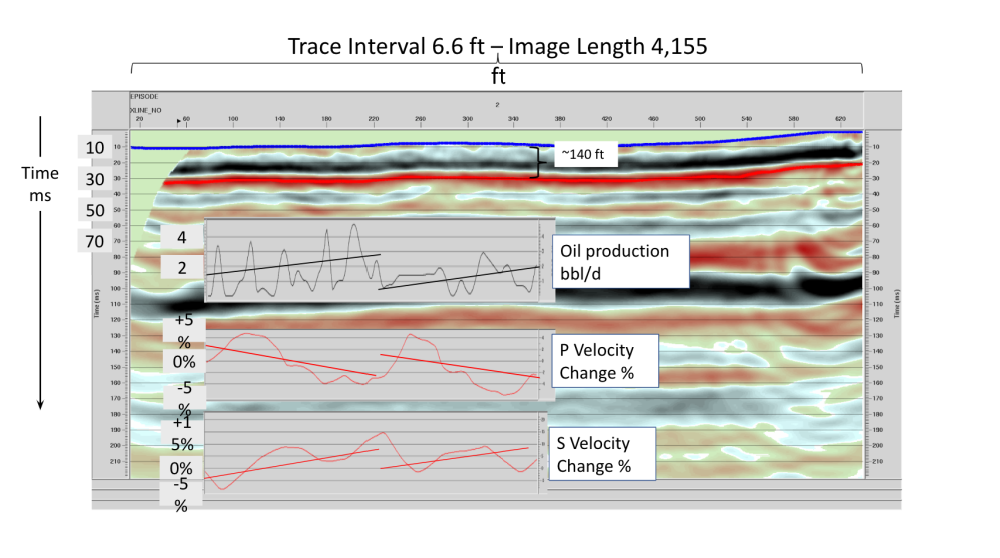
Because reservoirs change over time, Fuller said, this type of assessment can provide operators a lot of value.
“Fractures open and they close,” he said. “If there’s pressure drawdown in one area of the reservoir, then stress is reduced elsewhere.”
Fractures may have been closed in a high-stress area but the fractures can open in response to the reduced stress, he added. As such, it could lead to production in other areas.
“These reservoirs change over time, and where fluids are coming into borehole changes through time,” Fuller said. Repeating the assessment of a wellbore over time helps show where those changes are happening.
“If at one time a well produces from one location but another part of the well never sees production, then there is potential to profitably refract that non-productive area,” he said. “We know there may be virgin production we’ve never even touched there.”
Sterling has applied this technology to fields in the mid-continent basins, so the next step is to commercialize it.
“It’s clear we have something here,” Fuller said. “We want to learn more, get more people and companies involved in it.”

Recommended Reading
Shipping Traffic Freezes Up in Port Waters After Baltimore Bridge Collapse
2024-03-26 - U.S. port of Baltimore traffic was suspended until further notice following a bridge collapse. At least 13 vessels expected to load coal were anchored near the port at the time of the incident.
Exclusive: Chevron Balancing Low Carbon Intensity, Global Oil, Gas Needs
2024-03-28 - Colin Parfitt, president of midstream at Chevron, discusses how the company continues to grow its traditional oil and gas business while focusing on growing its new energies production, in this Hart Energy Exclusive interview.
Imperial Expects TMX to Tighten Differentials, Raise Heavy Crude Prices
2024-02-06 - Imperial Oil expects the completion of the Trans Mountain Pipeline expansion to tighten WCS and WTI light and heavy oil differentials and boost its access to more lucrative markets in 2024.

Carlson: $17B Chesapeake, Southwestern Merger Leaves Midstream Hanging
2024-02-09 - East Daley Analytics expects the $17 billion Chesapeake and Southwestern merger to shift the risk and reward outlook for several midstream services providers.

Midstream Builds in a Bearish Market
2024-03-11 - Midstream companies are sticking to long term plans for an expanded customer base, despite low gas prices, high storage levels and an uncertain political LNG future.