The industry requires long-term natural gas forecasts to support new growth projects such as gas-fired power plants, new long-haul gas pipelines, proposed North America LNG export liquefiers and new industrial facilities. Although project proponents may undertake this type of analysis, investors underpinning these projects cherish a logical due diligence assessment to help instill an unbiased view.
A key conclusion of a long-term forecast may be something simple, such as a projection of gas demand to be up 44% by 2050. However, in order to undertake long-range forecasting in the natural gas industry and arrive at this strong growth, HSB Solomon Associates LLC (Solomon) draws upon a combination of specialized professional opinions, based on deep, real-life work experience.
Over the past several decades, its professional gas consulting team has internally designed 29 integrated computer models to underpin a significant number of separate natural gas forecast calculations. For example, the Solomon gas models forecast gas demand by sector, by year, by Canadian province and/or U.S. state, to the year 2065.
Coupled with ongoing tangible industry consulting assignments for numerous successful companies, this allows staff to establish long-term forecasts for a wide array of clients. Forecasting in the natural gas industry requires an outlook period to be specified, whether the outlook period is next week, next year, next decade or next century. Certain factors are considered as assumptions for use within the gas demand, gas supply and gas price forecasting models.
Long-term gas demand
By subdividing the key term “gas demand” into distinct categories, very specific assumptions can be defined and incorporated into the unique long-term gas forecasts.
For example, gas demand sectors include traditional sectors such as residential (homes), commercial (office buildings, schools, hospitals and malls) and industrial operations—fertilizer plants, pulp and paper plants, oil refineries, gas for the Alberta, Canada, oil sands and mines and gas for gas-fired power generation facilities. In addition, gas demand includes gas for nontraditional sectors such as natural gas for private or commercial automobiles or fleets of vehicles, gas for boat engines and stationary engines on drilling rigs, gas demand for fuel for large gas-driven compressors to transport natural gas and emerging gas demand for liquefied gas to other countries. In each sector, the gas models determine the number of consumers and the consumption by consumers by year.
The detailed assumptions vary significantly by province and state.
By defining customer growth rates and ongoing efficiency rates for electrical power generation by province and state along with alternative fuel options (e.g., coal, hydro, or wind for power plants), a year-by-year forecast for gas demand for the power sector can be identified. Establishing macro external assumptions such as GDP, policy shift for fuel type and power plant retirements assists with longer-term growth forecasting.
Beginning in 2016, North America gas demand will be 87 billion cubic feet per day (Bcf/d) and the 29 integrated models show the gas demand growing to 125 Bcf/d by 2050. That suggests a slow, though steady and continuous overall growth of 1.1% per year that, when summed over the duration of the forecast, results in an impressive gas demand growth of 38 Bcf/d by 2050. This incremental gas will be used in gas-fired power plants, some gas will be exported to other countries and some will be used in residential and commercial sectors.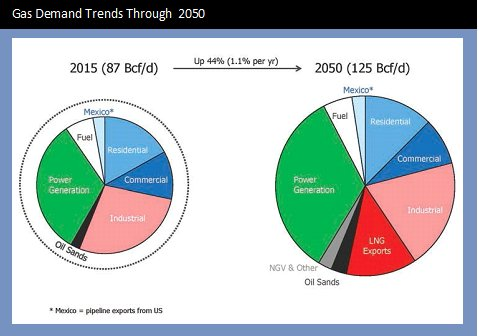
The adjoining pie charts contrast current gas demand by sector to the Solomon long-term gas demand outlook to the year 2050. While gas demand is summarized in seven specific sectors, the largest sector is gas for power generation.
Historically, the power generation sector has relied on large coal plants. As these plants are retired and the industry pushes for ever-increasing levels of efficiency, the power generation sector will rely more and more heavily on natural gas, which is projected to represent more than 40 Bcf/d by 2050, which will be 50% greater than those beginning in 2016.
Supply forecasting
Prior to the growth in unconventional, horizontal gas wells and multistage fracturing technology starting in the mid-1990s, gas demand and the associated gas demand growth within North America was limited to available gas supply. Any shortage of gas supply at that time would have to be imported as LNG. Now, the opposite is true: gas supply is available to meet most North American gas demand needs for decades to come.
Note that new natural gas wells with multiple fractures and many horizontal legs are equivalent to 10 to 25 previously established gas wells. These super wells are better for the environment too, as only one well footprint is made vs. one to two dozen. Consequently, natural gas producers prefer to ramp up gas production from their lowest full-cycle cost North American gas production basins or generate a gas supply that needs to be produced based on certain joint ventures or production agreement commitments.
The detailed full-cycle cost analysis parameter is a distinguishing added-value feature of Solomon, which then allows the preparation of key fundamental drivers such as a gas well and drilling rig forecast by year for each of the North American gas basins. The next step in the outlook process requires a forecast by year, by gas basin of initial new gas well productivity and gas well decline rates, so that the amount of new supply can be added to the existing declining supply to arrive at a forecast for the full duration.
There are a few other items that need to be considered to complete the gas supply forecast. For example, a similar process is used to assess natural gas extracted from growing oil production. An assessment is made to determine if any gas supply is imported as LNG or if any gas supply is imported or exported via Mexico.
The forecast gas supply may be calculated as raw gas at the wellhead or it can be adjusted to reflect the removal of certain gaseous compounds such as H2S, CO2, propane, butane and condensates extracted via gas processing.
It is important to understand that raw gas is produced—though it is dry gas that is consumed. Thus, when preparing supply and demand balances, the type of gas on each side of the equation must be consistent.
Further, the types of forecast gas supply can be subdivided into the various types of natural gas such as shale gas, tight gas, associated gas, conventional gas, coal bed methane and conventional gas. As a cross-check, the total gas supply to be produced over the duration of the forecast is compared to the gas resource estimate in the ground.
The accompanying chart provides an illustration of the outlook for gas supply by type of gas to 2050 with a comparison to 2015. Note that almost 90% of 2050 gas supply portfolio will be shale and tight gas supply.
Accordingly for some, the knowledge obtained over the past decades will become history and a new understanding of shale and tight gas will be a requirement for industry staff. The growth of gas supply by 2050 is directly attributed to the growth in gas demand and that gas supply is produced in terms of the lowest cost structure.
Returning to the first conclusion, we observe that the 44% growth of gas supply is the same growth as gas demand. Thus growth of gas supply requires a growth of gas demand.
Price forecasting
Gas price determination is the result of various intertwining influences acting upon the gas supply and gas demand forecast, along with external factors such as regulatory policy. By assessing the impact that each notable gas supply and gas demand factor exerts on gas price, an estimate of whether that factor increases gas price or decreases gas price, along with the magnitude of the influence, can be made.
The Solomon long-term gas price forecast ignores short-term, same-season influences as the long-term view assumes normal conditions in the future. For example, colder-than-normal weather can drive gas demand higher in some demand sectors, such as residential or commercial, though long-term gas demand models assume normal temperatures in the future years.
Similarly, short-term adjustments to gas storage levels exert no long-term influence to future gas prices as long-term storage levels are assumed to be normal. Consequently, while a long-term gas price forecast can be skewed by short-term influences in the current or second year of a forecast, that change does not diminish the value of the long-term price forecast, which is underpinned by expected natural gas fundamentals over several decades.
A commonly disclosed gas price index is the Nymex posted price, which in simplistic terms is a collection of actual trades that occur for specific transactions over short durations. The prices are indeed factual as the prices do represent the actual trades, though the future gas price values may not reflect the actual prices in the future.
Gas trades may be posted for various durations ranging from the same day, to a month, to over a year. Typically, the amount of gas supply posted diminishes with time, thus caution and experience are required when using the Nymex gas price outlook as a basis for long-term price forecasts.
Many industry sectors exhibit product prices that vary between regions. For example, an orange in the southern U.S. fruit zone may be available at a lower cost than in remote northern Canada, primarily because of the cost to transport that orange to the designated market. Similarly, natural gas prices vary considerably among various locations throughout North America because the cost to transport the natural gas supply to the specific demand location needs to be a consideration of the gas price in that region.
While there are dozens of locations that disclose gas price throughout North America, the largest center for North America is the Henry Hub in Louisiana. The difference in the gas price between Henry Hub and other North American locations is referred to as the gas basis differential. The gas price differential between Canada and the U.S. can add another level of complexity because a monetary exchange rate forecast is required.
The map illustrates the forecast gas price differential in 2015 and 2050 from Henry Hub for California, Western Canada, the Midwest and Northeast regions. For example, the gas price in the Northeast in 2015 is expected to average $1.33 per million Btu (MMBtu) more than Henry Hub, whereas in 2050, the Solomon gas price differential model indicates the difference in gas price will be lower at 30 cents per MMBtu.
In summary, natural gas forecasts can be built from fundamentals using a host of detailed assumptions by year. The results of forecasts are used to gain an appreciation of how the future could turn out and in that context, how that new knowledge can be used. And in the case of natural gas, this steady growth creates business opportunities.
Recommended Reading
Hess Corp. Boosts Bakken Output, Drilling Ahead of Chevron Merger
2024-01-31 - Hess Corp. increased its drilling activity and output from the Bakken play of North Dakota during the fourth quarter, the E&P reported in its latest earnings.
The OGInterview: Petrie Partners a Big Deal Among Investment Banks
2024-02-01 - In this OGInterview, Hart Energy's Chris Mathews sat down with Petrie Partners—perhaps not the biggest or flashiest investment bank around, but after over two decades, the firm has been around the block more than most.

Petrie Partners: A Small Wonder
2024-02-01 - Petrie Partners may not be the biggest or flashiest investment bank on the block, but after over two decades, its executives have been around the block more than most.

From Restructuring to Reinvention, Weatherford Upbeat on Upcycle
2024-02-11 - Weatherford CEO Girish Saligram charts course for growth as the company looks to enter the third year of what appears to be a long upcycle.

JMR Services, A-Plus P&A to Merge Companies
2024-03-05 - The combined organization will operate under JMR Services and aims to become the largest pure-play plug and abandonment company in the nation.