
(Source: Schubarth Inc.)
[Editor's note: This story appears in the July 2020 edition of E&P. It was originally published July 1, 2020. Subscribe to the magazine here.]
Completion and well spacing optimization are not new issues. In the past, vertical well completions and well spacing were decided through reservoir characterization, reservoir engineering and economics. These methods were effective in predicting the future production and the drainage area of each well. Today, in unconventional horizontal multistage completion wells, the industry has turned to using a statistical approach to evaluating past completions and production using Big Data. This approach requires hundreds of wells to determine the completion parameters necessary to improve economics. Large companies can afford to gather Big Data on wells completed with suboptimal designs because they have thousands of remaining locations. Small companies cannot afford this methodology, the value of each well is too important. They are left looking over the fence, not knowing whether the large company is still conducting “experiments” or has identified an optimal design.
The oil and gas industry is tasked with providing the fuel that runs the world’s economy but must also make a profit doing so. The profit made compared to the money spent determines the investor’s willingness to provide capital and the value of publicly traded companies. Even before the recent collapse in oil price, the investment community had been critical about the return on investment (ROI) the industry was delivering. This was primarily due to focusing on production, with minimal focus on the capital being spent.
It is time to get back to reservoir engineering, characterization and economics. The first critical step is modeling (predicting) the future production for various completion designs and the associated costs for each of those designs. Knowing how a change in design and costs affect future production enables optimizing the completion for economics, improving each well’s ROI. Reservoir and completion characterization reveal the drainage areas of each well and allow improved economic well spacing, further increasing ROI.
The process
The production decline of unconventional horizontal multistage wells behave similarly. There are three primary flow periods that these wells experience: early-time linear flow, transitional flow and late-time linear flow. Any of these periods may be interrupted by interference between wells. A detailed description of these flow periods is provided in the URTeC 2019-1142 paper. Each one of these flow periods tells producers something about the formation permeability (the system of matrix and natural fracturing) and the completion effectiveness (number of dominant fractures and the average effective fracture half-lengths).
Using the production history of an existing well and reservoir modeling software, either analytical or numerical, that history is matched to determine the formation permeability, number of producing dominant fractures and the average effective fracture half-length. If only the first flow period is present, there is no unique solution to these parameters. If only the first two flow periods are present, there becomes a few possible solutions to these values. If all three flow periods are present, the solution becomes unique.
Individual well optimization
Once multiple wells are matched, a range for formation permeability and the effective fracture half-lengths can be bracketed. If different stage sizes had been used during the completion of these wells, a determination can be made between fracture treatment design and effective fracture half-length achieved. This leads to projecting what may be possible from larger or smaller treatments. The cost of performing these different size treatments varies and can then be used to optimize stage treatment size and design.
Knowing the formation permeability and effective fracture half-length versus various treatment sizes, the reservoir model is used to forward model the production for a wide variety of stage spacing options and stage treatments sizes. Utilizing the cost for each of these scenarios, economics can be performed to determine the profit, net present value (NPV) and ROI from each completion scenario, and a heat map can be constructed to determine in which direction economic improvement may be obtained (Figure 1).
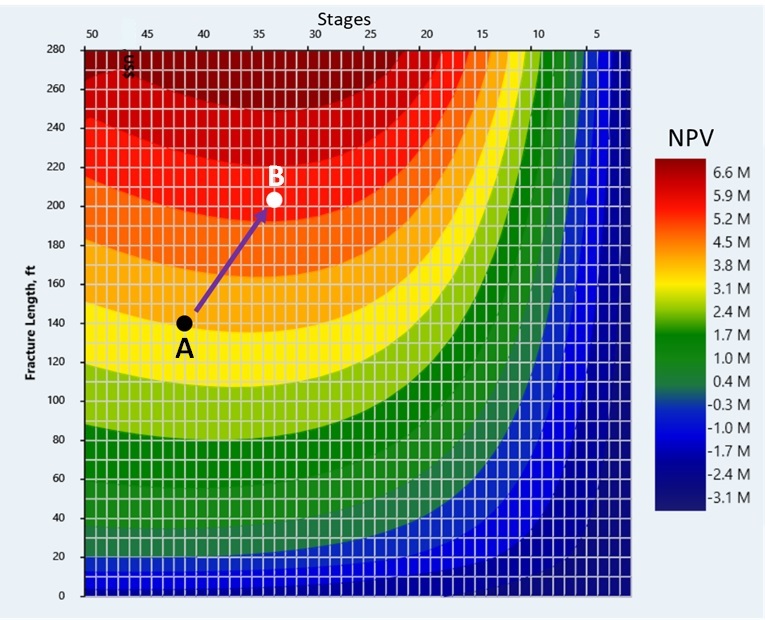
Early time production, initial potential (IP), has been used by the industry to guide completion design changes over the past decade. The magnitude of a well’s IP is determined by the product of the surface area of the producing fractures and the square-root of the permeability. However, the EUR is a function of the stimulated reservoir volume, determined primarily by the lateral length and the effective fracture half-length. So IP can be increased by increasing the number of stages (increasing the cost of the well); however, if effective fracture half-length is not increased, the EUR will be virtually unchanged. This leads to rate acceleration (over a short period of time) and destroying economic value.
Well spacing optimization
Optimizing well spacing begins with the same critical tools, reservoir characterization, reservoir engineering and economics. The results from the production history matching process are used to describe the completions and reservoir in the model. Well spacing is varied in the model, and scenarios are generated showing how a well bounded on both sides produces compared to a well in an infinite acting reservoir. The recovery for the bounded well is then used to generate the economics for wells completed at each well spacing scenario.
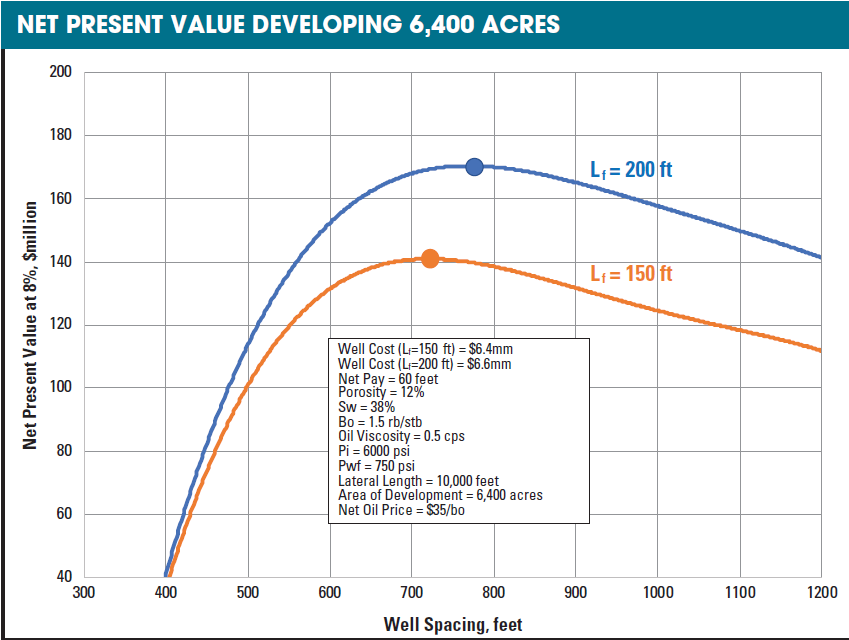
Figure 2 summarizes the NPV (8%) results for different well spacing to develop 6,400 acres using the reservoir parameters shown. A case is shown for an effective half-length (Lf) of 150 ft and 200 ft. By increasing the Lf by only 50 ft, the optimum capital investment reduces by $12 million and NPV increases by $30 million.
Summary
Reservoir/completion characterization through production history matching can lead to significant increases in economic return. The well count necessary to gain meaningful knowledge is far less than that needed by Big Data solutions. Understanding unconventional reservoir production decline behavior coupled with the ability to forward model completion and well spacing changes, enables operators to optimize their capital investment and achieve the optimal economic performance.
Recommended Reading
US Drillers Add Oil, Gas Rigs for Second Week in a Row
2024-01-26 - The oil and gas rig count, an early indicator of future output, rose by one to 621 in the week to Jan. 26.
US Drillers Add Oil, Gas Rigs for Third Time in Four Weeks
2024-02-09 - Despite this week's rig increase, Baker Hughes said the total count was still down 138 rigs, or 18%, below this time last year.
US Drillers Cut Oil, Gas Rigs for the First Time in Three Weeks
2024-03-08 - The oil and gas rig count, an early indicator of future output, fell by seven to 622 in the week to March 8, the lowest since Feb. 16.
US Drillers Cut Oil, Gas Rigs for First Time in Three Weeks
2024-02-02 - Baker Hughes said U.S. oil rigs held steady at 499 this week, while gas rigs fell by two to 117.
US Drillers Cut Oil, Gas Rigs for Second Time in Three Weeks
2024-02-16 - Baker Hughes said U.S. oil rigs fell two to 497 this week, while gas rigs were unchanged at 121.