(Source: Sobrevolando Patagonia/Shutterstock.com)
The oil and gas industry would benefit from innovations that improve the recovery of hydrocarbons. In response to the current economic downturn, operators are seeking viable ways to alleviate risk and have more certainty on the return.
Many existing monitoring methods rely on seismic, an outdated procedure that commonly takes weeks or months to view processed results. Other indicators, such as production, tracers, FMI logs and pressure gages, give operators plenty of information about the success or failure of the frac stages, but retroactively.
New technology has been developed to track fluid during fracturing operations in real time. Using a controlled-source electromagnetic (CSEM) tool, a signal response from the frac fluid can be imaged, giving operators a bird’s eye view of their frac stage while it is happening. The real-time aspect of this technology allows operators to respond quickly to undesired events, preventing a loss in production.
What is CSEM and how does it track fluid?
The application of CSEM relies on the principal behaviors of electromagnetics (EMs). The difference between the electrical conductivity of the fluid and background geological formation creates a signal response that images the fluid-filled fracture network. Although this method is applied on the surface, well casing increases this response with mutual inductance, which results in a powerful EM signal. The signal strength depends on the introduction of the fluid into the surrounding geology—the higher the EM signal, the more frac fluid has been introduced into the area or path of least resistance.
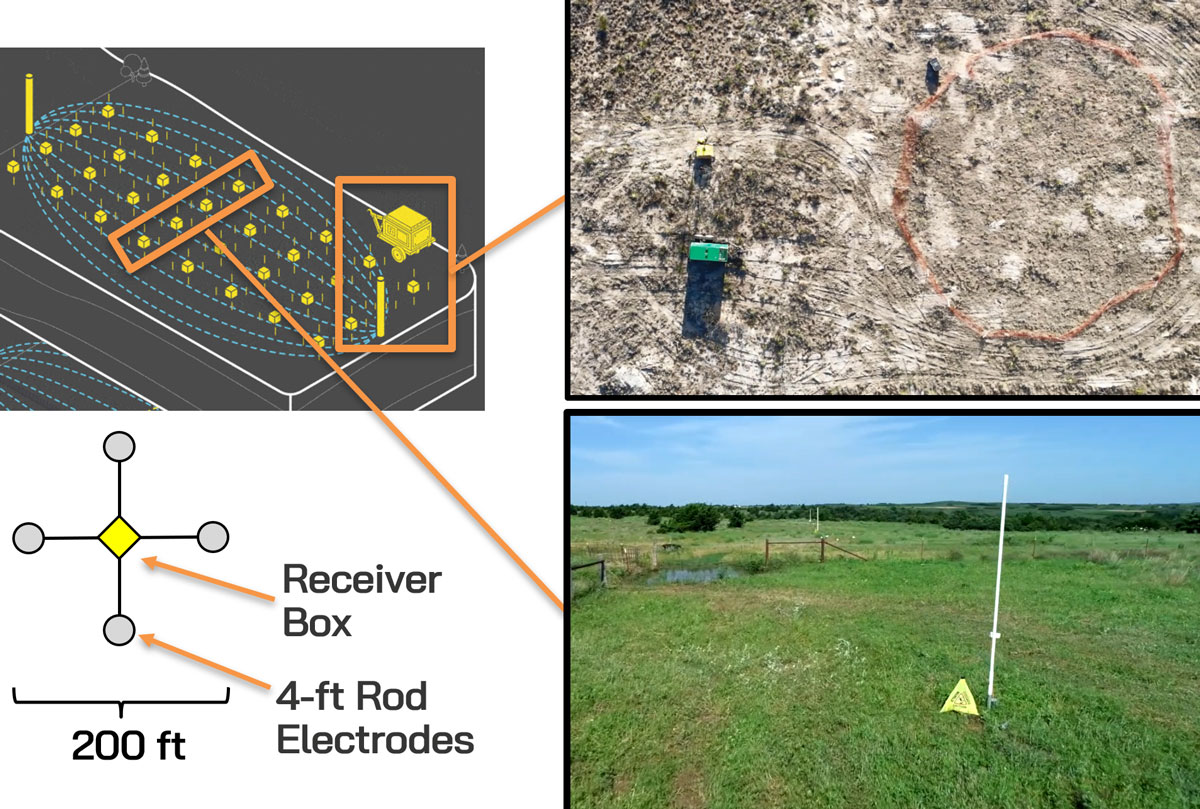
This method seamlessly integrates with well operations. A transmitter consists of a large dipole that is grounded parallel to, and directly above, the lateral of the wellbore of interest. The transmitter system removes the surface noise sources such as pipelines, rail lines or other local metallic structures.
Receivers are placed alongside the transmitters and consist of two grounded wire sensors that sample at very high rates to increase the signal-to-noise ratio. To isolate and highlight the signal response caused by the frac, a baseline signal is recorded before the start of the frac and then subtracted from the overall response. This results in a clear signal from the frac fluid.
Figure 1 shows a real example of the components in the field. The goal of the survey design is to have the array laid out as densely and efficiently as possible while avoiding areas with surface structural impediments such as pads, residences or highways.
How to see the data in real time
Processing and imaging are performed simultaneously using in-house software. Advancements in this process over the past year have led to an expedited workflow that results within a couple hours after a frac stage ends. The receivers stream the data during the stage recording directly into the mobile office servers, where it is processed for quality control. Imaging is then performed simultaneously by a geoscientist and delivered to the client via a cloud-based web portal. Clients receive a map view motion picture of the stage signal areas with detailed analytics of fracture half-lengths, total areas and azimuths observed.
Case study
In September 2020, Deep Imaging, a service provider of surface-based EM frac imaging, performed a successful real-time survey. The company tracked fluid for multiple frac stages within 3 hours after each stage ended and generated results for one stage within 1 hour. The survey layout covered one well with receivers placed to cover the expected frac half-length of the completions design. Extended coverage was placed to the east to help analyze the extent of intra-well communication with the second well on the pad. There were also parent wells to the west. Stages were monitored using an array of 80 receiver locations.
The primary objective was to prove testing could be done within a target time. The focus was also on the characterization of the stimulated reservoir area. The client was interested in analyzing well and stage spacing effectiveness, wellbore azimuth information and any potential unknowns such as plug failures or well casing integration issues. Deep Imaging’s CSEM technology provided such analysis.
What was observed?
Stages were processed and delivered within 3 hours of the previous stage. The data quality was excellent, leading to various conclusions about the completion design:
- Wellbore azimuth information: The frac stages were nearly symmetrical with some bias to the east. Since many stages display asymmetry, the bias observed gave confidence that these stages were spaced appropriately.
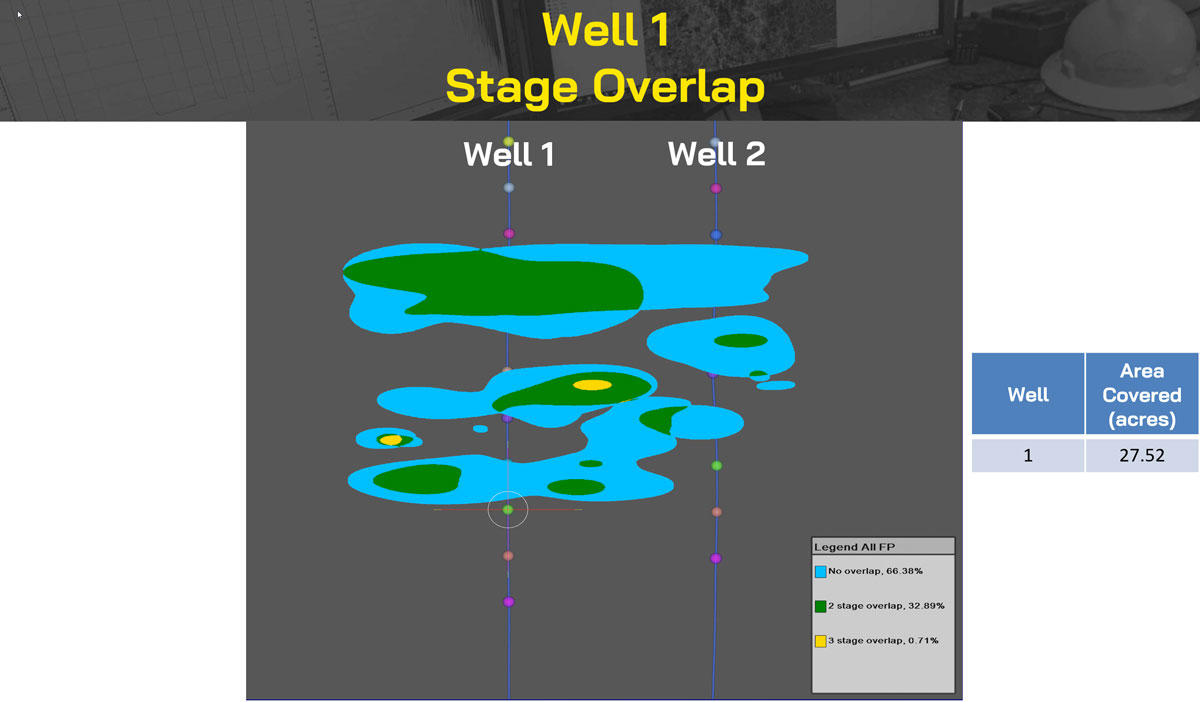
- Fluid tracking: Stage overlap was calculated and quantified the overlapped area (Figure 2a). The results showed that 67% of the frac stage signal did not overlap with other stages, whereas 34% of stages overlapped with at least one other stage. The total percentage of the effective stimulated area of all frac stages was about 75% of what was expected by the client relative to the estimated stimulated rock area. This gave the client insight into the current design’s stage efficiency.
- Completions unknowns: No detrimental frac effects were observed nor indications of plug failures from abrupt, north-south signal migration. Also, an aforementioned eastern signal bias was observed despite the parent wells to the west. Although depletion effects were expected, the interaction between child wells created a stress-conduit effect where previous nearby stages from the opposing well created a path of least resistance.
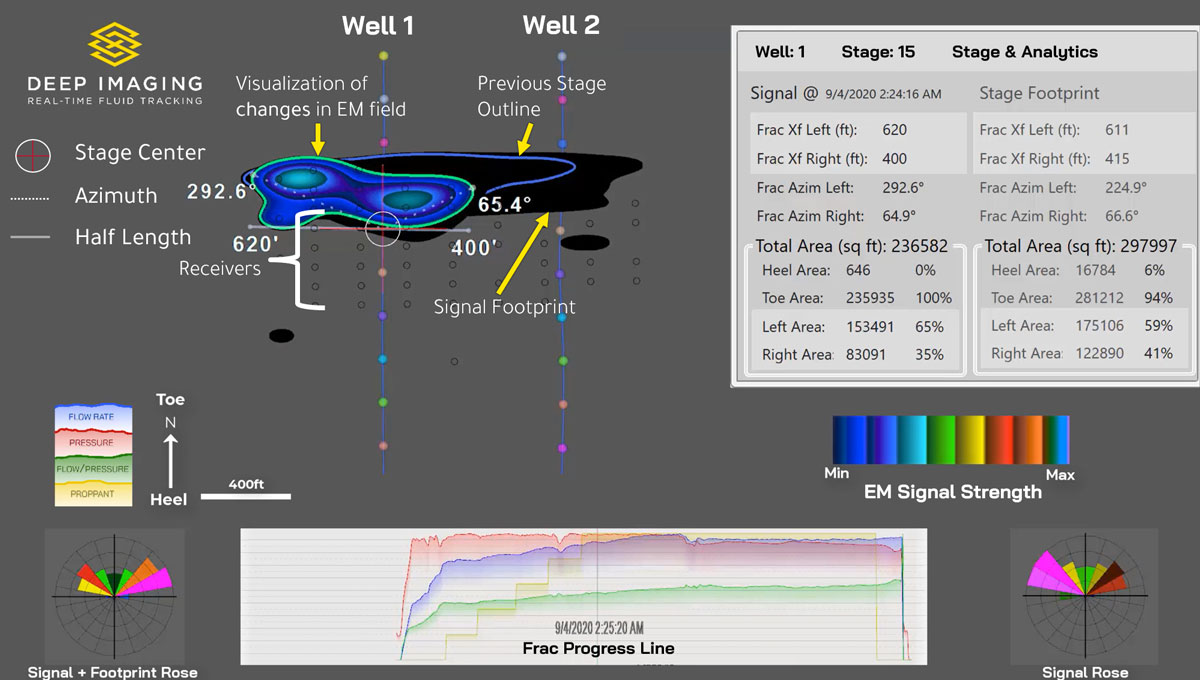
All processes of the frac stage are viewed together in a summarized snapshot in Figure 2b. This figure also includes the frac completion curves corroborated alongside the EM signal. These curves indicate how the signal behavior correlates with completion stage progression. EM signal strength indicates the perturbance caused by the frac fluid in the system and its extent. Not only do these indicators show real-time qualitative information, but they are also further quantified to make more impactful and thoughtful operational decisions
The way ahead
With fracturing operations becoming increasingly complicated, it is imperative that more meaningful data be used to make decisions in real time. As machine-learning algorithms advance, more fluid dynamics information must be input to improve predictions.
Deep Imaging recently reached a milestone in the application of its improved technology. Data were successfully collected in real time while the client’s objectives for reservoir characterization were also met. This technology meets an industry need and is poised to make more breakthroughs alongside other advancements in real time.
Recommended Reading

Tangled Up in Blue: Few Developers Take FID on Hydrogen Projects
2024-04-03 - SLB, Linde and Energy Impact Partners discuss hydrogen’s future and the role natural gas will play in producing it.

Occidental Reports ‘Great Progress’ on Net-zero Pathway, DAC
2024-02-21 - Most of Occidental Petroleum’s planned $600 million investment in emerging low-carbon ventures for 2024 will go to direct air capture facility STRATOS, CEO Vicki Hollub says.
SLB to Acquire Majority Stake in Aker Carbon Capture
2024-03-31 - SLB and Aker Carbon Capture plan to combine their technology portfolios, expertise and operations platforms to bring carbon capture technologies to market faster and more economically, SLB said in a news release.

NZT Power, NEP Pick Contractors for Teesside-based Decarbonization Projects
2024-03-15 - About $5.1 billion in work will go to the contractors once projects reach FID, which is expected in September.
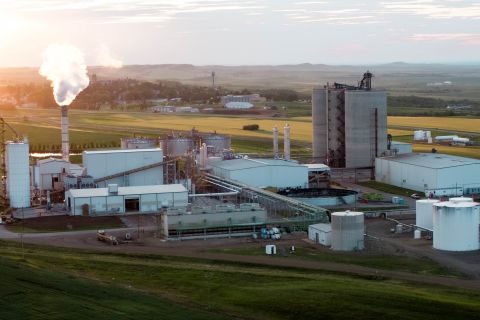
Red Trail Energy Issues Carbon Removal Credits
2024-03-06 - Red Trail Energy’s CO2 removal credits is the largest durable carbon removal project registered on the Puro Registry to date.