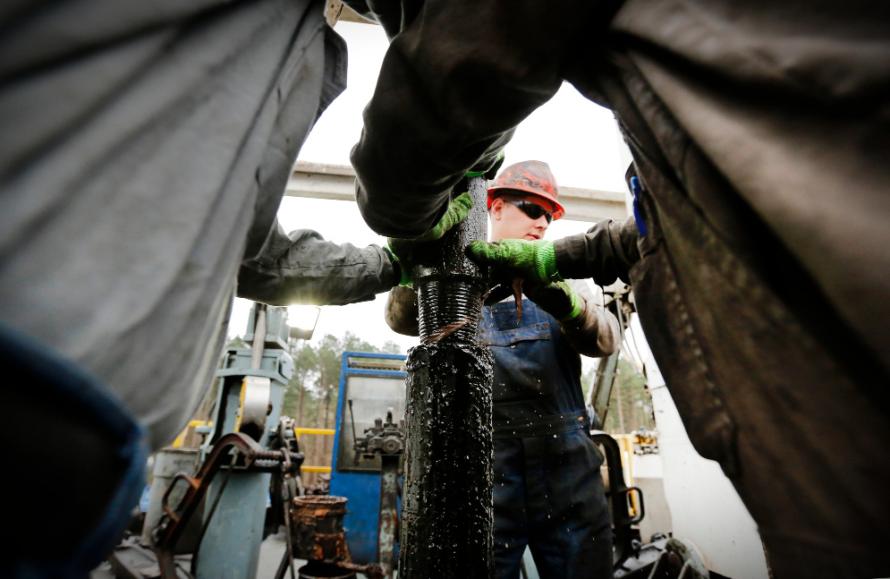
Drilling operations in the Haynesville Shale in DeSoto Parrish, La. (Source: Hart Energy)
[Editor's note: A version of this story appears in the January 2020 edition of Oil and Gas Investor. Subscribe to the magazine here.]
After a half-decade of confusing metrics on well intensity, it is time to embrace a new approach for evaluating E&P performance.
Seems like only yesterday that E&Ps adopted language that incorporated variations on barrels of oil equivalent (boe) per 1,000 foot of lateral, or IP-24 hour, IP-30 day, or 180-day cum’s, or capital efficiency measurements anchored to drilling day reductions, or completed stages per day. And let’s not forget type curves, the arbitrary designation where every headline well’s estimated ultimate recovery is better than average.
Such metrics were proffered to the financial community as a Rosetta Stone to decipher the mishmash of results that populated E&P press releases and quarterly earning calls.
E&Ps touted technical expertise at every investor conference. The irony is that each operator sought to differentiate itself by highlighting metrics like lateral length, proppant intensity and spacing, both for individual laterals (stages per well) and wells per drilling spacing unit.
One can forgive generalist investors for the frustration involved in trying to determine whether an average 200- or 500- foot variance in lateral length, or 200- to 800-pound range in proppant per lateral foot actually separated any individual E&P from its peers. Indeed, the way E&Ps differentiated themselves to the investor class was by revealing that they were all range-bound when it came to well intensity.
Meanwhile, all of this was obscured by the fact that aggregate industry production rose impressively in tight formation plays over the past eight years even as a cohort of 36 publicly held E&Ps produced aggregate negative cash flow per boe every single year during that period, according to McKinsey & Co. Such was the zeitgeist that reflected the production volume growth phase of shale development.
Lately, analysts have been sifting through the proliferation of mass data presented by firms such as Enverus, Wood Mackenzie, Rystad, IHS Markit and RS Energy Group. That winnowing reveals production per well in most basins peaked a couple years ago and has declined since, even as completion intensity grew.
This decline reflects the growing percentage of infill wells as basins mature combined with aggressive spacing assumptions. Stages too closely spaced cannibalize production along the lateral, while laterals too closely spaced between each other cannibalize well productivity from 25% to 35%.
Now that the oil and gas industry has embarked on a new business model in which E&Ps operate like a standard business emphasizing profitability vs. the old model of growth at any cost, focus is narrowing to metrics that impact financial performance. In the cash constrained new era of energy, metrics that matter most involve a “show-me-the-money” measurement that reveals sustainable positive net cash flow at the bottom line.
And that leads to the evolving way analysts use to examine the industry. The emphasis is on a holistic approach to operations, moving beyond rig count, fracture stimulation crews or other traditional tracking metrics. Chief among these new metrics is true cycle time. And, no, true cycle time is not just about reduced drilling days, or the total number of stages pumped per day, or the number of wells per quarter turned in line. Rather, true cycle time is about how quickly an operator generates a dollar of revenue after the well has been spud.
E&Ps understate the true amount of time it takes to convert an invested dollar into revenue.
A Guggenheim Partners review of 15 E&Ps found true cycle time ranged from 160 days to 450 days per well, with more than half exceeding 300 days. True cycle times varied by basin from 11 to 14 months, with the Anadarko and Permian basins at five to seven months and the large pad and extended lateral dry gas plays in Appalachia at the long end.
Furthermore, true cycle time varied by E&P class. The integrated companies take longer, while basin-specific independents turn wells to sales the fastest.
With E&Ps bumping into technical limitations on drill days or completion times, efforts to eliminate the empty space in scheduling all field operations become a key to reducing true cycle time and thus revenue acceleration.
The takeaway is significant opportunity exists for further capital efficiency improvements. At sub-$60 oil, capturing those gains is essential.
Recommended Reading
Tech Trends: Safety, Speed, Savings: Automation is Transforming Drilling
2024-03-26 - Drilling is getting smarter through automation, delivering efficiency, consistency and reliability.
Drilling Tech Rides a Wave
2024-01-30 - Can new designs, automation and aerospace inspiration boost drilling results?
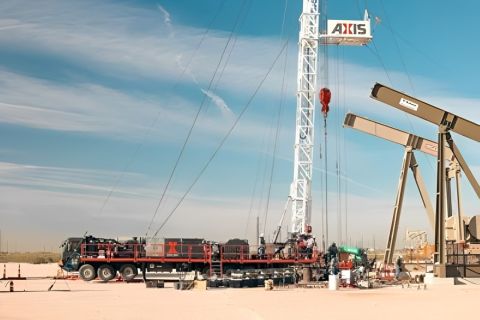
Axis Energy Deploys Fully Electric Well Service Rig
2024-03-13 - Axis Energy Services’ EPIC RIG has the ability to run on grid power for reduced emissions and increased fuel flexibility.

Tech Trends: AI Increasing Data Center Demand for Energy
2024-04-16 - In this month’s Tech Trends, new technologies equipped with artificial intelligence take the forefront, as they assist with safety and seismic fault detection. Also, independent contractor Stena Drilling begins upgrades for their Evolution drillship.
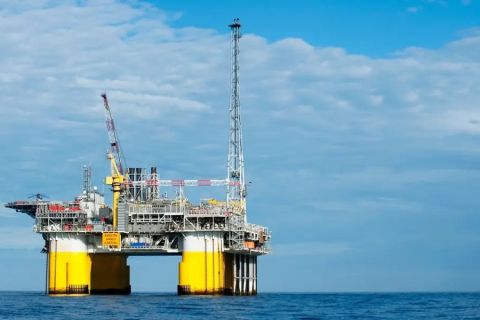
2023-2025 Subsea Tieback Round-Up
2024-02-06 - Here's a look at subsea tieback projects across the globe. The first in a two-part series, this report highlights some of the subsea tiebacks scheduled to be online by 2025.