
(Source: Shutterstock.com)
[Editor's note: A version of this story appears in the July 2020 edition of E&P. It was originally published July 2, 2020. Subscribe to the magazine here.]
As operators are adjusting their cost base in response to a very challenging commodity price environment, two options can be swiftly implemented. Laying down rigs and deferring completions, and shutting in producing wellbores. Both options bring challenges as wells are finally completed or brought back online. TGS decided to investigate.
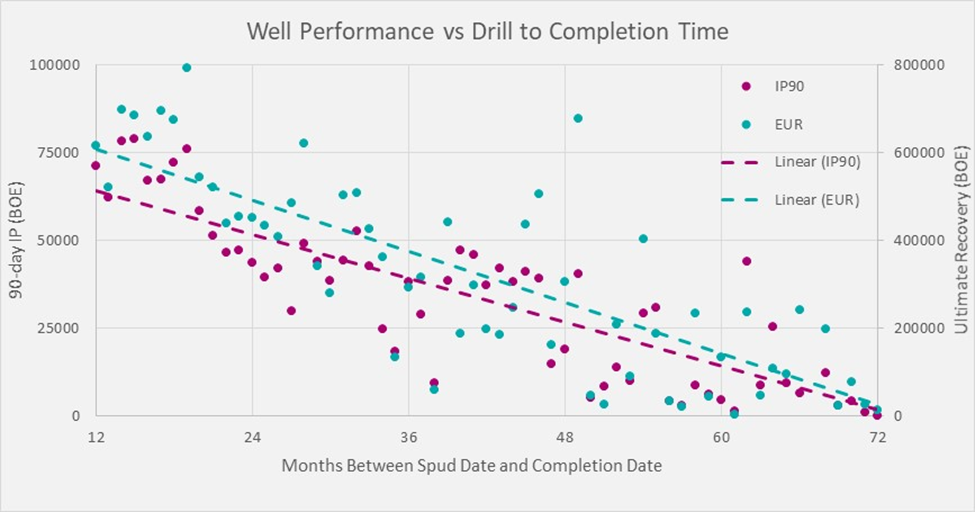
One benefit of drilled but uncompleted wells (DUCs) is that they are essentially long-term, partially funded, storage of supply in the ground. However, TGS’ analysis shows that, as a general observation, the amount of time wells remain in the ground uncompleted has a negative impact on overall performance, both in terms of 90-day IP as well as ultimate recovery (Figure 1).
As such, whether an operator is contemplating drilling DUCs or looking to acquire assets with already drilled DUCs, it’s important to understand their potential value and how that value can vary based on environmental, financial and strategic factors. For full disclosure, the insights are gained through analysis of the vast library of onshore well production and performance data held by TGS, the largest in the industry.
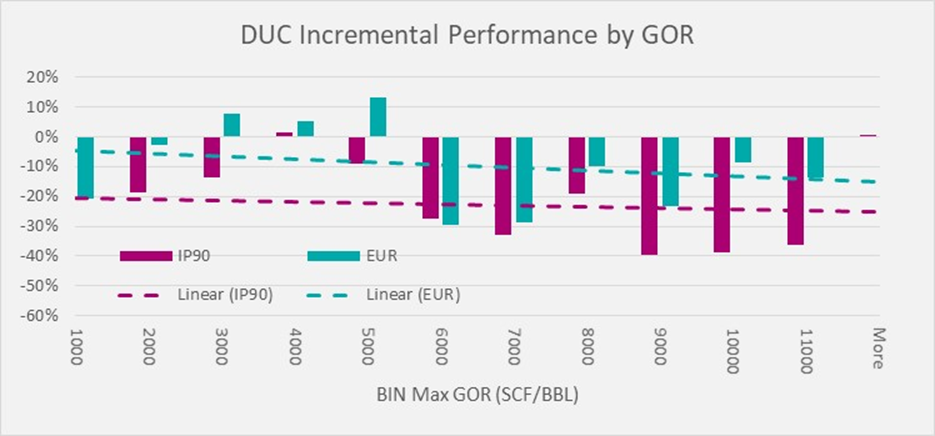
The company’s analysis compares 30-day IP and EUR of DUCs as a percentage increase or decrease over their respective analogue of normally drilled wells with the goal of extending these insights to other plays not specifically included. A significant indicator of overall performance is the time between drilling and completing a well. There are a number of technical factors that may be at play with regard to changes in well performance based on the time between drilling and completion, but the geology, well design or eventual completion design likely also play a role. Results indicate that, beyond time to completion, a significant differentiator of marginal performance and value of DUCs versus their analogues is the dominant phase and gas-oil ratio (Figure 2).
Similarly, shutting in wells is one of the more drastic approaches to take in response to adverse market conditions. For higher performing wells, shutting in may be a strategic decision to temporarily keep reserves in the ground until sale prices rebound. For lower performing wells, shutting in is more likely to be an operational necessity, especially if the operating costs for maintaining production outpace the value of hydrocarbons produced. In either scenario, there are risks to the productivity of the shut-in well comparing production before and after shut-in.
Similarly, shutting in wells is one of the more drastic approaches to take in response to adverse market conditions. For higher performing wells, shutting-in may be a strategic decision to temporarily keep reserves in the ground until sale prices rebound. For lower performing wells, shutting-in is more likely to be an operational necessity, especially if the operating costs for maintaining production outpace the value of hydrocarbons produced. In either scenario, there are risks to the productivity of the shut-in well, as shown in Figure 2, comparing production before and after shutin. Results indicate an average 22% increase in water rate, a 25% decrease in oil rate, and a 31% decrease in gas rate after a shut-in. Some possible explanations for well performance degradation, are skin build-up, abrupt pressure fluctuations, or reservoir fluid and pressure equilibration. Still, this analysis focuses on the measurable outcomes to economically viable well production after a shut-in.
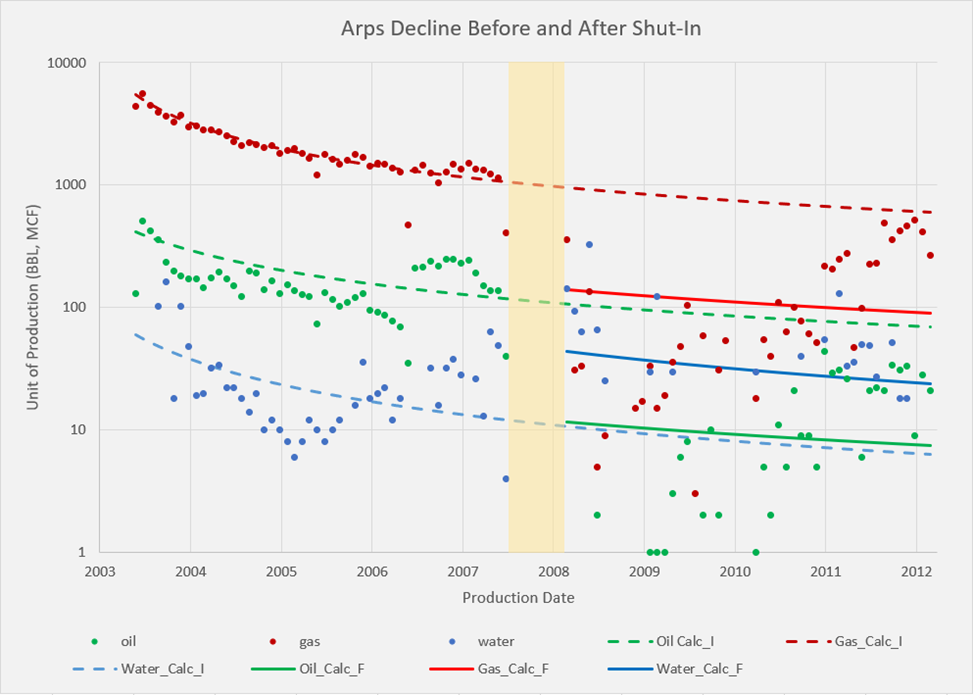
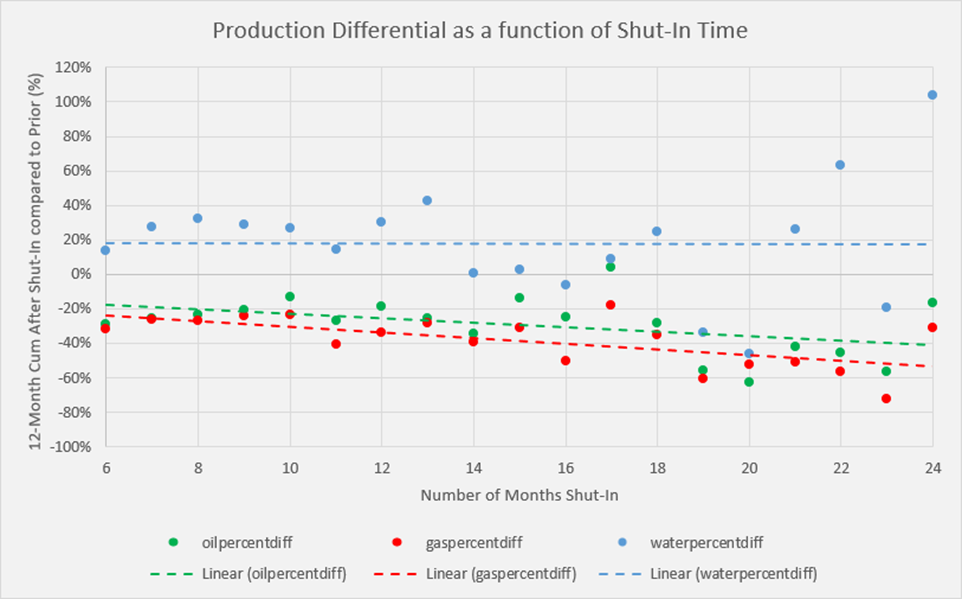
A sample well indicative of overall changes in performance due to shut-ins is shown in Figure 3, with the shut-in period highlighted in [yellow]. This example shows trends like increased water rate and decreased oil and gas rates after the shut-ins when compared with pre-shut-in production, which tend to be shared with many wells across the study. While this analysis indicates that some performance degradation is likely when shutting-in, further investigation reveals that this degradation may be mitigated or exacerbated based on the amount of time the well is shut in. Figure 4 shows that while the drop in water rates remain relatively constant, wells that are shut-in for longer periods of time tend to produce progressively lower oil and gas volumes.
Overall, both DUCs and shut-ins are strategic decisions that can have tangible costs in terms of reduced future well performance. The actual impact likely depends on local reservoir properties and geology and should be evaluated on a case-by-case basis. Depending on individual well performance, cost savings today might lead to reserve write-downs or increased operating costs tomorrow.
Recommended Reading
Tech Trends: Halliburton’s Carbon Capturing Cement Solution
2024-02-20 - Halliburton’s new CorrosaLock cement solution provides chemical resistance to CO2 and minimizes the impact of cyclic loading on the cement barrier.
To Dawson: EOG, SM Energy, More Aim to Push Midland Heat Map North
2024-02-22 - SM Energy joined Birch Operations, EOG Resources and Callon Petroleum in applying the newest D&C intel to areas north of Midland and Martin counties.
Range Resources Expecting Production Increase in 4Q Production Results
2024-02-08 - Range Resources reports settlement gains from 2020 North Louisiana asset sale.
Sinopec Brings West Sichuan Gas Field Onstream
2024-03-14 - The 100 Bcm sour gas onshore field, West Sichuan Gas Field, is expected to produce 2 Bcm per year.
TotalEnergies Restarts Gas Production at Tyra Hub in Danish North Sea
2024-03-22 - TotalEnergies said the Tyra hub will produce 5.7 MMcm of gas and 22,000 bbl/d of condensate.


