
(Source: CGG SA; Shutterstock.com)
[Editor's note: A version of this story appears in the July 2020 edition of E&P. Subscribe to the magazine here. It was originally published July 1, 2020.]
Standard pyrolysis analysis methods, such as Rock-Eval® Basic/Bulk-Rock, provide information on the quantity, type and thermal maturity of organic matter. This widely used technique for the characterization of sedimentary organic matter in petroleum exploration also is commonly applied to evaluate unconventional resource potential. It is one of the primary geochemical analyses applied to vertical and/or lateral wells in unconventional plays prior to an additional detailed evaluation of source rock samples.
Depending on the sample type (e.g., core, cuttings), its complexity (contaminated/non-contaminated samples) and the resolution of the pyrolysis analysis results, additional modifications to the initial analytical program may be required. Commonly, some limitations can be experienced with the standard pyrolysis method, especially in shale oil plays. These limitations can be an underestimation of the S1 peak (remaining free/mobile hydrocarbons) as well as hydrocarbons being carried over into the S2 peak (i.e., recognized as a shoulder on the left side of the S2 peak) in bitumen-rich source rocks, this last effect resulting in an overestimation of the S2 peak and related parameters (e.g., hydrogen index, production index, etc.).
These limitations have a significant impact on oil-in-place estimation and source rock characterization in unconventional shale oil plays. As a result, the standard pyrolysis method needs adjusting to improve the quality of results, allowing the refinement of source rock characterization and quantification of bitumen or hydrocarbon content.
CGG has developed a new unconventional pyrolysis method for bitumen-rich source rock samples from shale oil plays. This technique applies a different temperature program to the Rock-Eval® 6 pyrolysis equipment, using the multi-heating temperature program option. This method significantly improves the peak resolution of the hydrocarbons carried over into the S2 peak and resolves the issue of the S1 peak being underestimated. Moreover, it significantly improves the interpretation and evaluation of the organic matter properties and productive trends in shale oil plays.
Standard pyrolysis method
Standard Rock-Eval® pyrolysis uses a programmed temperature heating method where a small amount of rock (50 to 70 mg) or coal (30 to 50 mg) is placed in an inert atmosphere (helium or nitrogen) to quantitatively determine the amount of free hydrocarbons present in the sample (S1 peak). This should be referred to as the remaining free hydrocarbons volatilized at a temperature lower than 300 C. The hydrocarbons generated by the cracking of the organic matter is given by the S2 peak. The Tmax value is a standard parameter, calculated from the temperature at which the S2 peak reaches its maximum. This parameter is used as a maturity indicator for fossil organic matter.
As part of a comprehensive geochemical analysis, a quality control inspection of the pyrograms is always recommended to validate the quality of the pyrolysis data before integration into the geochemical interpretation.
PYROGRAMS FROM CONVENTIONAL PYROLYSIS ANALYSIS BEFORE AND AFTER SOLVENT EXTRACTION
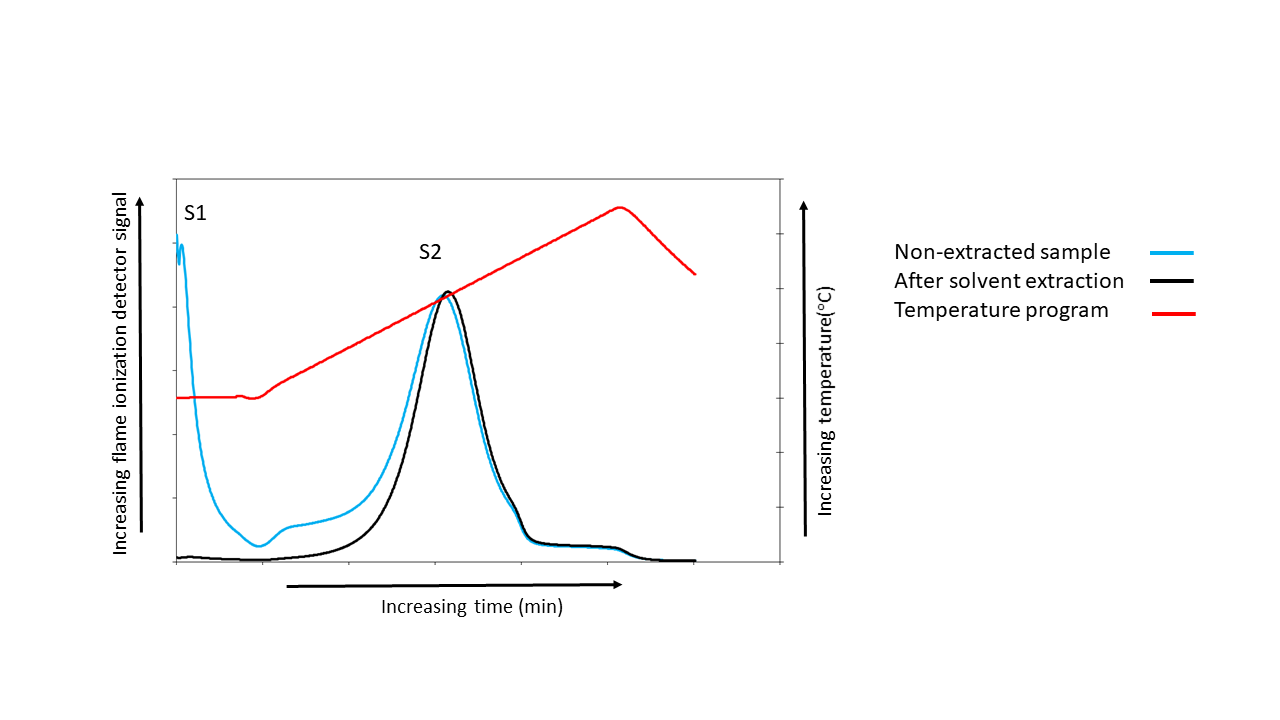
Figure 1a shows the most common issues encountered using the standard temperature program (shown by the light blue curve line):
- The incomplete resolution of the S1 peak; and
- The shoulder observed on the left side of the S2 peak due to the bitumen’s heavier molecular weight component requiring temperatures greater than 300 C to be released from the rock.
Consequently, a proportion (of mostly) heavy hydrocarbons are carried over into the S2 peak and quantified as part of it. This issue is commonly observed in bitumen-rich source rocks or mature source rocks (within the oil window) when analyzed by the standard pyrolysis method.
To overcome these issues, pyrolysis analysis should be performed on source rock samples before and after solvent extraction. These steps provide the best method for achieving an appropriate geochemical characterization of the source rock and accurately assessing the hydrocarbon content in shale oil plays and contaminated samples (Figure 1a, black curve). However, this workflow is not cost-effective, as it requires additional time and effort because each sample needs to be analyzed twice.
New pyrolysis method
With CGG’s unconventional pyrolysis method a small amount of rock powder (40 to 70 mg, depending on the organic richness of the source rock samples) is heated at four different temperature stages, starting from 90 C to up to 650 C, during which five parameters are measured: Q0, Q1, Q2 and Q3 (equivalent to S2 peak after solvent extraction) and Tmax (Figure 1b).
HYDROCARBON CONTENT DETERMINATION AND SOURCE ROCK EVALUATION
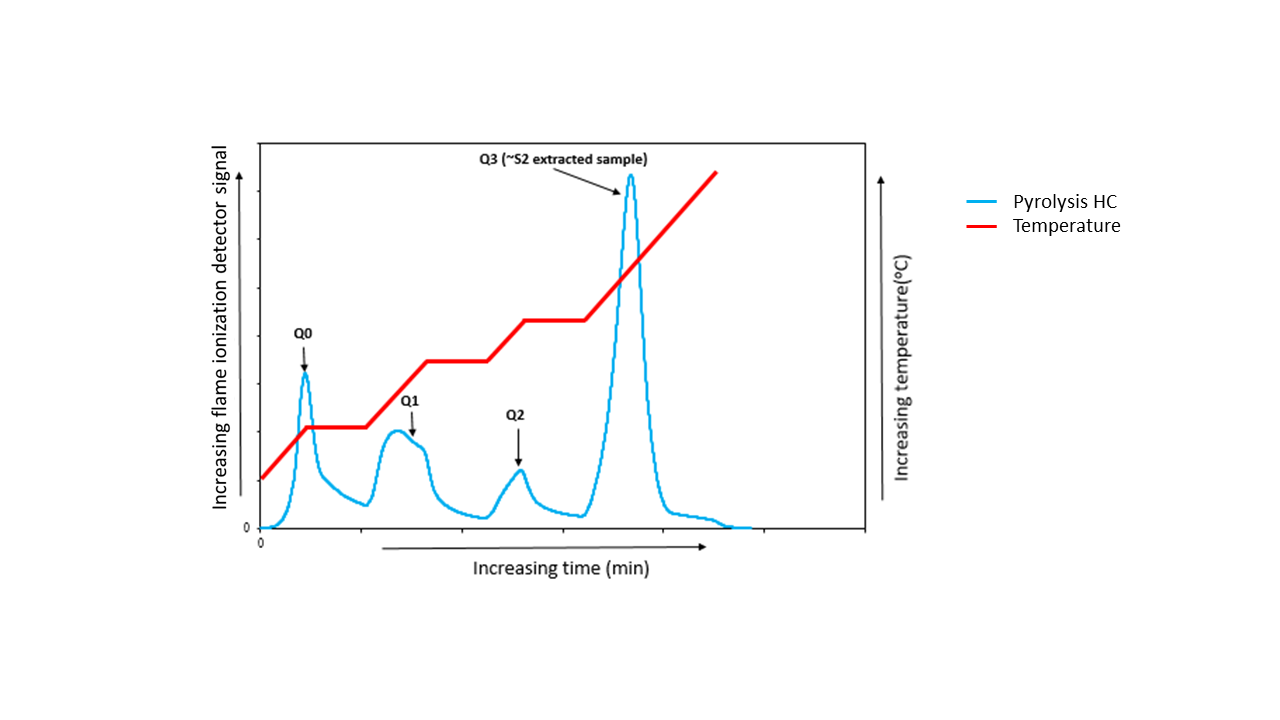
Stage 1: The lightest hydrocarbon fraction is released from the source rock sample and quantified as Q0 peak (mgHC/gRock). This fraction represents the preserved residual light hydrocarbons, likely dominated by the free hydrocarbon phase.
Stage 2: Medium-to-heavy molecular weight components are released or vaporized and quantified as Q1 peak (mgHC/gRock). This peak represents a mix of free adsorbed hydrocarbons.
Stage 3: The most resistant hydrocarbons, mostly made up of the heaviest molecular weight components, are released. This fraction is measured by the Q2 peak (mgHC/gRock). It is likely composed of high molecular weight hydrocarbons, resins and asphaltenes adsorbed on the kerogen and/or mineral matrix of the sediments, which cannot be resolved at temperatures lower than 300 C.
Stage 4: In this final stage, the Q3 peak is recorded (mgHC/gRock). This peak provides milligrams of hydrocarbons generated by pyrolytic degradation of the kerogen itself. The Q3 peak is comparable to the S2 peak obtained in extracted source rock samples analyzed by standard pyrolysis analysis. Similarly, the Tmax value is measured on the maximum value of the Q3 peak (S2 peak). In the equipment, a parameter called TpQ3 (degrees C) is recorded, which needs to be corrected by subtracting 40 ±2 C, based on the Rock-Eval® equipment calibration.
Figure 1b shows a pyrogram obtained from the new unconventional pyrolysis method performed on a nonextracted source rock sample (core). This sample represents an excellent peak mature (oil window) source rock unit, with kerogen type II (organofacies B). The equivalent S2 peak (represented by the Q3 peak) obtained with this new method shows comparable results to the S2 and Tmax values obtained from samples analyzed by the standard method after solvent extraction. Figure 2 shows a strong positive correlation between Q3 and S2 values after solvent extraction.
STANDARD AND NEW UNCONVENTIONAL PYROLYSIS METHODS
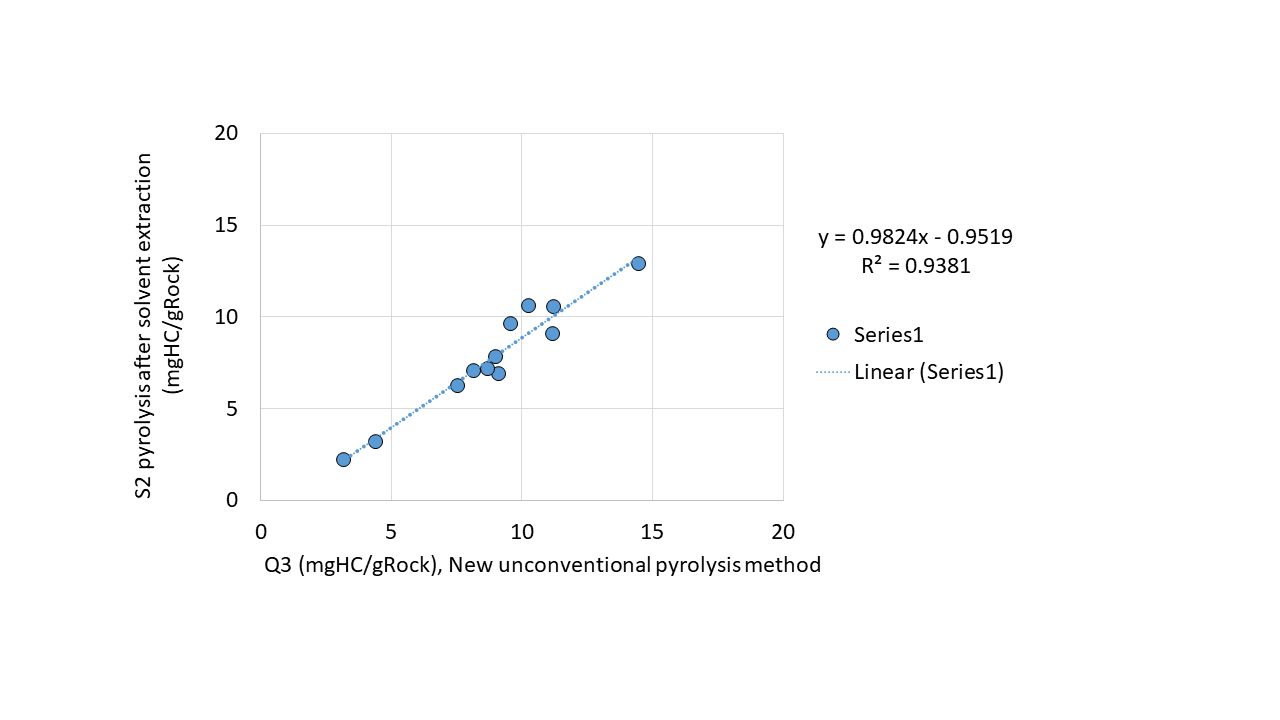
The small difference recorded between Q3 values and the S2 values in samples analyzed by the new unconventional method (non-extracted sample) and the standard method after solvent extraction, respectively, suggests that most of the “heavy end” fraction of petroleum likely produces a measurable response in the temperature range associated with stage 3, where Q2 is recorded, allowing for its separation. A minor or low fraction is inferred to produce a signal for the temperature where the maximum kerogen conversion to hydrocarbons occurs. However, these ranges could vary depending on the type of organic matter and maturity (currently under evaluation).
These results demonstrate that the newly designed temperature program can be used to reproduce, with acceptable confidence, S2 values equivalent to those obtained with the standard method after solvent extraction. This new method also offers improved evaluation of the Tmax values, by removing any effect from hydrocarbons carried over to the S2 peak. This study shows the advantages of using the multi-heating program for unconventional shale oil plays compared with the standard pyrolysis method, and as an alternative method for characterizing bitumen-rich source rock samples with less cost and time.
Although this new method is recommended for mature source rocks, extra caution is required for immature source rock samples. It can be applied for multiple purposes, such as recognizing the proportions of different hydrocarbon fractions (light, medium and heaviest molecular weight), optimizing completion design for lateral wells, inferring migrated hydrocarbons and identifying compartmentalization zones in lateral wells and studies of unconventional play resources.
Editor’s note: Rock-Eval® is a registered trademark of IFP Energies nouvelles.
Recommended Reading

US Refiners to Face Tighter Heavy Spreads this Summer TPH
2024-04-22 - Tudor, Pickering, Holt and Co. (TPH) expects fairly tight heavy crude discounts in the U.S. this summer and beyond owing to lower imports of Canadian, Mexican and Venezuelan crudes.
Russia Orders Companies to Cut Oil Output to Meet OPEC+ Target
2024-03-25 - Russia plans to gradually ease the export cuts and focus on only reducing output.

What's Affecting Oil Prices This Week? (April 8, 2024)
2024-04-08 - Stratas Advisors says geopolitics are providing a boost for oil prices as conflicts escalate–and while crude oil and oil products continue to flow, the possibility of disruption is increasing.
Liberty Energy CEO: NatGas is Here to Stay as Energy Transition Lags
2024-03-27 - The energy transition hasn’t really begun given record levels of global demand for oil, natural gas and coal, Liberty Energy Chairman and CEO Chris Wright said during the DUG GAS+ Conference and Expo.
Argentina's Vaca Muerta Shale Formation Drives Record Oil Production in February
2024-03-22 - Argentina's Neuquen province hit a record for daily oil production in February.