The current low oil prices have focused the spotlight on how technologies can be used to improve exploration success rates and exploration costs per barrel.
Using 3-D controlled-source electromagnetic (CSEM) data alongside other established technologies in the exploration workflow leads to exploration decisions with higher confidence. It also enables operators to focus sometimes-limited resources on areas with high exploration potential.
Filling the gaps
Seismic alone continues to struggle to provide interpreters with information about the fluid type and the potential hydrocarbon volumes within the undrilled prospects. With up to 75% of wells failing due to seal and charge, seismic needs support to develop a robust subsurface model.
CSEM surveys map resistivity, a rock property that correlates strongly with the fluid type and saturation of hydrocarbons. CSEM surveys support exploration decision-making in a number of ways.
Regional prospectivity
Ideally adopted at the early exploration stage where seismic and well data are sparse, EM-derived 3-D resistivity data have the potential to help operators rank prospects and understand play types and regional geologies.
Figure 1 shows an example from a multiclient survey in the Sergipe Alagoas Basin of Brazil. In this case, no seismic data or resistivity logs were used in the processing of the CSEM data to ensure the independence of the information source.

FIGURE 1. Resistivity map from the Sergipe Alagoas Basin in Brazil shows elevated resistivities at the discovery wells. (Source: EMGS)
The average resistivity maps with a depth window over the Barra analog play show that the locations of the discovery wells are associated with elevated resistivity, while lower resistivity values are at the locations of the dry or noncommercial wells. The results from this early processing stage can be used to determine the prospectivity of the region.
Well placement
Other key areas where 3-D CSEM surveys are having a significant impact include portfolio polarization and well placement.
The goal of portfolio polarization is to high-grade commercial prospects, disqualify noncommercial prospects and drill high-impact discoveries first.
Effective portfolio polarization also brings with it significant savings in finding costs per barrel with the ability to spot the difference between commercial and noncommercial prospects, vital in the context of the current low oil price regime.
CSEM’s sensitivity to net rock volume and pore fluid can also result in a significant reduction in uncertainty since prospect area and net pay are associated with the highest uncertainties in reserves estimation.
In the case of well placement and determining long-term well productivity, EM data play a vital role in combination with seismic in reducing ambiguity and diminishing the occurrence of expensive dry holes.
EM’s position in the workflow
CSEM surveys and data have an important place in the exploration workflow and in developing a geological model as close to reality as possible.
Understanding that it is not always easy to bring new measurements into already robust workflows, EMGS has developed workflows and tools that can be used to quickly and accurately demonstrate how CSEM results can be reliably embedded into their evaluation processes.
Barents Sea example
One example of a CSEM survey is in the Barents Sea exhibiting a large variety of geological settings and offering significant hydrocarbon potential.
In the Hoop Fault Complex, for example, a dominating structural element on the Bjarmeland Platform was the Wisting prospect in Lower to Middle Jurassic reservoir rocks (Fanavoll et al., 2014). In September 2013, Austrian oil company OMV announced an oil discovery in license PL537 on the Wisting prospect with an oil column of 50 m to 60 m (164 ft to 197 ft) and potentially recoverable reserves of 60 MMboe to 130 MMboe.
The discovery was associated with a significant EM anomaly as can be seen in Figure 2, where the CSEM results indicate high resistivities in two fault blocks in the northeastern part of the larger structure with the integrated interpretation pointing to the presence of hydrocarbons.
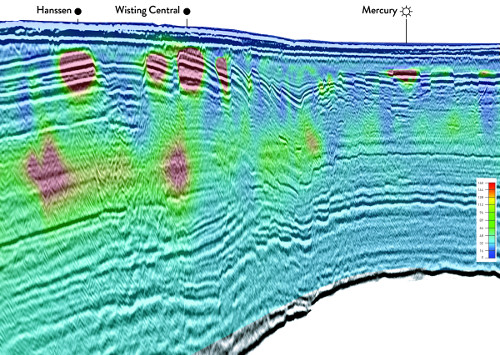
FIGURE 2. The Hanssen, Wisting and Mercury discoveries are clearly associated with resistive anomalies (warmer colors) from the 3-D CSEM data. (Seismic data courtesy TGS; Source: EMGS)
To the northwest, in the Hanssen well (7324/7-2) drilled in June 2014, an EM anomaly was coincident with the discovery and resembled the Wisting discovery (Figure 3). In this case, 18 MMboe to 56 MMboe were detected with the anomaly about a quarter of the size of Wisting and fitting exactly with the size of proven reserves. Between the two discoveries lies the Wisting Alternative well that didn’t have an anomaly and was dry.
Furthermore, in the case of the nearby Mercury well, there was an EM anomaly associated with the prospect, but the strength of the anomaly was only a third that of the Hanssen prospect and subsequently delivered much smaller volumes at 6 MMboe to 12 MMboe. This again demonstrated a strong correlation between the observed anomaly and the hydrocarbons discovery in the area.
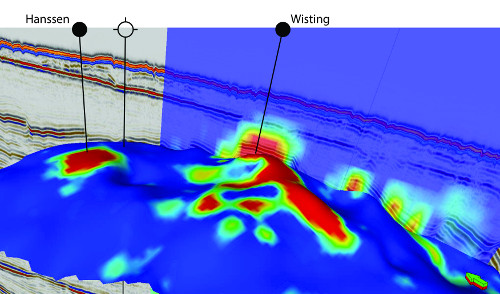
FIGURE 3. The Wisting and Hanssen oil discoveries are seen with strong resistive anomalies (red areas) from the 3-D CSEM data. The well next to Hanssen that encountered an area of low resistivity (blue) is dry. (Seismic data courtesy TGS; Source: EMGS)
While seismic continues to be the favored technology for exploration, there’s no doubt that CSEM measurements have matured. Resistivity is a complementary information source, particularly strong in areas of existing weakness such as fluid identification and volumes.
The results have made a significant impact on determining regional prospectivity, the polarization of portfolios and optimal well placements. At a time of low oil prices, having access to valuable information like 3-D CSEM data is more important than ever.
Recommended Reading

Proven Volumes at Aramco’s Jafurah Field Jump on New Booking Approach
2024-02-27 - Aramco’s addition of 15 Tcf of gas and 2 Bbbl of condensate brings Jafurah’s proven reserves up to 229 Tcf of gas and 75 Bbbl of condensate.
US Drillers Add Oil, Gas Rigs for Second Week in a Row
2024-01-26 - The oil and gas rig count, an early indicator of future output, rose by one to 621 in the week to Jan. 26.

Second Light Oil Discovery in Mopane-1X Well
2024-01-26 - Galp Energia's Avo-2 target in the Mopane-1X well offshore Namibia delivers second significant column of light oil.

CNOOC Sets Increased 2024-2026 Production Targets
2024-01-25 - CNOOC Ltd. plans on $17.5B capex in 2024, with 63% of that dedicated to project development.

E&P Highlights: Jan. 29, 2024
2024-01-29 - Here’s a roundup of the latest E&P headlines, including activity at the Ichthys Field offshore Australia and new contract awards.