
Drilling rig in the Eagle Ford Shale in Karnes County, Texas. (Source: Hart Energy)
The effects of persistent lower oil prices are increasingly leaving their mark across the U.S. shale plays and are now being felt in the core of one the most mature unconventional plays—the Eagle Ford Shale.
A Feb. 13 report from Bernstein Research highlighted what the firm termed the first significant production weakness in the most productive and heavily drilled areas of the Eagle Ford.
“And 2019 marks the first year in the past eight years [nearly the entirety of the Eagle Ford’s life] that wells in most-intensely drilled sections have become less productive,” the Bernstein analyst team led by Bob Brackett said.
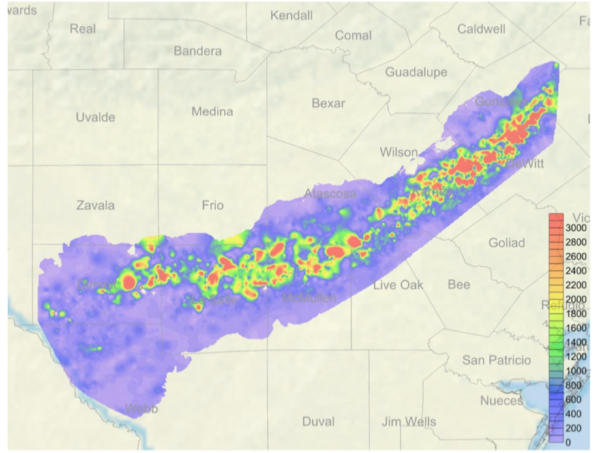
The analysts noted that producers always drill the most profitable locations first, and Bernstein’s heat maps show the expected overlap between highest well counts and IP rates. “The ‘reddest’ sections (i.e., those with the highest count of drilled wells) are squarely in the oily ‘sweet spots,’” the team said.
To confirm the deterioration in oil peak rates in heavily drilled Eagle Ford sections, the analysts looked at peak rates for three groups—high density, medium and low—of 2-mile-by-2-mile sections. The high-density group includes sections where 16 or more wells had been drilled, medium had eight to 16 wells and low included less than eight wells.
Bernstein analysts found that the average peak rates in the high-density sections fell 12% in 2019 versus 2018. They found “a similar trend on the basis of first six-month oil.” Oil peak rates also dropped off in sections with tighter spacing.

As expected, operators are drilling fewer wells in these highest density sections. After a peak of 1,939 wells drilled in such sections in 2014, the count fell to 802 in 2016. Wells drilled rebounded slightly to 1,038 in 2018, and then declined last year to 931. In the medium-density sections, well count held relatively steady from 2018 to 2019, and the low-density sections saw a slight climb from 140 to 165 wells. Thus, for 2019 vs. 2018, the high-density count fell 10% and medium dropped 6%. Meanwhile, the well count in the low-density section rose 18%.
Because producers focus on returns, “most locations with low breakeven prices [i.e., most productive ones] have already been drilled,” the Bernstein analysts said. “For instance, while 53% of all the locations with breakevens below $50 have been exploited, less than 30% of wells with breakeven of $55 to $60 have been brought online.”
The analysts discerned about 7,800 locations in the money with WTI at $55/bbl. “That covers only the next five years of production under our supply model and assumes optimistically that no other hiccups occur,” the firm said.
Plenty of Eagle Ford locations exist, but only at higher crude prices.
Based on the “significant inflection in production across U.S. shale,” and given the need for higher crude prices to support shale growth, the team asked: “is the beginning of the end for the great bear market in oil?”
Bernstein’s U.S. supply model calls for about 15,600 wells over the next 11 years, but the analysts note that sub-$60/bbl oil won’t support this outlook.
Click here for more information like this.
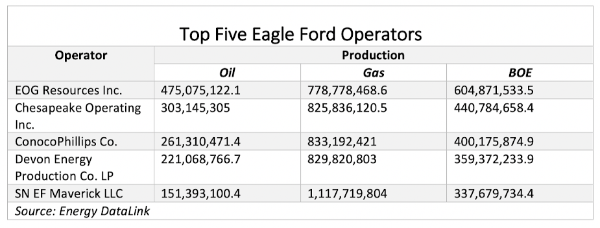
The analysts also discussed the Eagle Ford production rates for 2019 of some of the companies in its coverage. For example, EOG Resources Inc.’s cumulative production fell 6%. Chesapeake Energy Corp.’s also declined by 12%; and Devon Energy Corp.’s by 29%.
However, Bernstein said the negative effect is felt less by companies such as EOG that have broader portfolios. “While an aging Eagle Ford is good for oil prices [and thus net positive for non-Eagle Ford producers], it’s likely bad for Eagle Ford pure plays,” the analysts added.

Recommended Reading
Hess Corp. Boosts Bakken Output, Drilling Ahead of Chevron Merger
2024-01-31 - Hess Corp. increased its drilling activity and output from the Bakken play of North Dakota during the fourth quarter, the E&P reported in its latest earnings.

Murphy Oil Names Eric Hambly as President, COO
2024-02-08 - Murphy Oil has promoted Eric M. Hambly to president and COO and E. Ted Botner to executive vice president. Both will continue to report to CEO Roger W. Jenkins.

SLB’s ChampionX Acquisition Key to Production Recovery Market
2024-04-19 - During a quarterly earnings call, SLB CEO Olivier Le Peuch highlighted the production recovery market as a key part of the company’s growth strategy.

Texas Pacific Land Approves Three-for-one Stock Split
2024-03-10 - Each stockholder of record as of March 18 will be distributed two shares for each share owned.

Jerry Jones Invests Another $100MM in Comstock Resources
2024-03-20 - Dallas Cowboys owner and Comstock Resources majority shareholder Jerry Jones is investing another $100 million in the company.