
[Editor's note: This article originally appeared in the October issue of E&P Plus. Subscribe to the digital publication here.]
Now more than ever, operators are focused on methods of improving well performance to reduce costs and increase production. Much of that improvement is centered on well spacing, completion designs and surface efficiency. Drawdown management during the IP period—or flowback—is an often overlooked means of improving well performance. The data collected during this early-time flowback period offers one of the first glimpses of valuable information that helps to evaluate well performance and reservoir responses.
Many operators tend to either flow wells too aggressively or too conservatively. This approach is often derived from rules of thumb or simplified diagnostics that fail to capture the true effects of drawdown on well performance. A real-time workflow must be used to evaluate flowback data to optimize the drawdown strategy so operators can maximize the production of each well, in the shortest amount of time, all without damaging the reservoir or completion.
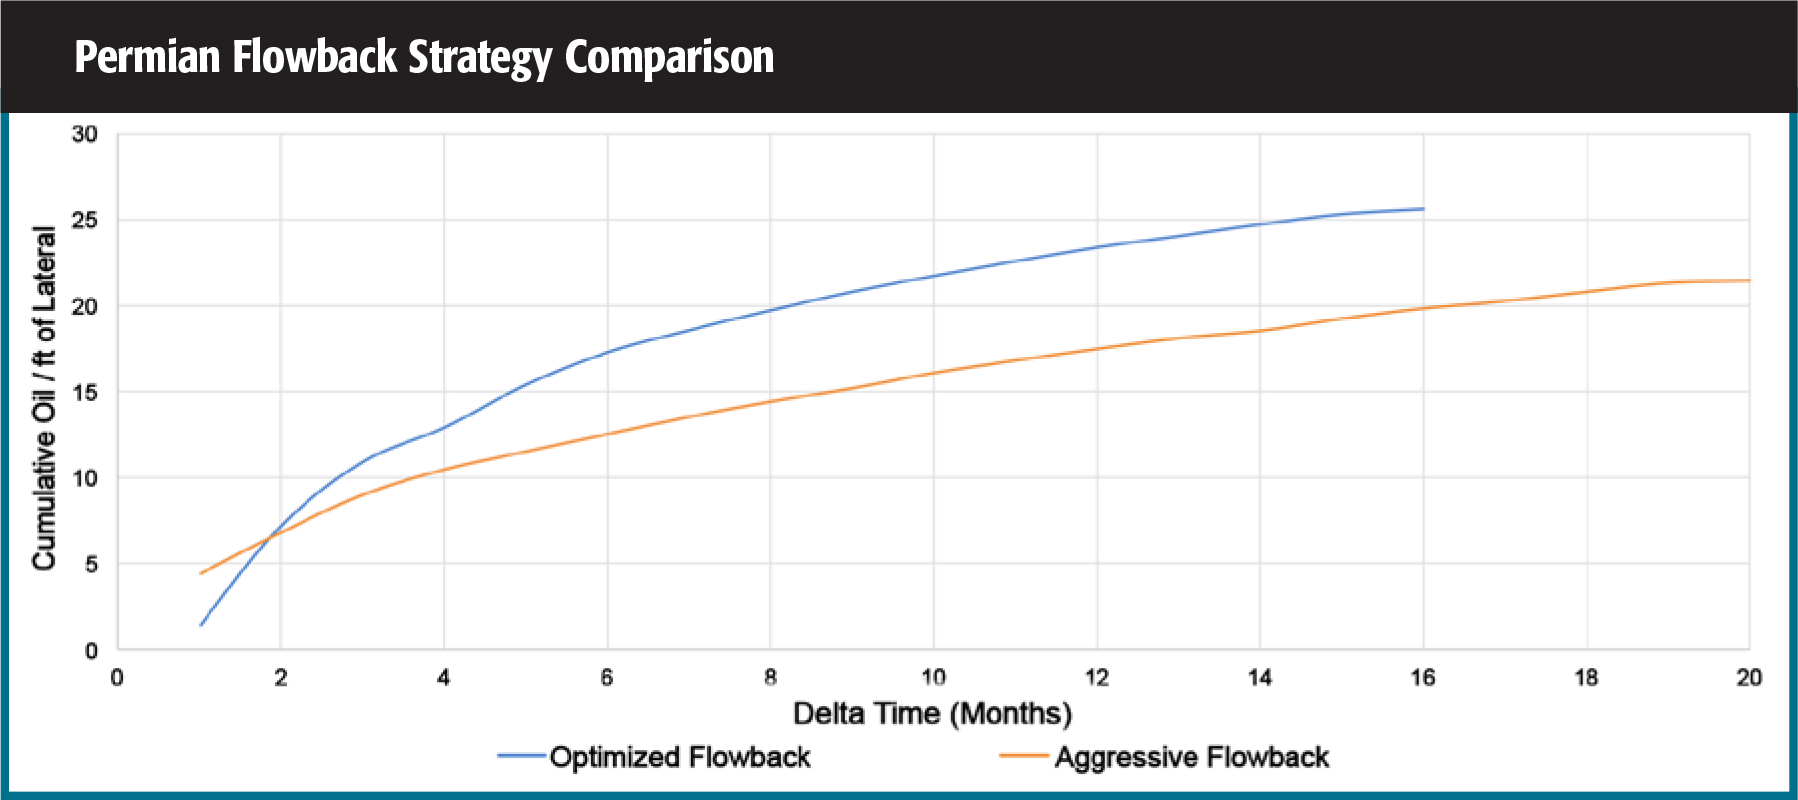
Revo Testing Technologies has developed an integrated workflow that has been successfully utilized on more than 500 unconventional wells to optimize drawdown strategies during IP. The workflow incorporates a proppant mobilization model, real-time well performance visualizations and specialized diagnostic techniques. Side-by-side comparisons have been completed in every major unconventional basin. These comparisons were done on optimized wells versus wells that employed aggressive flowbacks—and the wells had similar completion and reservoir parameters. The comparisons have consistently shown Revo’s drawdown optimization workflow improves well performance compared to an aggressive flowback strategy.
Generalized Workflow
Significant research has been conducted on flowback optimization and diagnostic techniques. Improvements in well performance have been observed in the field when managed pressure drawdown strategies are employed. Many operators utilize additional sand management equipment during flowback to handle high sand volumes believing that high flow rates create better wells. This adds additional costs to handle excessive sand rates at surface, and this approach has been shown to decrease well performance.
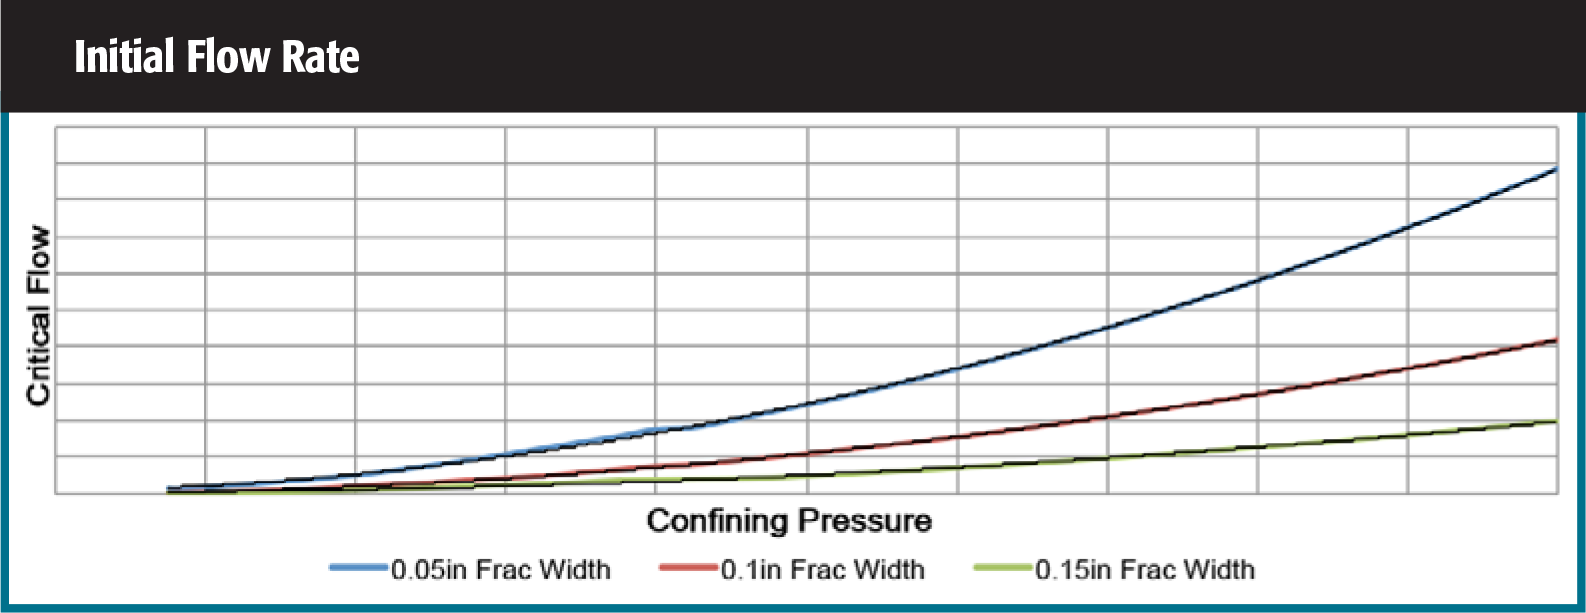
Revo uses an algorithm to calculate the minimum mobilization velocity of proppant in the fractures when confinement stresses are low at the beginning of flowback. This helps determine the initial target rate and choke size so proppant is not washed out of the fractures when the well is first brought online.
As confinement stress increases during IP, and more of the lateral begins to contribute to total flow, the well can then start to be flowed more aggressively. By simply flowing the well a bit more slowly in the beginning, sand volumes and the associated equipment costs to handle these solids can be significantly reduced and well performance can be improved.
Garbage In, Garbage Out
After the initial flow rate of a well is determined, an initial choke size can be selected to bring the well online without mobilizing proppant from the fractures. Some wells produce oil, some produce gas, but all wells produce data, and those data need to be of the highest quality possible to accurately assess well performance in real time and to optimize the drawdown strategy. Once the initial target rate and choke size is established and the well is brought online, the next step is to assess data quality and identify possible measurement errors. Measurement errors cause significant ambiguity in well performance analysis and can mask reservoir responses.
Surface rate measurement errors can be caused by a variety of sources. The most common sources tend to be from poor measurement methods and poorly trained onsite personnel that are not operating the testing equipment correctly. Simply taking manual readings at inconsistent times, from one hour to the next, has been shown to introduce significant noise into the data, making real-time performance evaluations nearly impossible. Revo utilizes the Revo iQ software from the FlowSmart solution set to identify and diagnose surface rate measurement errors. Deploying this software, Revo can assess real-time well performance and help optimize customers’ drawdown strategies during flowback.
The Revo iQ software can be used to quickly diagnose surface rate measurement errors and asses real-time well performance using its built-in performance indicators and data visualizations.
Properly Assessing Well Performance During Flowback
After the initial target rate is determined and data quality has been assessed in the Revo iQ dashboard, real-time diagnostics are used to evaluate well performance. This performance evaluation is based on the drawdown resulting from each choke change. A common misconception in the industry is that flow regimes seen during long-term production—and the associated superposition time functions used to analyze them—are applicable to flowback. After analyzing more than flowbacks, Revo experts do not see evidence to support this notion.
The Revo engineering team utilizes a transient diagnostic analysis method for drawdown optimization that addresses the dynamic multiphase flow conditions that are encountered during flowback. This analysis method allows the Revo team to see the effects that the drawdown strategy has near-wellbore and far field. This allows the drawdown strategy to be adjusted for areas that experience pressure-dependent well performance.
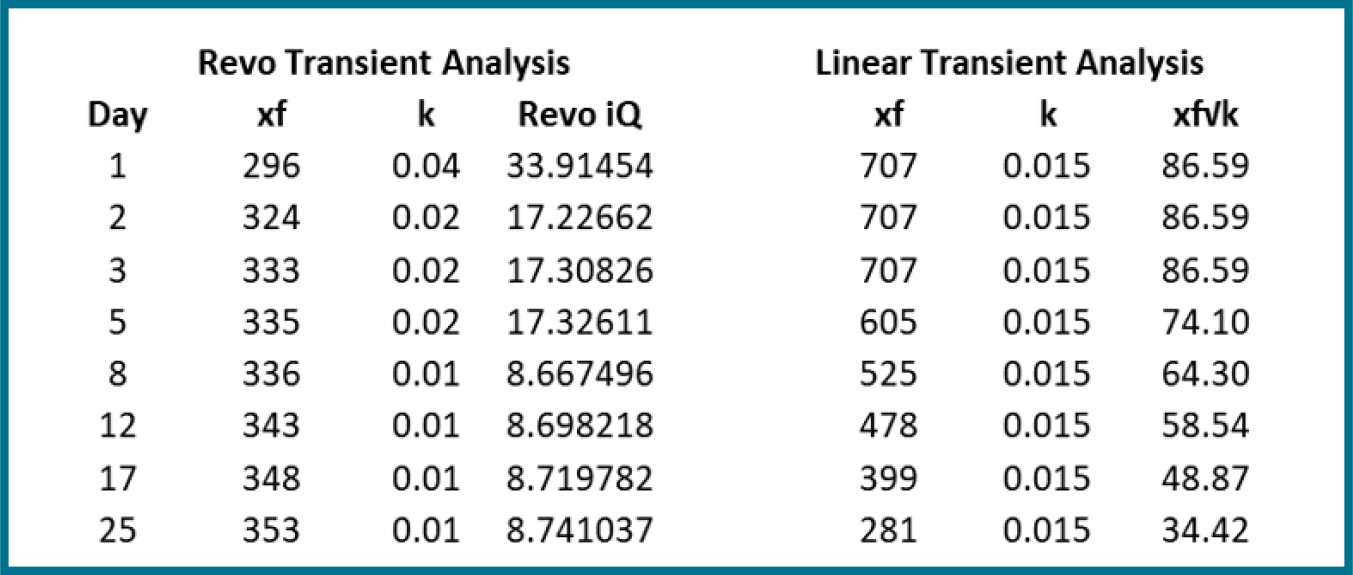
During flowback, the permeability should initially look high as the well is producing primarily from a high permeability proppant pack. Additionally, the fracture surface area available to flow hydrocabons is relatively small because the fractures are full of water, thus the apparent system fracture halflength appears small. As the flowback progresses and the well cleans up, more of the fracture surface area flows hydrocarbons resulting in an increase to the apparent system fracture halflength. At the same time, more of the production is coming from the matrix, so the system permeability decreases. The effect of increasing apparent system fracture half-length—caused by well cleanup and decreasing system permeability from initially producing from a high-permeability proppant pack, and then transitioning to lower permeability matrix—cannot be seen using traditional linear flow diagnostics that are typically applied to long-term production data.
Not only is linear flow not typically seen during flowbacks when chokes are changed frequently (once at least every 48 hours), but because the far-field transmissibility (k) and apparent system fracture half length (xf) are lumped into a single linear flow parameter term, one of them has to be assumed to determine the other. The traditional assumption of constant permeability is not appropriate for capturing the dynamic effect that occurs during flowback. The transient diagnostic method used by Revo determines system permeability and system fracture half-length independent of each other, so the effect of increasing fracture half-length and decreasing permeability during flowback can clearly be seen. Changes in either of these parameters, caused by the drawdown from choke changes, guides operational decisions to improve well performance.
To optimize the drawdown of a well, it is important to first determine the maximum rate the well can be flowed to avoid mobilizing proppant from the fractures. Second, high-quality data are essential, and the data constantly need to be assessed for surface rate measurement errors that can affect the interpretation of real-time well performance. Finally, a diagnostic analysis that can account for the dynamic nature of flow seen during flowback is required to properly evaluate well performance.
Recommended Reading
Scotland Ditches 2030 Climate Target to Cut Emissions by 75%
2024-04-18 - Scotland was constrained by cuts to the capital funding it receives from the British government and an overall weakening of climate ambition by British Prime Minister Rishi Sunak, said Mairi McAllan, the net zero secretary for Scotland's devolved government.

Exclusive: Mitsubishi Power Plans Hydrogen for the Long Haul
2024-04-17 - Mitsubishi Power is looking at a "realistic timeline" as the company scales projects centered around the "versatile molecule," Kai Guo, the vice president of hydrogen infrastructure development for Mitsubishi Power, told Hart Energy's Jordan Blum at CERAWeek by S&P Global.

Google Exec: More Collaboration Needed for Clean Power
2024-04-17 - Tech giant Google has partnered with its peers and several renewable energy companies, including startups, to ramp up the presence of renewables on the grid.
Hirs: Aspirations Meet Reality—The Undisclosed High Cost of the Energy Transition
2024-04-16 - The nation is trying to keep up with the growth of renewable power resources, but before transmission lines can be built, the power plants must first have interconnects with the grid.